How To Solve America’s Inner City Crime Crisis

In Switzerland, everyone has an assault rifle, and they have the lowest crime rate in the world. By contrast, the US has serious crime problems in cities where guns are illegal.

The US Supreme Court proposed a simple solution this week. Have Congress pass the WASRcare bill, which will require that everyone purchase an assault rifle by the year 2014. If anyone isn’t armed by then, they will have to pay a tax penalty tax penalty tax

Posted in Uncategorized | 18 Comments

He Even Looks Like A Banana Republic Dictator

After Chavez dies, perhaps Obama can take over in Venezuela?

Obama presses claim that Romney outsourced jobs to China and India | World news | guardian.co.uk

Even the Guardian has figured out that Obama is a liar.

Posted in Uncategorized | 13 Comments

Worst Article Ever From The Capital Weather Gang?

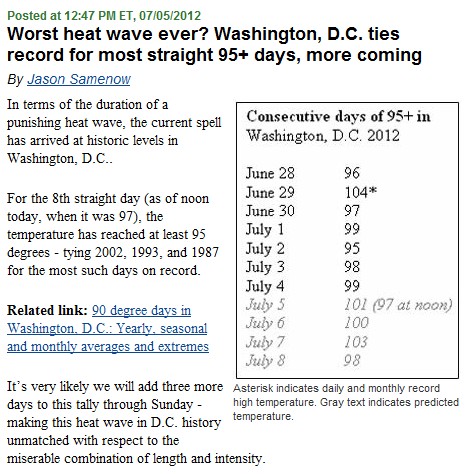
Worst heat wave ever? Washington, D.C

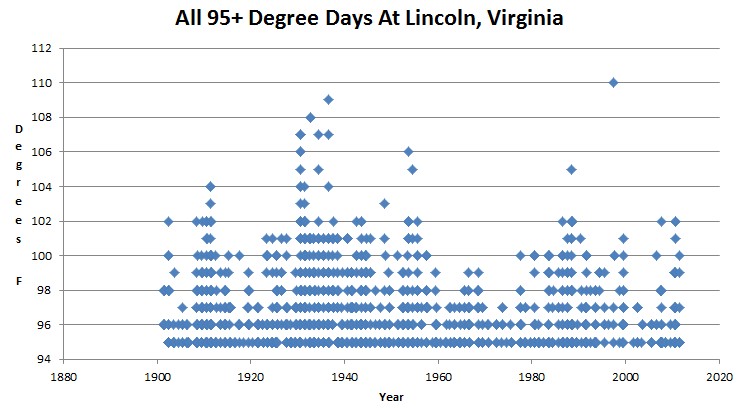
The worst heat wave ever? The graph below shows all 95+ degree days in Lincoln, Virginia  since 1900. (Lincoln is the closest USHCN station in Virginia to DC.)

Heatwaves were much worse in the past, and 95 degree days were far more common prior to 1960.

U.S. Historical Climatology Network

1936 had 33 days over 95F, including this remarkable stretch of consecutive days, which included 109F on July 10, 1936.

Jul-08 98
Jul-09 107
Jul-10 109
Jul-11 104
Jul-12 97

Wouldn’t it be nice if the Washington Post told the truth, once in a while? The 1930s were much hotter, period. Rewriting the history of the 1930s used to be the work of Holocaust deniers, but they have been joined by climate alarmists.

Posted in Uncategorized | 4 Comments

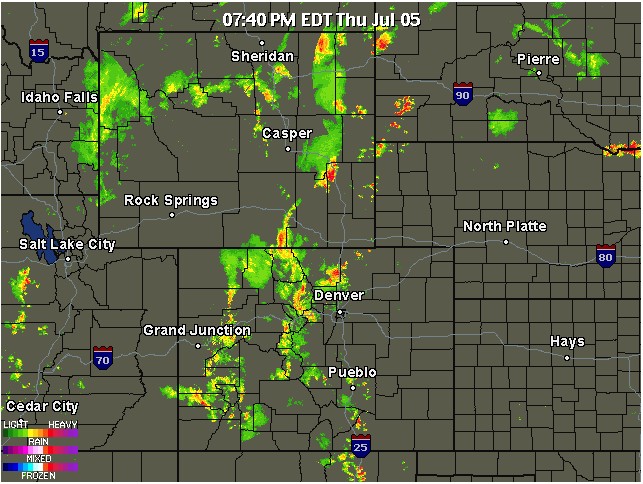
July 4th Grinch In Fort Collins

We had no fireworks in Fort Collins. The city called off the show (which takes place a in a large, heavily watered city park) because they were concerned about fire.

The reason I am writing this post now is because it is raining too hard to ride to the store. Eventually government will make the world completely safe by plugging us in and giving us all little red and blue pills.

Posted in Uncategorized | 5 Comments

Jim And Karl’s Totally Bogus UHI Adventure

Adjustments to account for warming due to the effects of urbanization (purple line) cooled the time series an average of 0.1F throughout the period of record.

The cumulative effect of all adjustments is approximately a one-half degree Fahrenheit warming in the annual time series over a 50-year period from the 1940’s until the last decade of the century.

GHCN Global Gridded Data

The mechanism that NOAA used for cheating the Oklahoma temperatures last summer, was upwards adjusting all recent temperatures more than half a degree – without properly adjusting downwards for UHI effects.  Their total UHI adjustment is a ludicrous -0.06C.

Compare this to their own research.

Phoenix :

the urban locations displayed an apparent upward increase through the time series (1910 through 2000), which was attributed to the urban growth of the region. By the end of the series, there was a +4 to 7 ºC (7 to 13 ºF)difference between the urban minimum temperatures and the rural minimum temperatures. Interestingly, no upward trend was found in the maximum temperatures

National Weather Service – NWS Phoenix

Barrow – a small town:

During winter (December 2001–March 2002),
the urban area averaged 2.2 °C warmer than the hinterland. The strength of the UHI increased as the wind velocity
decreased, reaching an average value of 3.2 °C under calm (<2 m s?1) conditions and maximum single-day magnitude of
6 °C.

www.cas.umt.edu/geography/documents/Hinkel_etal_2003_winter_UHI.pdf

New York :

Surface air temperature readings from these stations show that the city was several degrees warmer than the suburbs, and up to 8°C warmer than rural areas within 100 km of the city, with conditions that had been sustained throughout the previous night.

pubs.giss.nasa.gov/docs/2009/2009_Rosenzweig_etal.pdf

By using a completely bogus token UHI adjustment of -0.06C (which is more than an order of magnitude too small) NOAA was able to smear in severely UHI affected nighttime temperatures, and get the average temperatures up for their press release.

Of course they failed to mention that maximum temperatures were much higher in 1913, 1934 and 1936.

Posted in Uncategorized | 7 Comments

EDF Parroting NOAA Disinformation About Oklahoma

EDF making bogus comparisons to the Dust bowl

It is becoming increasingly difficult to understand the disconnect between Oklahoma Senator James Inhofe and the threat of rising temperatures to his own constituents. Last year, Oklahoma endured the hottest summer ever recorded in U.S. history. According to the National Climatic Data Center, Oklahoma’s average temperature last summer was 86.9 degrees.

The previous record for the hottest summer was set in the midst of the Dust Bowl, again in Oklahoma. The Dust Bowl literally blew Oklahoma’s farmers off their land, along with their topsoil. No one wants a repeat of that.

What’s alarming is that the previous record of 85.2 degrees, set in Oklahoma in 1934, was almost two degrees cooler than summer 2011!

Is Senator Inhofe really looking out for Oklahoma?

Yet another attempt to rewrite history. The Dust Bowl years were much hotter and much drier in Oklahoma.  Oklahoma City had 55 days last year over 100 degrees, compared to 72 days in 1936, 68 days during 1913, and 58 days during 1934.

Three summers have had maximum temperatures averaging over 100 degrees, but 2011 was not one of them. June through August maximum temperatures averaged 102.2 degrees in 1936, 101.7 degrees in 1913, 100.5 degrees in 1934, and 99.3 degrees in 2011.

But what really stands out is the number of very hot days over 110 degrees. Almost all of Oklahoma City’s 110 degree days occurred before 1960.

Here is the real kicker.  The summer of 1913 had twenty-two days over 110 degrees, compared to two days during the summer of 2011 – which NOAA says was the hottest summer.
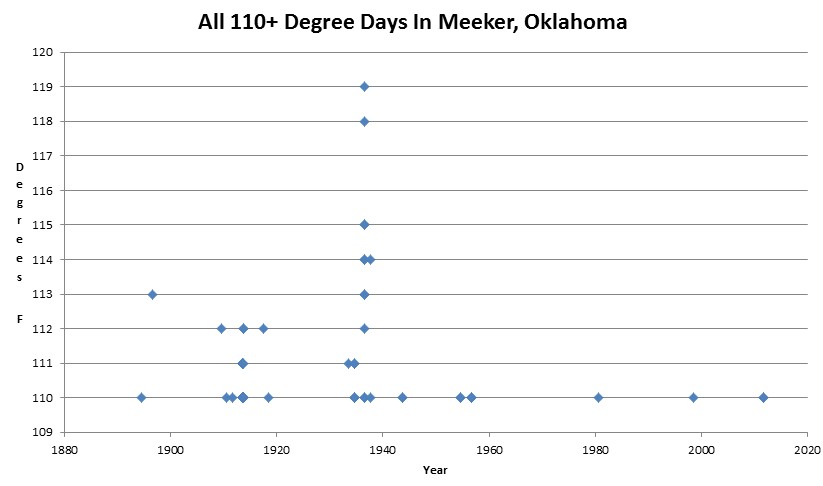
U.S. Historical Climatology Network

The hottest month was August 1913.  July 2011 afternoon temperatures were almost five degrees cooler than 1913.  

Meeker Oklahoma USHCN Temperatures
Month    Year   Average Max   Mean   Average Min
August   1913         106.4   89.5          72.2
August   1936         105.8   90.1          73.7
July     2011         101.9   89.0          75.6

NOAA tampers with the data, and fails to account for major UHI nighttime temperature effects. Then they release selective misinformation to be used by propagandists like EDF.


Posted in Uncategorized | 17 Comments

Obama Working To Make The Power Blackouts Permanent

A geothermal energy company with a $98.5 million loan guarantee from the Obama administration for an alternative energy project in Nevada — which received hearty endorsements from Energy Secretary Steven Chuand Senate Majority Leader Harry Reid — faces financial problems, and the company’s auditors have questioned whether it can stay in business.

Much like Solyndra LLC, a California solar-panel manufacturer with a $535 million federal loan guarantee that went bankrupt, Nevada Geothermal Power (NGP) has incurred $98 million in net losses over the past several years, has substantial debts and does not generate enough cash from its current operations after debt-service costs, an internal audit said.

Lights go dim on another energy project – Washington Times

h/t to tckev

Posted in Uncategorized | 16 Comments

“The Weather Never Used To Be Like This”

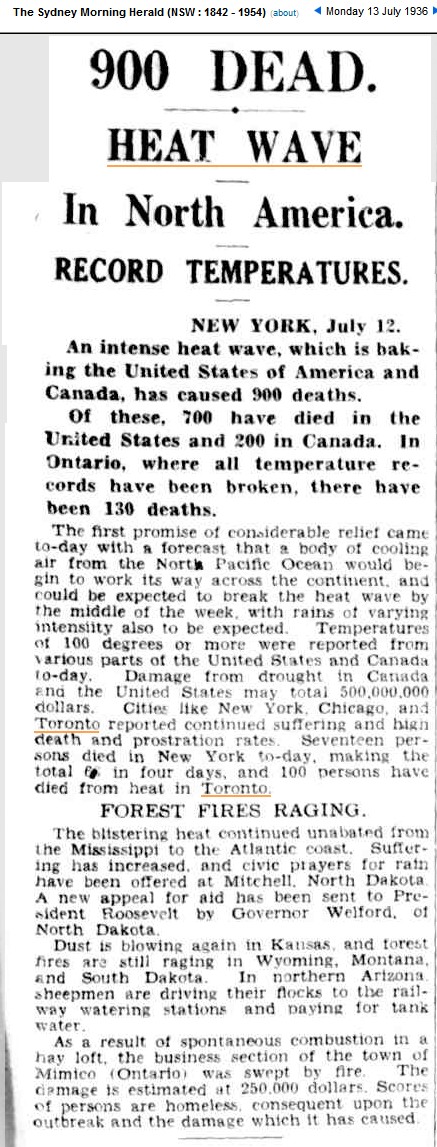
I was on a conference call to Toronto this morning, and several people were discussing the heat – saying “it never used to be like this.”

13 Jul 1936 – 900 DEAD. HEAT WAVE In North America. RECORD TEM…

Posted in Uncategorized | 7 Comments

Why Doesn’t The US Geological Survey Know The Fundamentals Of Geology?

Why doesn’t climate science peer review involve any actual review?

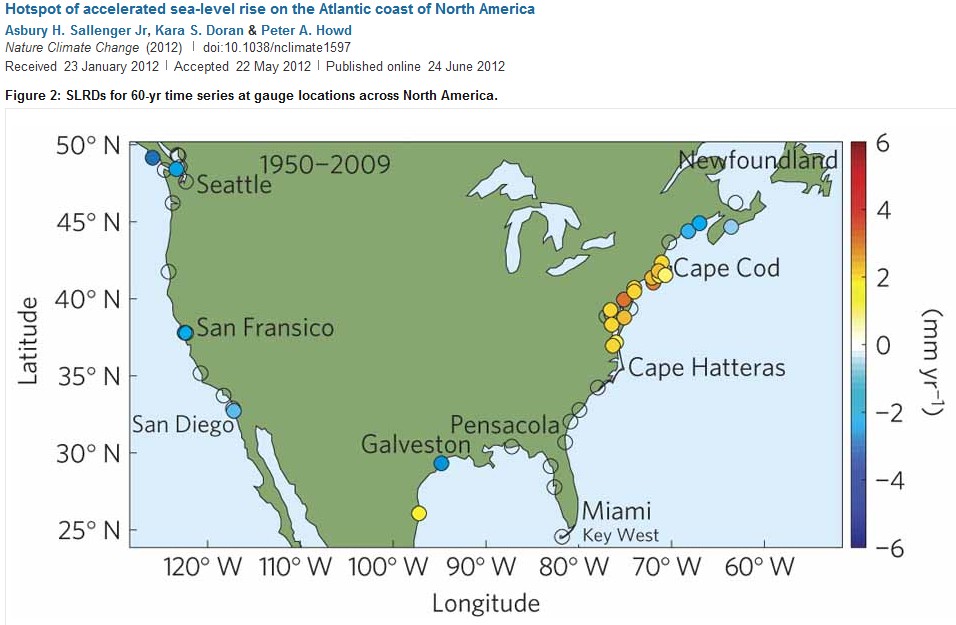
Nature recently published this ingenious paper claiming a “sea level rise hotspot” between Cape Hatteras and Cape Cod.

SLRDs for 60-yr time series at gauge locations across North America. : Hotspot of accelerated sea-level rise on the Atlantic coast of North America : Nature Climate Change : Nature Publishing Group

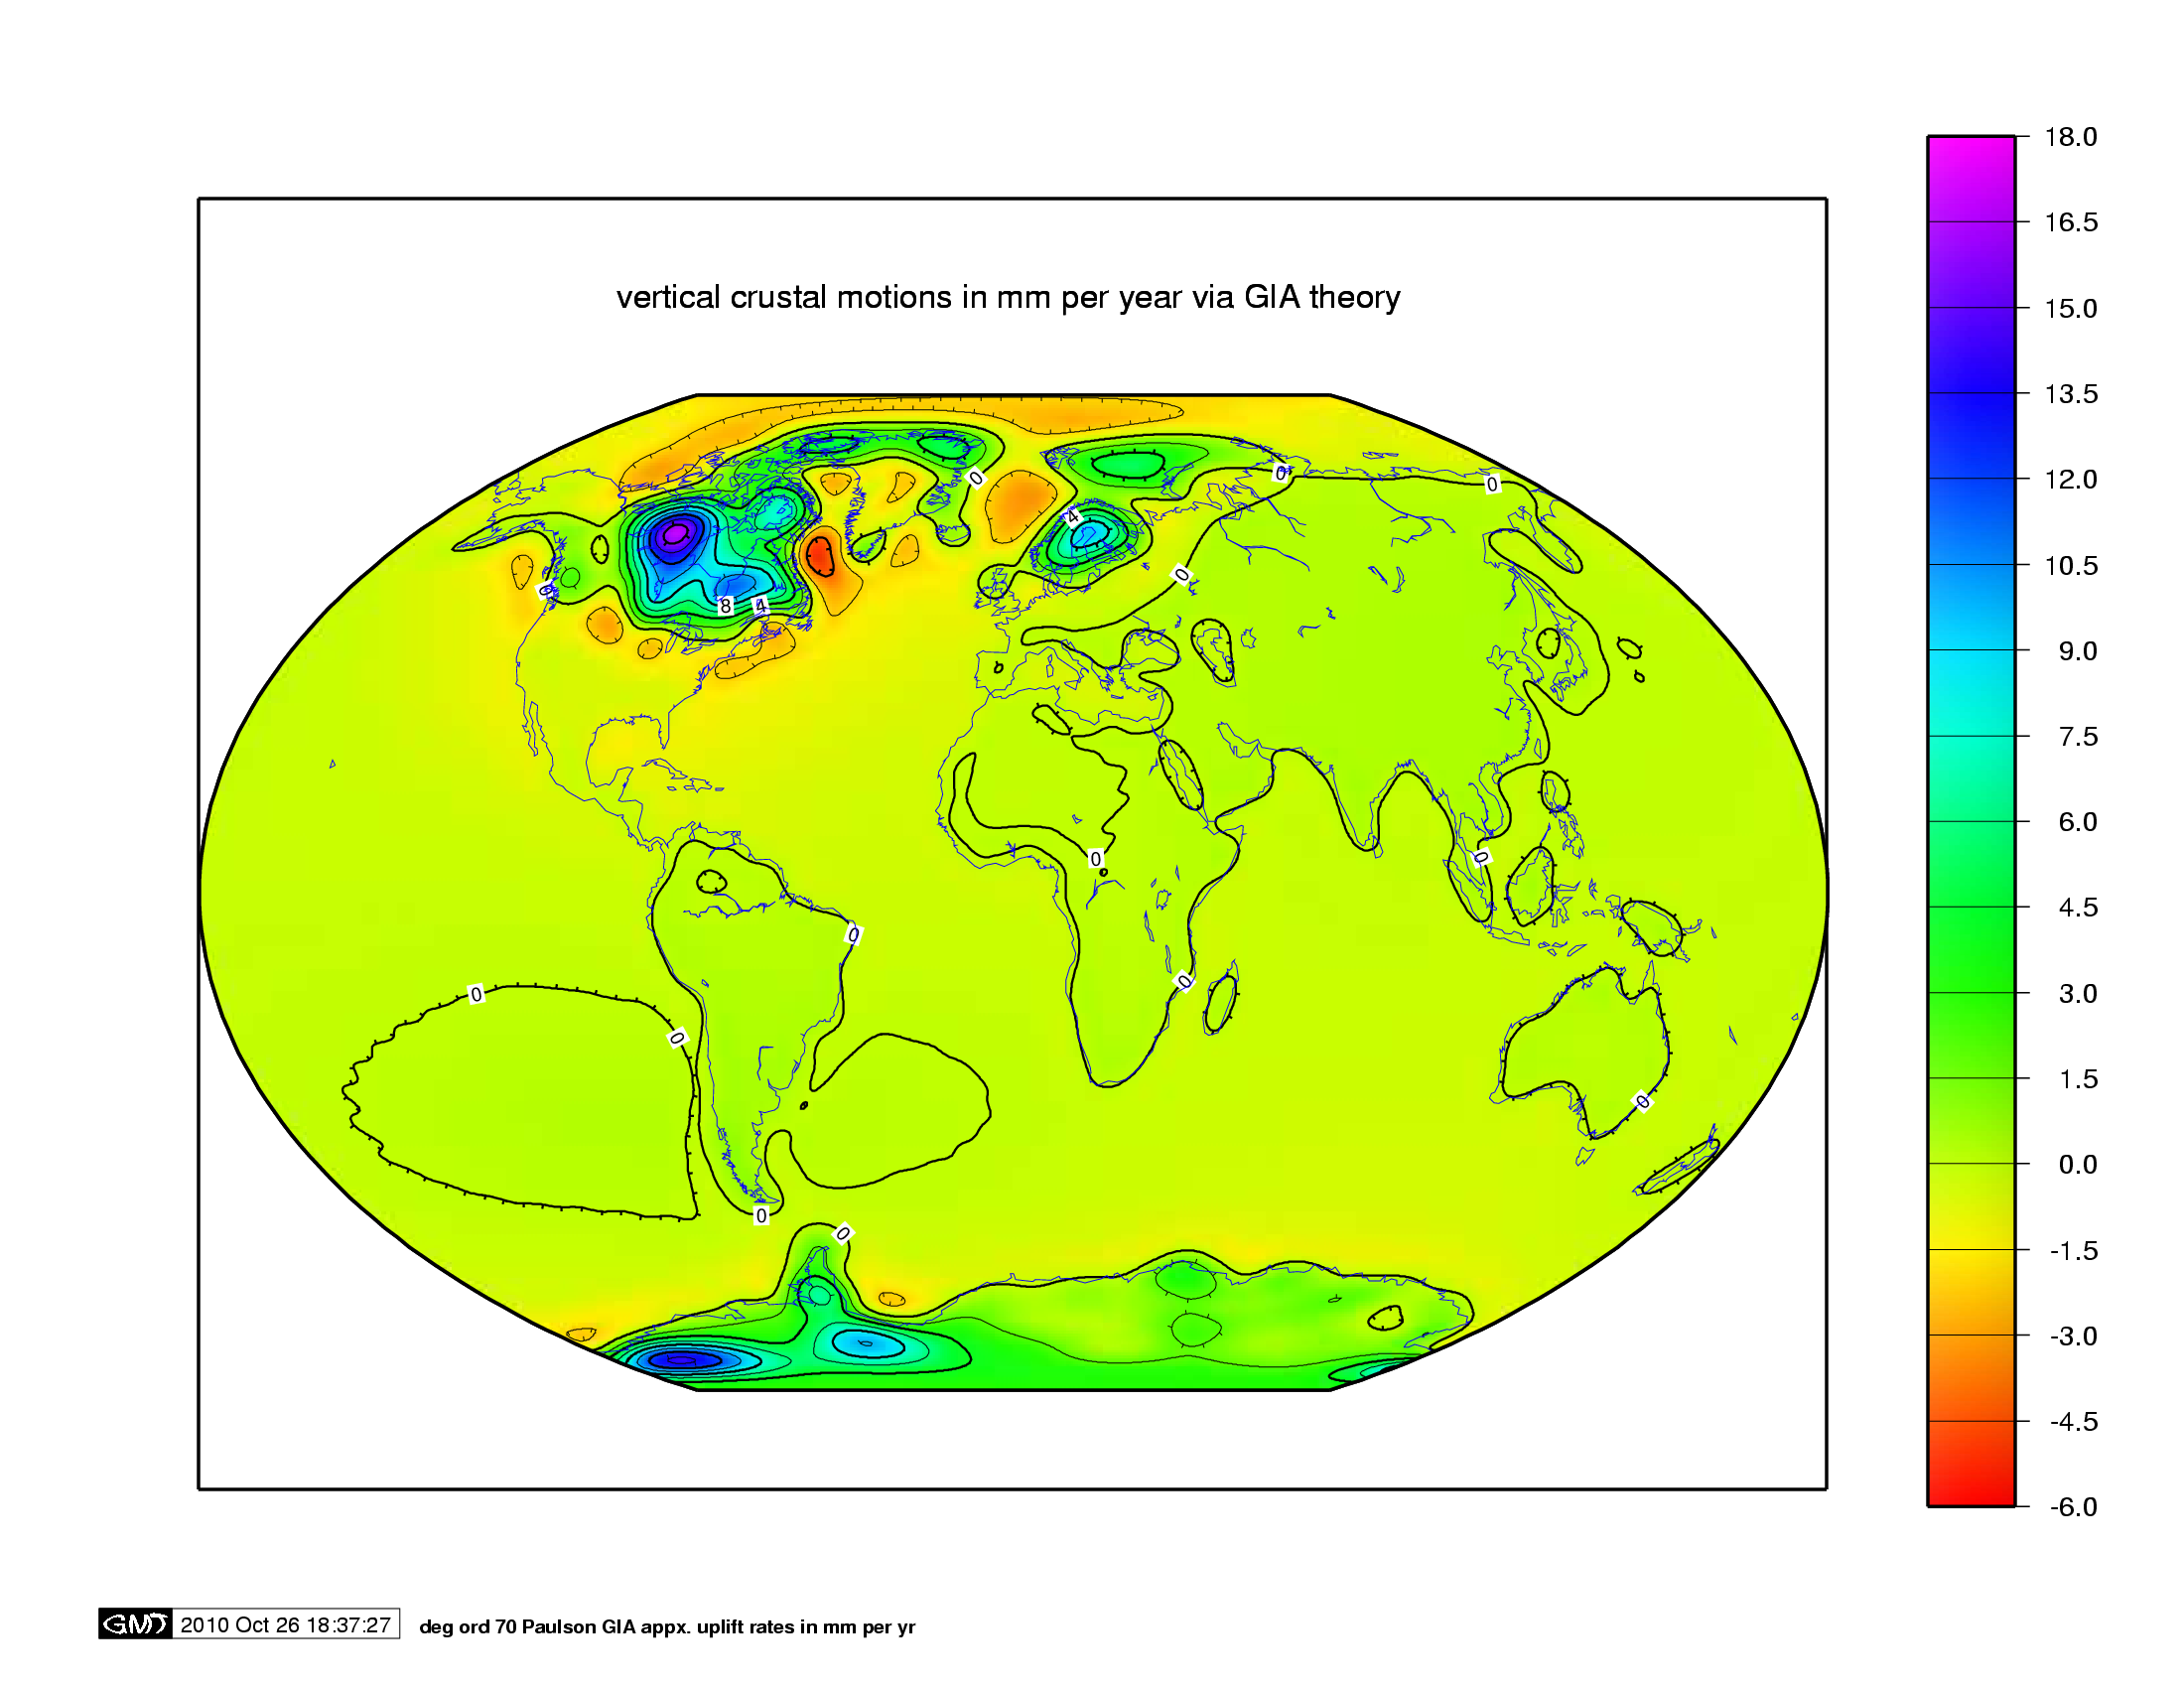
Satellite measurements don’t show this “hot spot” – only tide gauges, indicating that the land is sinking rather than the ocean rising. The geology of the region is well understood – glacial rebound from the last ice age is causing the “hot spot” to sink at the same rate as the rise measured by tide gauges.

PGR_Paulson2007_Rate_of_Lithospheric_Uplift_due_to_PGR.png (2200×1700)

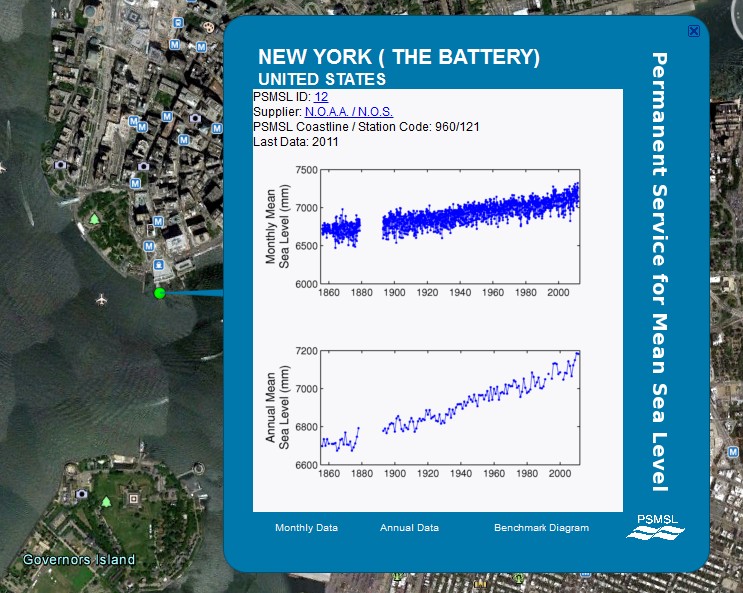
Besides the fact that they missed the fundamental geological point, their claim of “accelerated sea level rise” is also bogus. The tide gauges show no acceleration, just a steady subsidence of the land over the last 160 years. The fastest sea level rise actually occurred during the 1930s.

http://www.psmsl.org/data/obtaining/stations/12.php

It took me about 15 seconds of reading the study to recognize the horrific error they had made – yet the paper managed to get through peer review at the “prestigious” Nature Magazine.

h/t to Marc Morano

Posted in Uncategorized | 15 Comments

Fireworks Called Off In Greenland

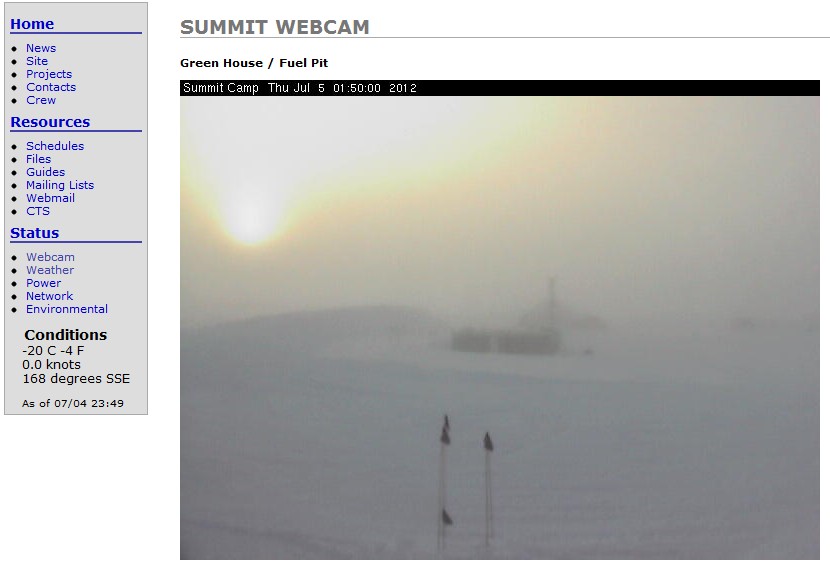
The snow and -20C weather put a damper on the Fourth of July festivities on the Greenland ice sheet.

summit:status:webcam

Posted in Uncategorized | 1 Comment