July 2009 : Coldest On Record In The Midwest

Coldest July on record across Midwest

CLEVELAND, Ohio — Record or near-record cold swept much of the middle part of the nation in July — with some records being broken from the 1860s

A July record were set in Cincinnati (70.1 degrees – 6.2 degrees below normal), Columbus had its fourth-coldest July (4.7 degrees below normal) and Dayton had its second-coldest July. Dayton’s mark was colder than the weather in Cleveland at 69.6 degrees, or 4.7 below normal.

Records were also set in Michigan cities of Flint and Saginaw, while Detroit had its third-coldest July in more than 100 years.

Indianapolis had its second-coldest July on record, behind only 1947.

Chicago had its ninth-coldest, but second coldest since its weather station moved further away from Lake Michigan in 1942.

http://blog.cleveland.com

Posted in Uncategorized | 1 Comment

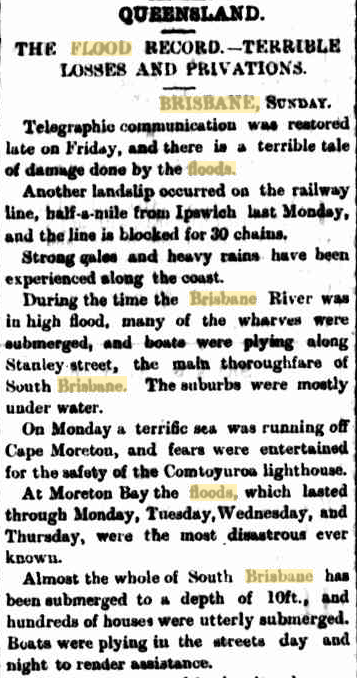
1893 : Record Flood In Queensland

http://trove.nla.gov.au/

Posted in Uncategorized | Leave a comment

1864 : Record Floods In Queensland

http://trove.nla.gov.au/

Posted in Uncategorized | Leave a comment

1887 : Brisbane Under 15 Feet Of Water

http://trove.nla.gov.au/

Posted in Uncategorized | Leave a comment

1890 : Brisbane Under 10 Feet Of Water

http://trove.nla.gov.au/

Posted in Uncategorized | 2 Comments

“And why aren’t we being told that Brisbane has had floods in the 1890s of over eight metres.”

The Liberal National Party president has blasted the Queensland education system for “brainwashing” students about climate change.

Speaking to LNP members at the party’s state conference today, Bruce McIver said he was discouraged about how children were being taught about climate change in schools.

Mr McIver said he was shaken by the way issues were being taught when he and his wife visited their grandson’s school.

“We were shocked at the way the climate change debate on one side is being pushed in the classroom,” he said.

“And not balanced perspectively. Our kids are being brainwashed under this Labor education system.”

Mr McIver’s comments received loud applause from more than 700 delegates from throughout the state.

“Why aren’t they being told that if you go to Quilpie and you drive to Windorah – [Liberal National Party MPs] Vaughan Johnson’s country, Howard Hobbs’ country – you will see these sand hills that have been blown up years ago,” he said.

“When the droughts were much bigger than the ones we have just had.

“And why aren’t we being told that Brisbane has had floods in the 1890s of over eight metres.

“[LNP leader] Campbell [Newman] tells me that back in the 1820s – even before white man even came here – there were floods that could have been over 12 metres at the post office at the bottom of Elizabeth Street.

“So, things change. Climate is constantly changing. Is man having an effect? Well I will leave it for you to judge.”

http://www.melbournetimesweekly.com.au/

Posted in Uncategorized | 2 Comments

Signs And Visions Everwhere

The signs of global warming are everywhere. A hot day in July. A rainstorm. A butterfly or mosquito. A heavy snow or no snow at all. An earthquake or a volcanic eruption. Snow in Florida or Saudi Arabia. A polar bear swimming. A penguin chick dancing in a 3D animated movie.  A drought or heat in Texas – has that ever happened before? A wave on the beach.

You name it, the signs of human caused global warming are unmistakeable.

Posted in Uncategorized | 1 Comment

Pay No Attention To The Woman Behind The Teleprompter

Umm, umm, let me be perfectly clear.

Posted in Uncategorized | Leave a comment

Julia Goes After The Gas Which Must Not be Named

In the final episode 7, Julia discovers that her political career must end if she is to finally kill off CO2 – the gas which must not be named. Late in the episode it is revealed that Julia is actually made up largely of carbon and that the wand of taxes truly belongs to her.

Posted in Uncategorized | Leave a comment

The Heat Index Map

Drudge keeps showing this map, which makes it look like 100 degrees is widespread in the central US. Northwest Iowa looks like 106.

Here is the actual temperature map. One station in Oklahoma is over 100 degrees. Northwest Iowa is actually 89, not 106. How lame can we get?


Posted in Uncategorized | 2 Comments