They successfully picked a loser to head the GOP and 2008, and are frightened that Palin is making them lose control of the process. The left wing hate machine has cranked up in overdrive.

They successfully picked a loser to head the GOP and 2008, and are frightened that Palin is making them lose control of the process. The left wing hate machine has cranked up in overdrive.
Which person is more racist?
Person A. Likes a politician because of his ethnicity
Person B. Dislikes a politician because of his incompetence, inexperience, and dishonesty
Group A pushes the high end of statistical boundaries to get a scary sounding story. Group B starts with group A’s results and then again pushes the high end of statistical boundaries with their conclusions. Group C does the same, and so on and so forth.
Once you compound a 20% error five times, you have a 250% error. That is where all these idiotic claims of 10 degree temperature rise, multi-metre sea level rise, etc. come from.
There is a fundamental institutional incompetence in the alarmist community which needs to be eliminated.
[youtube=http://www.youtube.com/watch?v=Fv4jnlkxOaw]
Obama’s father was born in 1936. He was nine years old when WWII ended. He must have served in the infantry.

http://en.wikipedia.org/wiki/Barack_Obama,_Sr.
h/t to Dave G

That is exactly what happened. Winter temperatures have plummeted during the last decade. In the US, they have gone down at a rate of 41 degrees per century.
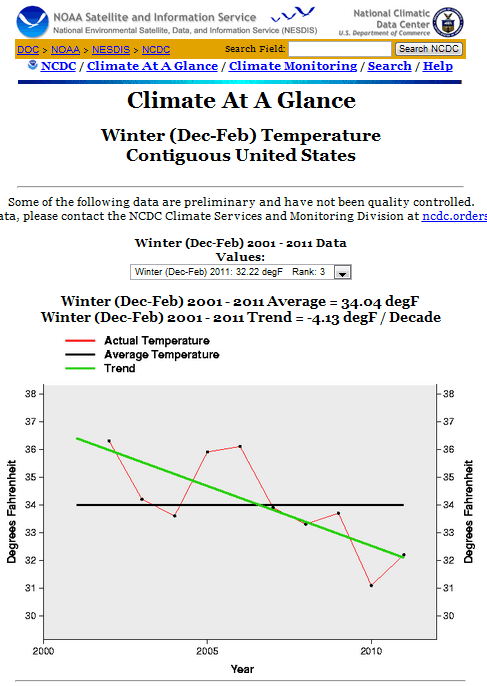
http://www.ncdc.noaa.gov/oa/climate/research/cag3/na.html
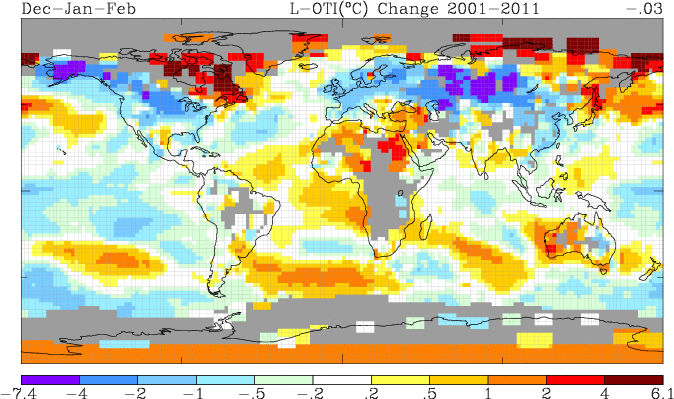
Winter temperatures in Russia and Alaska have dropped by as much as 7C over the past decade.
Three of the four snowiest winters have occurred during the past four years.
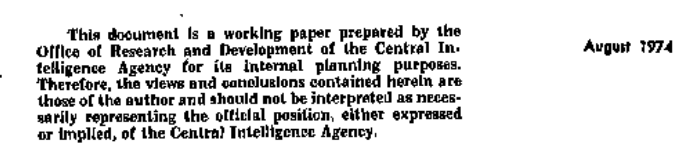
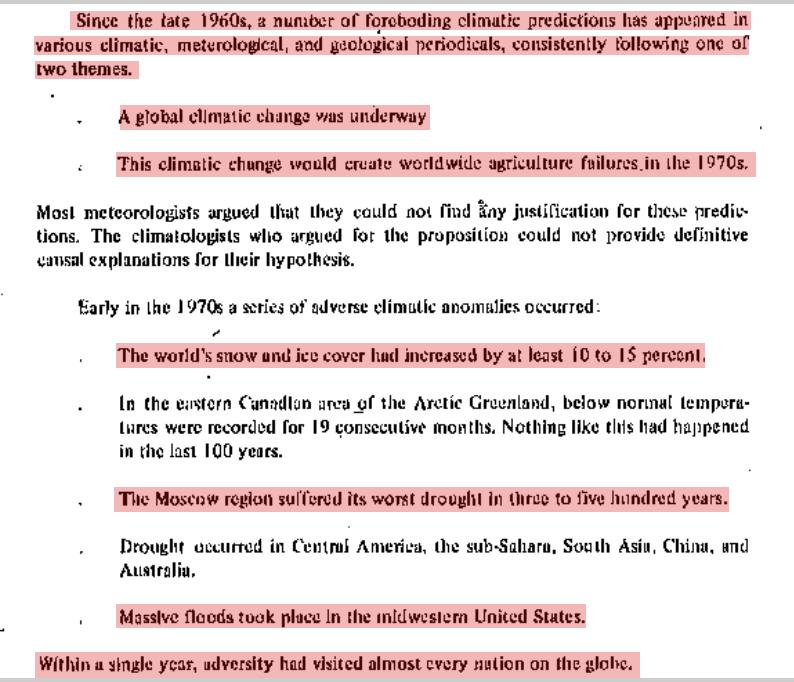
http://www.climatemonitor.it/wp-content/uploads/2009/12/1974.pdf
“The world’s snow and ice cover has increased by 10-15%”
“The Moscow region suffered its worst drought in three to five hundred years”
“Massive floods took place in the midwestern United States”
“Within a single year, adversity had visited almost every nation on the globe”
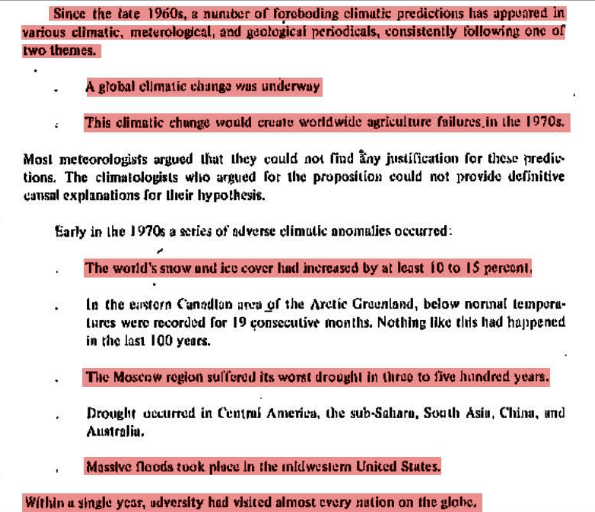
http://www.climatemonitor.it/wp-content/uploads/2009/12/1974.pdf
Chris Christie adviser Ken Miller wrote this E-mail (red italics) to Denis Ables who shared it with Marc Morano and myself. My comments are interspersed
Denis
I am not sure to what you are referring. The current estimate for global sea level rise is 3.1 mm/yr from three different groups, but see the NCAR group here http://sealevel.colorado.edu/The Legos (Laboratoire d’Etudes en Géophysique et Océanographie Spatiale) group reported slightly lower rates 2.5 mm.yr up to 2007 (Cazenave et al., 2008), but not < 1 mm/yr!!!
The newest sea level measuring satellite, Europe’s Envisat satellite shows less than 1mm/year, with sea level currently the lowest in their eight year record.
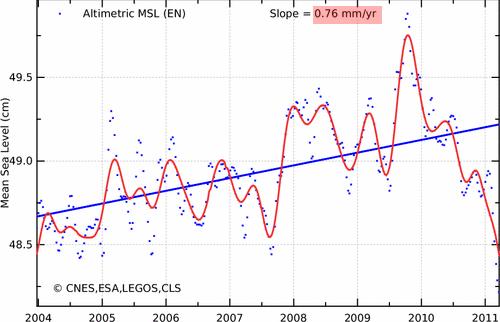
http://www.aviso.oceanobs.com/
Jason 2 also shows less than 2 mm/year
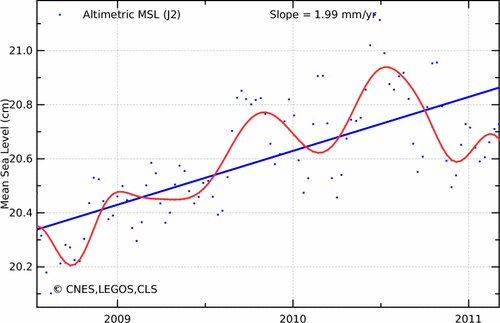
http://www.aviso.oceanobs.com/
The average of all currently active NOAA global tide gauges is less than half a millimeter per year.
http://tidesandcurrents.noaa.gov/sltrends/MSL_global_trendtable.html
https://spreadsheets.google.com/
Look at the local recordsAtlantic City, current 5 mm/yr; 1mm/yr is local subsidence, 1 mm/yr is regional subsidence
I have no idea where he got the 5mm/year number. PSMSL shows sea level rising at 1.5 mm/year in Atlantic City over the last 15 years. The long term rise is less than 4 mm/year.
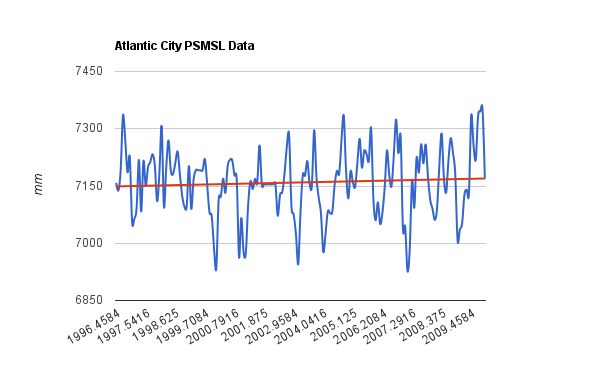
http://www.psmsl.org/data/obtaining/stations/180.php
Lewes, DE and Battery are 4 mm/yr, 1 mm/yr is regional subsidence
by the end of the century it would be 45 cm rise at Atlantic City and 40 cm at other Jersey locations; this is only slightly greater than 20th century which saw 40 and 30 cmm rises, respectively
PSMSL shows about 1/3 of the number Ken Miller is claiming for the current rise rate. But in the original article, he was actually claiming almost 100cm. He was off by an order of magnitude.
But sea is accelerating.
No it isn’t. All of the satellites show a decline in rise rates over the last five years.
Recent estimates from satellite data show a trend of -36 Gt/yr2 ice loss from Greenland and Antarctica, or about 0.1 mm/yr acceleration. This means by 2050, temperature expansion alone yields 9 cm, mountain glaciers yield 8 cm, and Greenland and Antarctica yield 15 cm, for a total of 32 cm (~1 foot) according to Rignot et al
By 2100, Greenland and Antarctica yield >0.5 m, plus the 20-60 cm computed for mountain glaciers and thermal expansion.
The conclusions for Greenland and Antarctica come from JPL (Rignot et al., 2011) and Laboratoire d’Etudes en Géophysique et Océanographie Spatiale (Czaenave et al.). I stand by the ‘rithmetic.
Ken Miller
Those studies have been known to be flawed for about nine months.
Climate: New study slashes estimate of icecap loss
By Richard Ingham (AFP) – Sep 7, 2010
a new study published in the September issue of Nature Geoscience suggests that the true melt rate might be much slower than that. (Access a PDF of the study here.) A joint team of American and Dutch scientists took another look at the GRACE data and found that Greenland and West Antarctica may be melting just half as fast the earlier studies estimated. As researcher Bert Vermeersen, a professor at Delft University of Technology in the Netherlands, told the AFP, the earlier estimates failed to account for glacial isostatic adjustment—the rebounding of the Earth’s crust after the end of the last Ice Age:
http://www.google.com/hostednews/afp/article/ALeqM5iFYPF7wJrj-K5GTv1-oZsHhqrzIg
Conclusion, Ken Miller presented Governor Christie likely flawed sea level numbers, well outside of the range of IPCC projections.
Last time they got this hysterical about climate was when they were sure that global cooling was going to kill us all.
Newsweek May 29, 2011
In a world of climate change, freak storms are the new normal. Why we’re unprepared for the harrowing future.
Even those who deny the existence of global climate change are having trouble dismissing the evidence of the last year. In the U.S. alone, nearly 1,000 tornadoes have ripped across the heartland, killing more than 500 people and inflicting $9 billion in damage. The Midwest suffered the wettest April in 116 years, forcing the Mississippi to flood thousands of square miles, even as drought-plagued Texas suffered the driest month in a century. Worldwide, the litany of weather’s extremes has reached biblical proportions. The 2010 heat wave in Russia killed an estimated 15,000 people. Floods in Australia and Pakistan killed 2,000 and left large swaths of each country under water. A months-long drought in China has devastated millions of acres of farmland. And the temperature keeps rising: 2010 was the hottest year on earth since weather records began.
Newsweek reported the same story 36 years ago, with a different twist.
The Cooling World
Newsweek, April 28, 1975
There are ominous signs that the Earth’s weather patterns have begun to change dramatically and that these changes may portend a drastic decline in food production – with serious political implications for just about every nation on Earth. The drop in food output could begin quite soon, perhaps only 10 years from now. The regions destined to feel its impact are the great wheat-producing lands of Canada and the U.S.S.R. in the North, along with a number of marginally self-sufficient tropical areas – parts of India, Pakistan, Bangladesh, Indochina and Indonesia – where the growing season is dependent upon the rains brought by the monsoon.
The evidence in support of these predictions has now begun to accumulate so massively that meteorologists are hard-pressed to keep up with it. In England, farmers have seen their growing season decline by about two weeks since 1950, with a resultant overall loss in grain production estimated at up to 100,000 tons annually. During the same time, the average temperature around the equator has risen by a fraction of a degree – a fraction that in some areas can mean drought and desolation. Last April, in the most devastating outbreak of tornadoes ever recorded, 148 twisters killed more than 300 people and caused half a billion dollars’ worth of damage in 13 U.S. states.
To scientists, these seemingly disparate incidents represent the advance signs of fundamental changes in the world’s weather. The central fact is that after three quarters of a century of extraordinarily mild conditions, the earth’s climate seems to be cooling down. Meteorologists disagree about the cause and extent of the cooling trend, as well as over its specific impact on local weather conditions. But they are almost unanimous in the view that the trend will reduce agricultural productivity for the rest of the century. If the climatic change is as profound as some of the pessimists fear, the resulting famines could be catastrophic. “A major climatic change would force economic and social adjustments on a worldwide scale,” warns a recent report by the National Academy of Sciences, “because the global patterns of food production and population that have evolved are implicitly dependent on the climate of the present century.”
These people need a psychiatrist, not a carbon tax.
I had a real treat this evening riding my bike. A pasture with eight mares, four of which had just given birth. The other four looked like they were due any minute. I think the white foal might be an albino.
[youtube=http://www.youtube.com/watch?v=dR7W1BjP7zU]
The battery ran out of juice on my camera, but I will go back tomorrow. Maybe even get to film a delivery.

Palin is all-American and married to a native American. Unlike the occupant of the White House, she wants us to remember and respect the history of the US.
Palin said in a blog post on her website Tuesday that she is touring historical sites because “it’s so important for Americans to learn about our past so we can clearly see our way forward in challenging times.”
During the 2008 election campaign, Obama announced at least 10,000 times that America needs to change. His wife believes that America never did anything to be proud of prior to November, 2008. His pastor believes that America should be damned by God.