

http://lwf.ncdc.noaa.gov/img/climate/research/tornado/tornadotrend.jpg
The worst spring for tornadoes was right before Nixon resigned.
http://lwf.ncdc.noaa.gov/img/climate/research/tornado/tornadotrend.jpg
The worst spring for tornadoes was right before Nixon resigned.

The last 50 years have been relatively quiet for hurricane activity in the US. Prior to 1960, the US averaged 20 hurricane strikes per decade, or two per year. Since 1960, the US has averaged 14 hurricane strikes per decade, or 1.4 per year. i.e prior to 1960, the US received nearly 50% more hurricanes per year than during the last 50 years.
It has been 931 days since any hurricane hit the US. The last time the US went this long without a hurricane strike was just prior to the Civil War.

http://www.infoplease.com/ipa/A0001416.html
Half of the US states set their record high temperature during the 1930s.

No state has broken their record high temperature during the current millennium.
Two days ago I pointed out that NRDC’s claim of warming winters in Yellowstone disagreed with measured NCDC Wyoming temperatures.
https://realclimatescience.com/2011/03/31/nrdc-smarter-than-the-average-bear/
Looking closer at their claim, USHCN RAW mean temperatures at Yellowstone show a downwards trend of more than 1F per century. 1934 was by far the warmest year, followed by 1940.

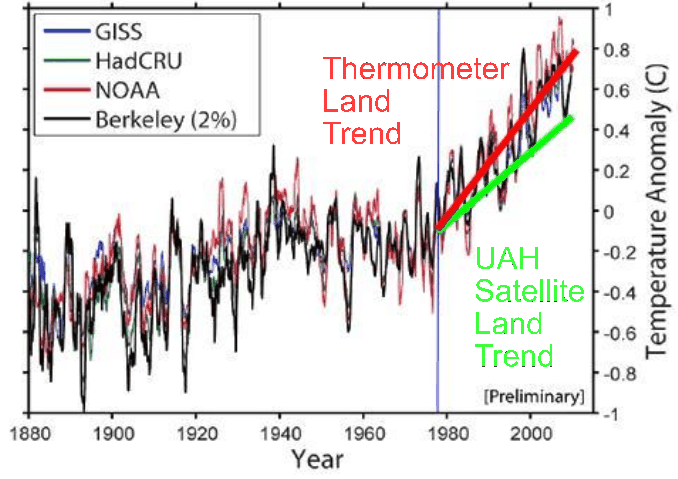
Yesterday I pointed out that Muller’s graph did not match HadCRUT global temperatures. This was due to the fact that Muller was using only land based thermometer readings and did not include ocean temperatures – which comprise 70% of the Earth’s surface – have risen more slowly.
So let’s assume that Muller has proven that land temperatures are consistent between HadCRU, GISS and Berkeley. They all show a rise of about 0.3C per decade since the start of the satellite record in 1978. Satellite data from UAH shows a much smaller rise over land of 0.18C per decade during that same time period.
Satellite data is measured at 14,000 feet, and would exaggerate the warming if it was due to “global warming.” However, we see the exact opposite. The only plausible explanation is that the surface record is biased by UHI effects, because thermometers are located where humans live, build roads, remove snow, heat their homes, build buildings, etc.
I have a thermometer on my bicycle, and frequently see a 2-5C temperature difference between a large road and an open-space bicycle trail two blocks away. I have also seen a 5-10C difference between Tempe, Az. and the open desert 20 miles to the south.
I’m sending this to Dr. Muller for comment.
McKibben blames earthquakes on CO2, and says that sea level has been stable for 10,000 years.


Sea level has risen 50 metres in the last 10,000 years. McKibben has absolutely no clue what he is talking about.

http://www.globalwarmingart.com/wiki/File:Post-Glacial_Sea_Level_png


