Disrupting the Borg is expensive and time consuming!
Google Search
-
Recent Posts
- El Nino To The Rescue
- Bullseye!
- It’s Getting Closer
- Greenland Meltdown Scam
- Greenland Ice Update
- Wyoming Gold
- Three Years Since The Apocalypse
- Arctic Report card Summer 2026
- Elon Pushing Pushing Geoengineering
- Earth, Wind And Fire
- On The Road Again
- Vandalism At The Reflecting Pool
- Fifty Years Ago Today
- Truth Or Consequences
- US Climate Trend Maps
- Declining Spring Snow Cover In Northern New Mexico
- You Can’t Fool Mother Nature
- Cattle And The Climate
- One Atomic Bomb Per Hour
- New Video : Analyzing Oil And Gas
- Is Antarctica Melting?
- High Speed Analysis And Visualization
- El Nino To The Rescue?
- Fake News Update
- Growth Of Antarctic Sea Ice
Recent Comments
- conrad ziefle on El Nino To The Rescue
- Francis Barnett on El Nino To The Rescue
- Gordon Vigurs on El Nino To The Rescue
- conrad ziefle on Cattle And The Climate
- Peter Carroll on El Nino To The Rescue
- Stuart Hamish on Three Years Since The Apocalypse
- Stuart Hamish on Cattle And The Climate
- Bob G on Bullseye!
Blue State vs. Red State
Posted in Uncategorized
6 Comments
Ghana Always Humiliates The US – Will England Fare Better?
England chokes in the 90th minute.
Posted in Uncategorized
3 Comments
HadCRUT Warming Things Up
HadCRUT February data is out. Not only did February warm up, but January also warmed up retroactively.
Last month the January anomaly was .204, and this month the January anomaly is .216. February is listed as .277.
So far this month, Phil has warmed up 2011 by 0.073 degrees – while UAH shows a slight cooling.
Posted in Uncategorized
7 Comments
Hansen vs. Romm
Romm says CO2 is increasing “super-exponentially“, while Hansen shows greenhouse gases tailing off.
Hansen :
Posted in Uncategorized
9 Comments
Hansen : It Is Your Eyes That Are Lying, Not Me
Hansen says that he was right, your eyes are lying, and the world really is heating out of control. For some reason though, he forgot to include the actual temperature graph.
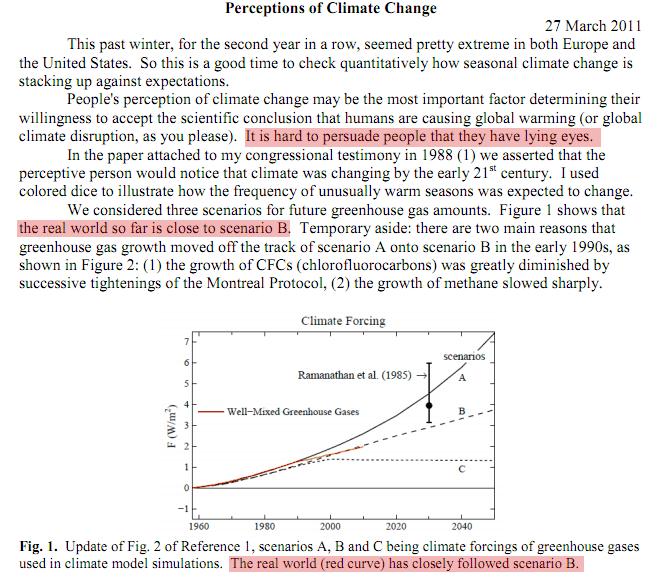
http://www.columbia.edu/~jeh1/mailings/2011/20110327_Perceptions.pdf
Hansen’s graph above shows what he claims has happened with emissions – a straight line. But the Mauna Loa CO2 graph below shows that CO2 has actually increased exponentially since 1960.
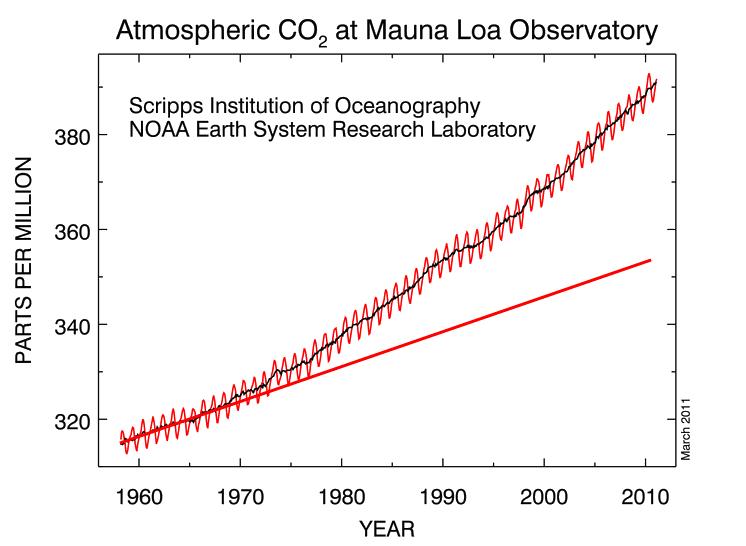
The graph below shows the Mauna Loa data plotted in green on top of Hansen’s graph – exactly following scenario A.
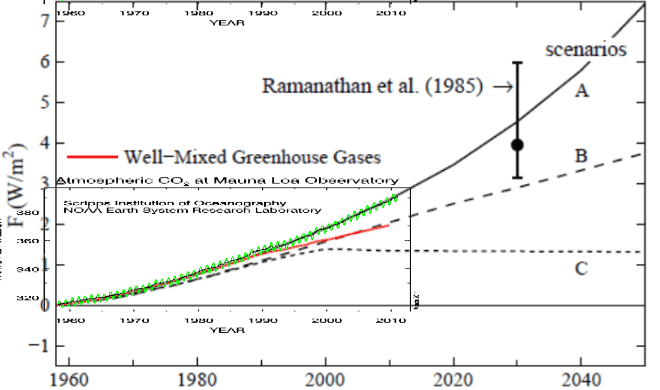
Now lets look at what has actually happened with temperatures since 1960.
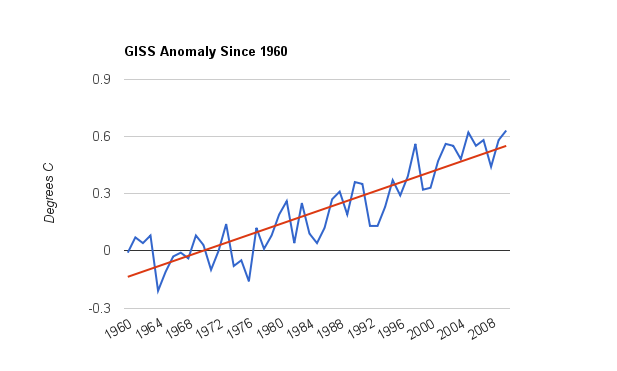
The graph below shows Hansen’s 1988 temperature projections vs. the GISS trend since 1960. Well below scenario B and even below scenario C.
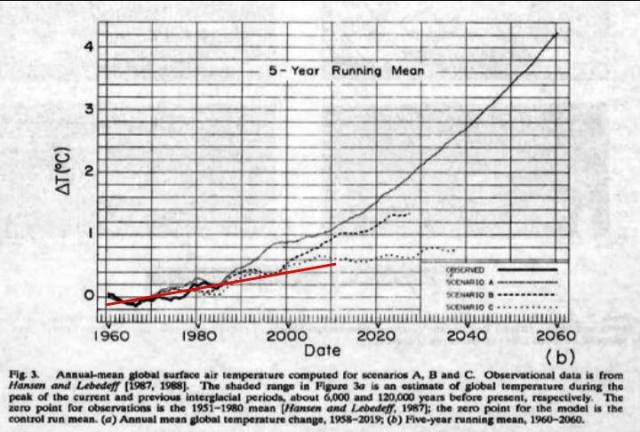
Conclusion : Hansen is wrong about both greenhouse gas growth and temperature change – even using his own bloated temperature numbers. Climate sensitivity is much lower than he projected. It is time for him to come clean about this.
h/t to Marc Morano and Tom Nelson

Posted in Uncategorized
32 Comments
Why The US Is Doomed To Continue Falling Behind Countries With A Legitimate School System
[youtube=http://www.youtube.com/watch?v=5gNYlq4pyQI]
Posted in Uncategorized
3 Comments