
Biden energy policies are crushing wind, solar and fossil fuels.
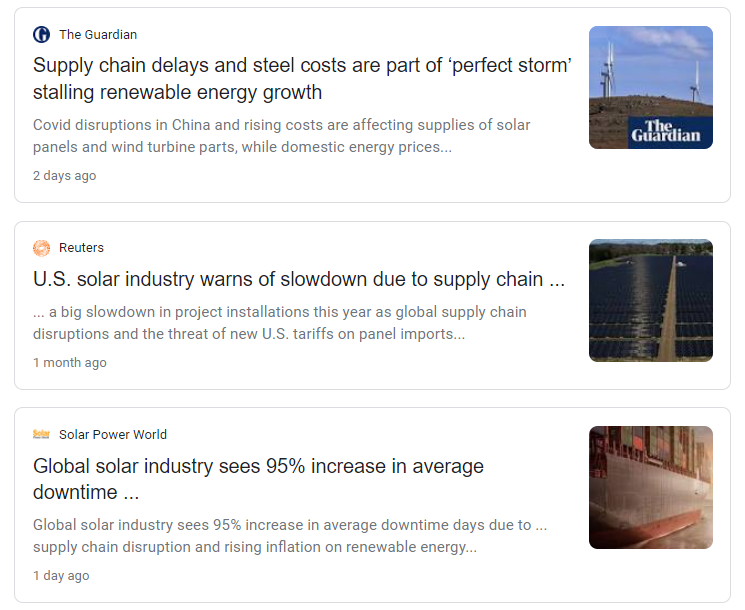
Biden energy policies are crushing wind, solar and fossil fuels.
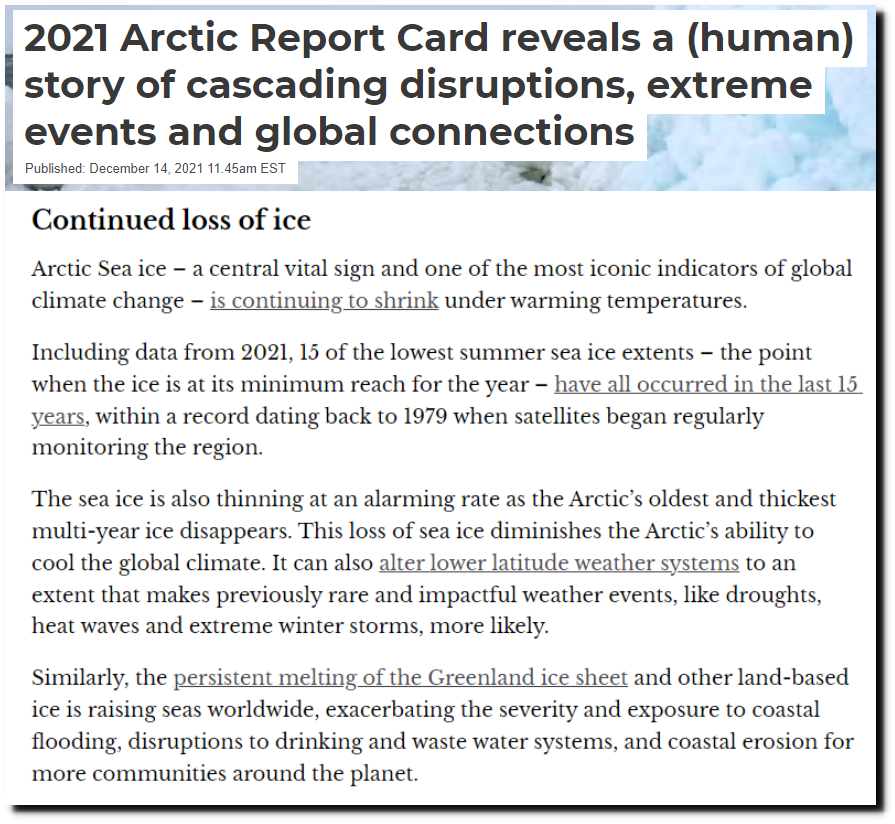
NOAA claims that sea ice is disappearing, the Greenland ice sheet is melting and this is causing sea level rise and extreme weather.
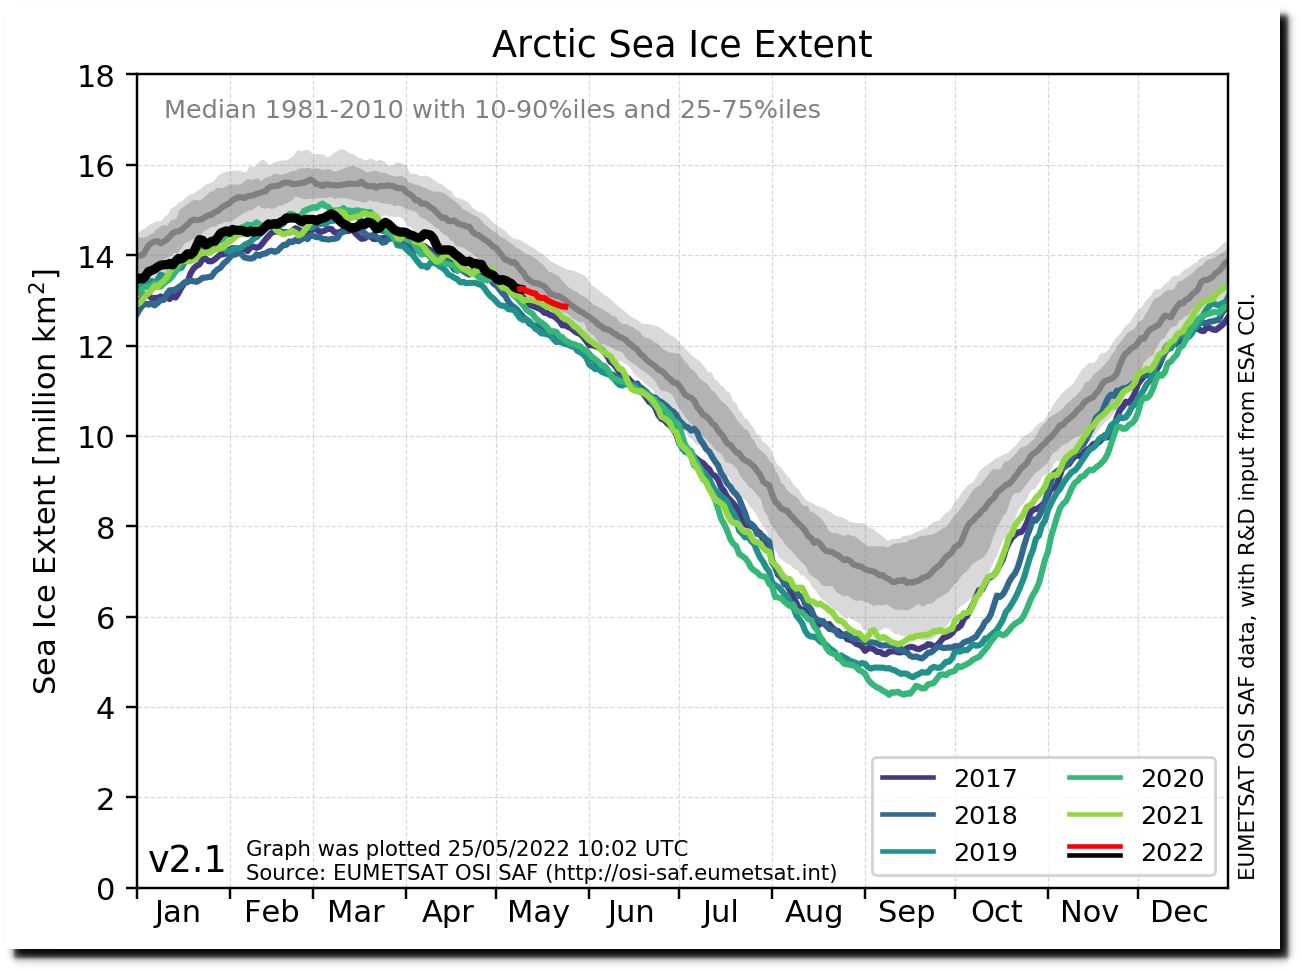
Arctic sea ice extent is right at the 1981-2010 median.
Ocean and Ice Services | Danmarks Meteorologiske Institut
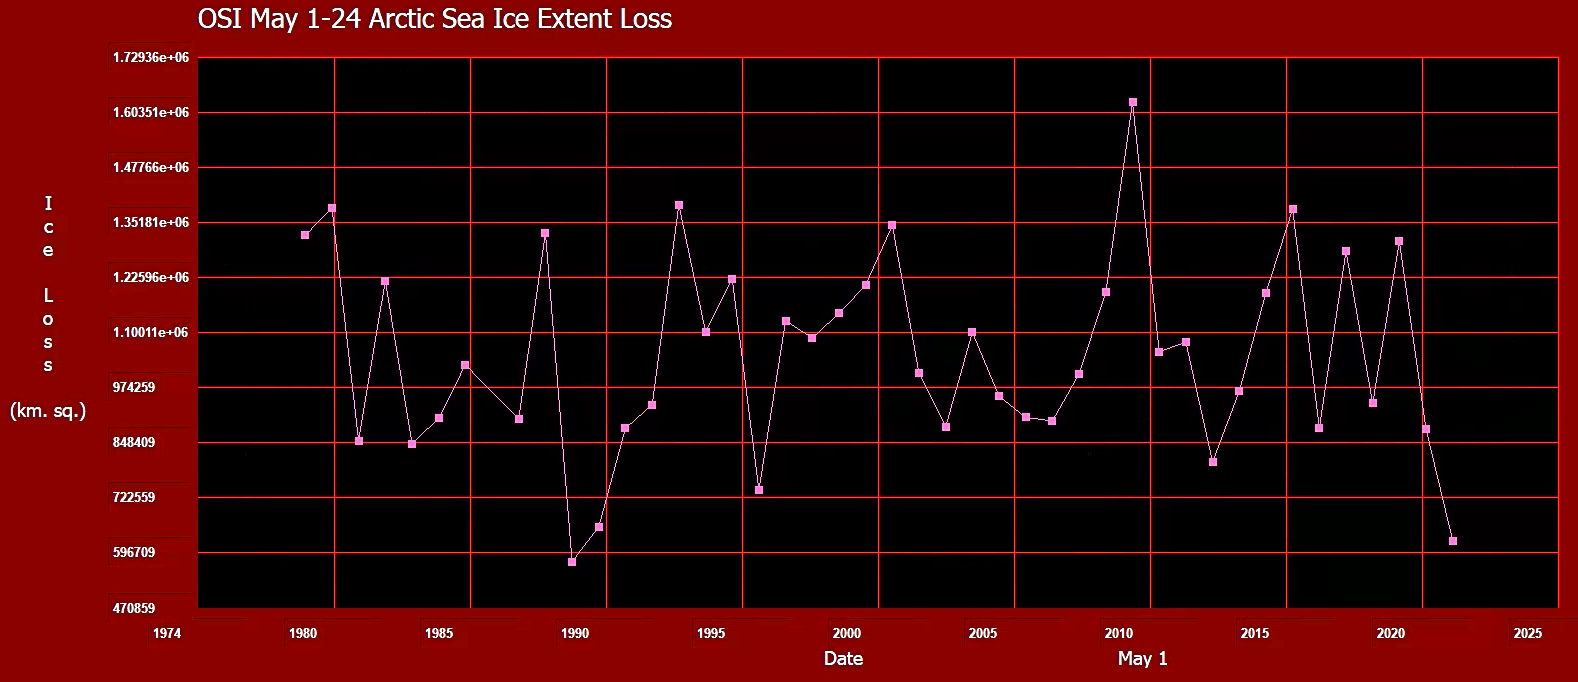
Melt during May has been second slowest on record.
ftp://osisaf.met.no/prod_test/ice/index/v2p1/nh/osisaf_nh_sie_daily.txt
Extent is higher now than 1995.
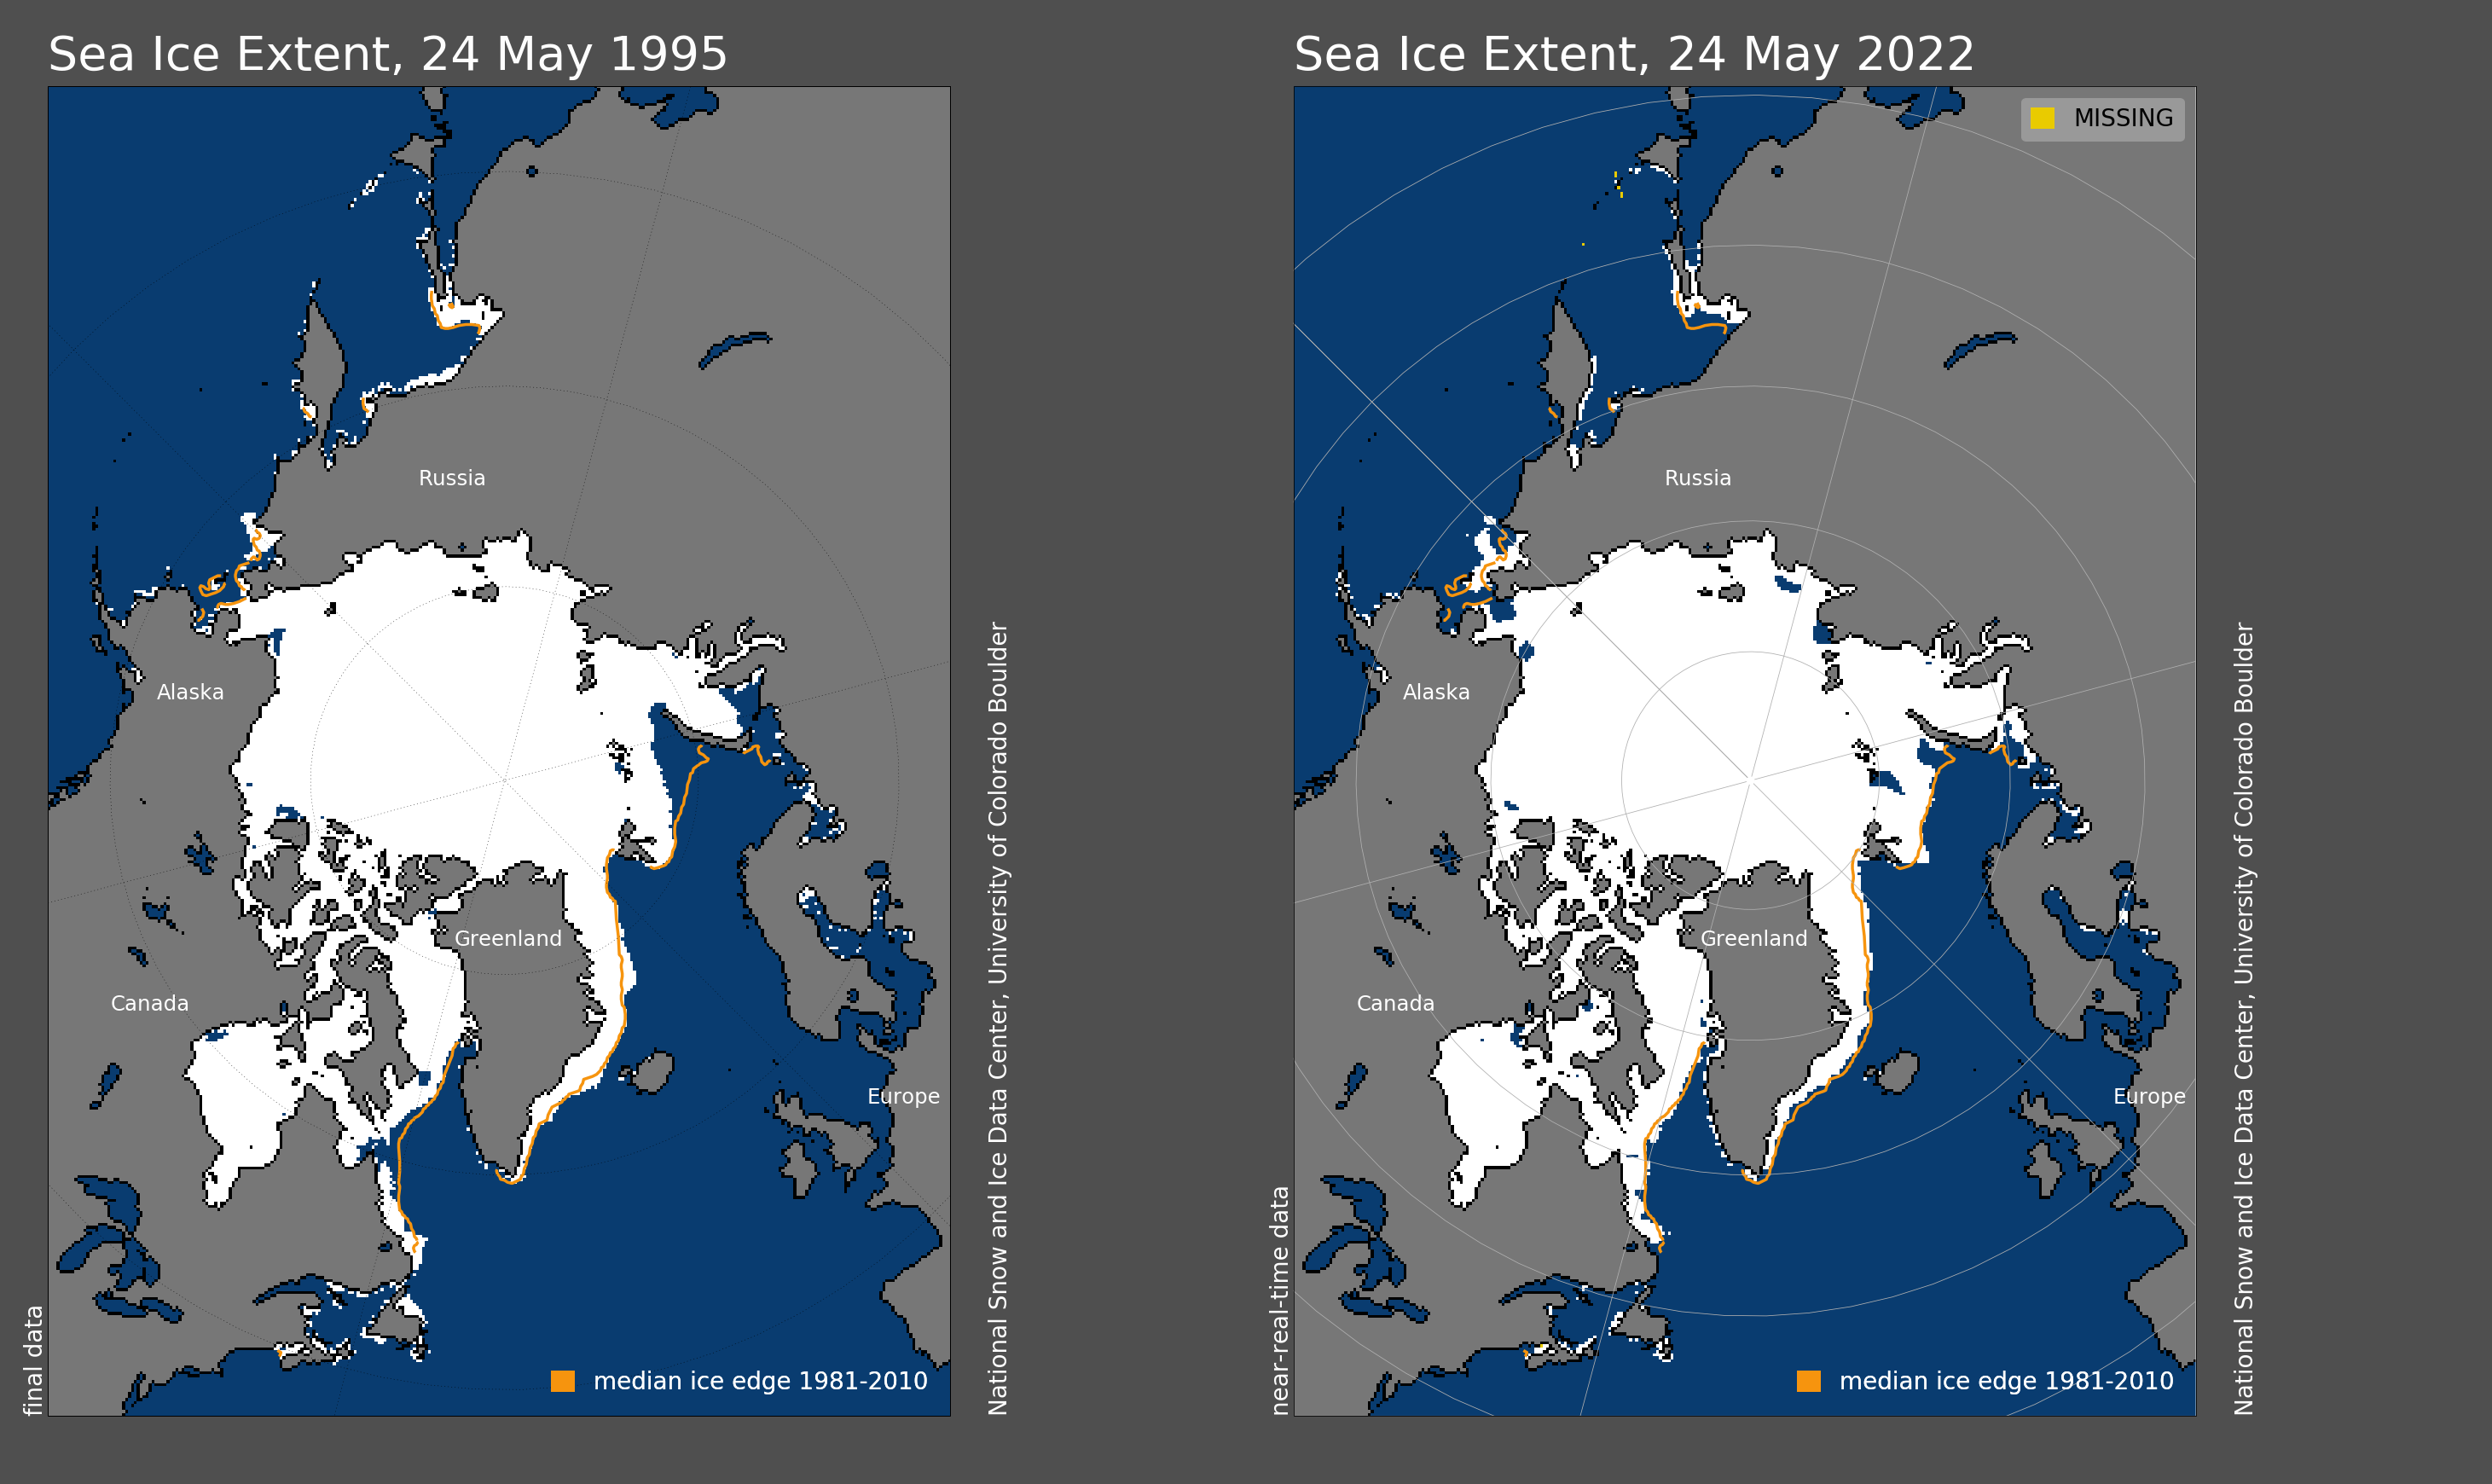
There has been no trend in Arctic sea ice extent over the past 15 years, since Nobel Laureate Al Gore predicted an ice free Arctic by 2014.

ftp://osisaf.met.no/prod_test/ice/index/v2p1/nh/osisaf_nh_sie_daily.txt
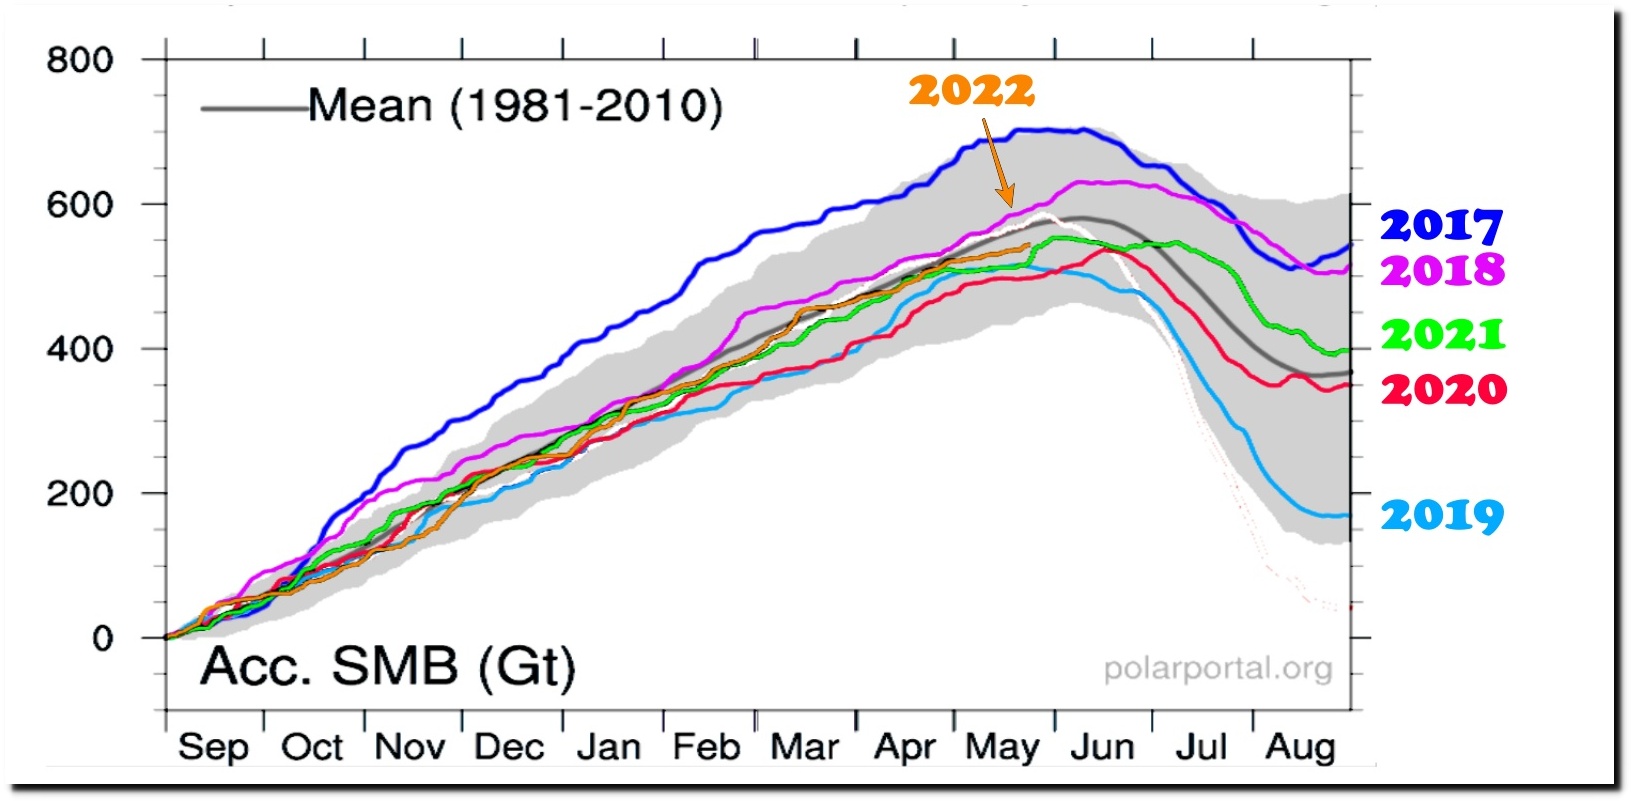
The surface mass balance of Greenland has been above average over the past six years.
Surface Conditions: Polar Portal
After 170 years of retreat, Greenland’s largest glacier is expanding.

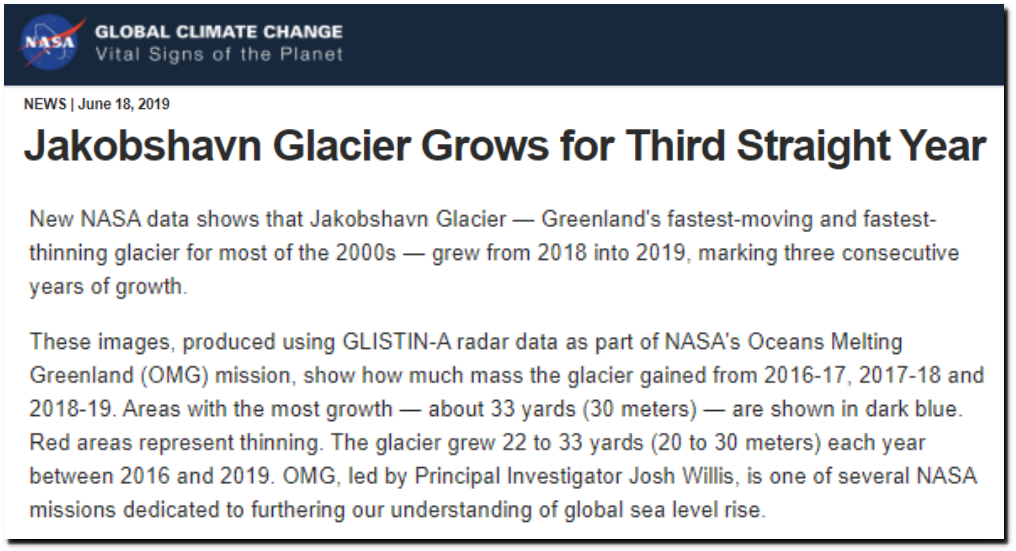
Jakobshavn Glacier Grows for Third Straight Year – Climate Change: Vital Signs of the Planet
Post-Glacial_Sea_Level.png (1813×1088)
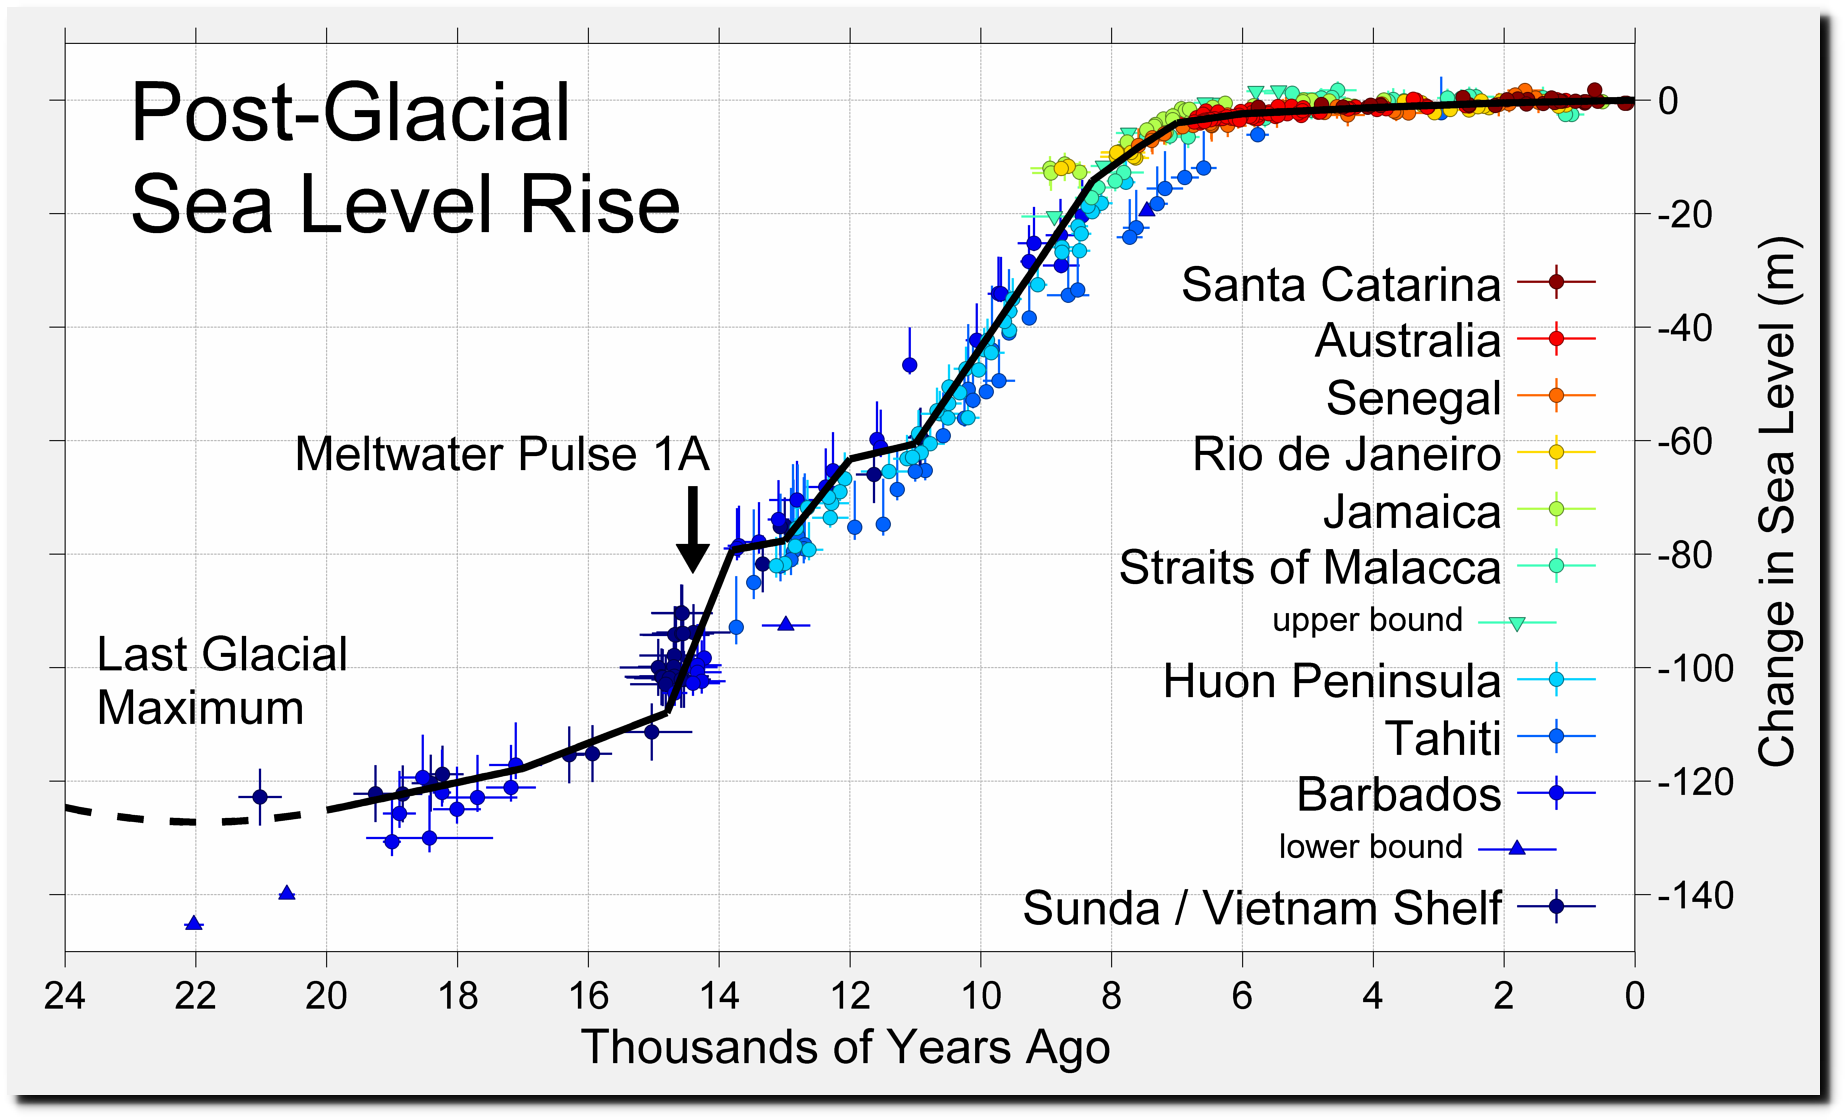
NASA claims that sea level is rising at “unprecedented rates” of 3.5 mm/year.
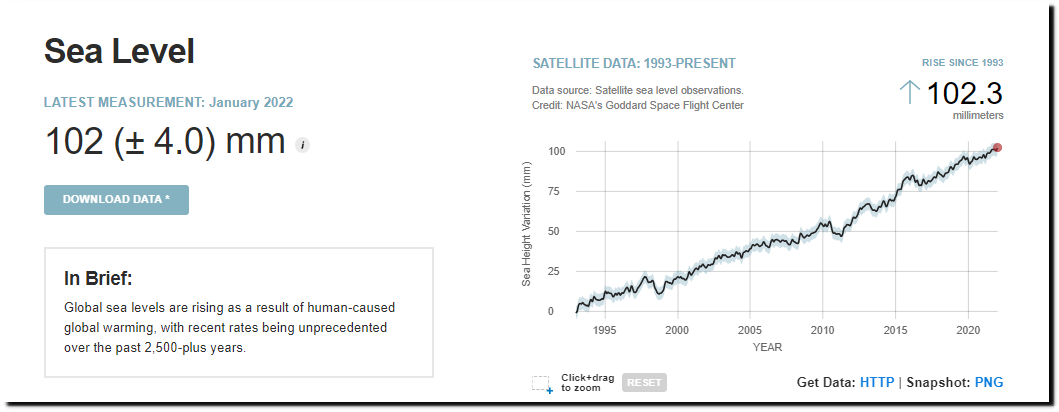
Sea Level | Vital Signs – Climate Change: Vital Signs of the Planet
They have inflated that number since eight years ago when they said 3.17 mm/year.

Climate Change: Vital Signs of the Planet: Sea Level
The NASA number is about double what NOAA has measured using tide gauges.
” the absolute global sea level rise is believed to be 1.7-1.8 millimeters/year”
Sea Level Trends – NOAA Tides & Currents
NOAA shows that 89% of global tide gauges are below NASA’s claimed average.
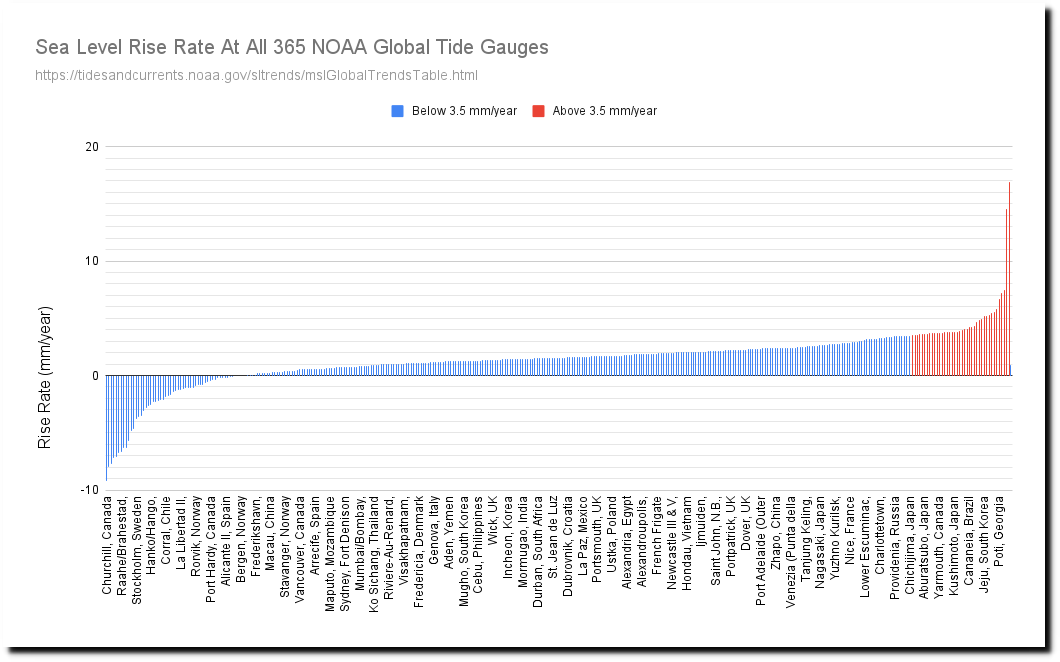
Sea Level Trends – NOAA Tides & Currents
Sea level rise rates have not changed over the past century and are lower than all of NOAA’s scenarios.


Sea Level Trends – NOAA Tides & Currents
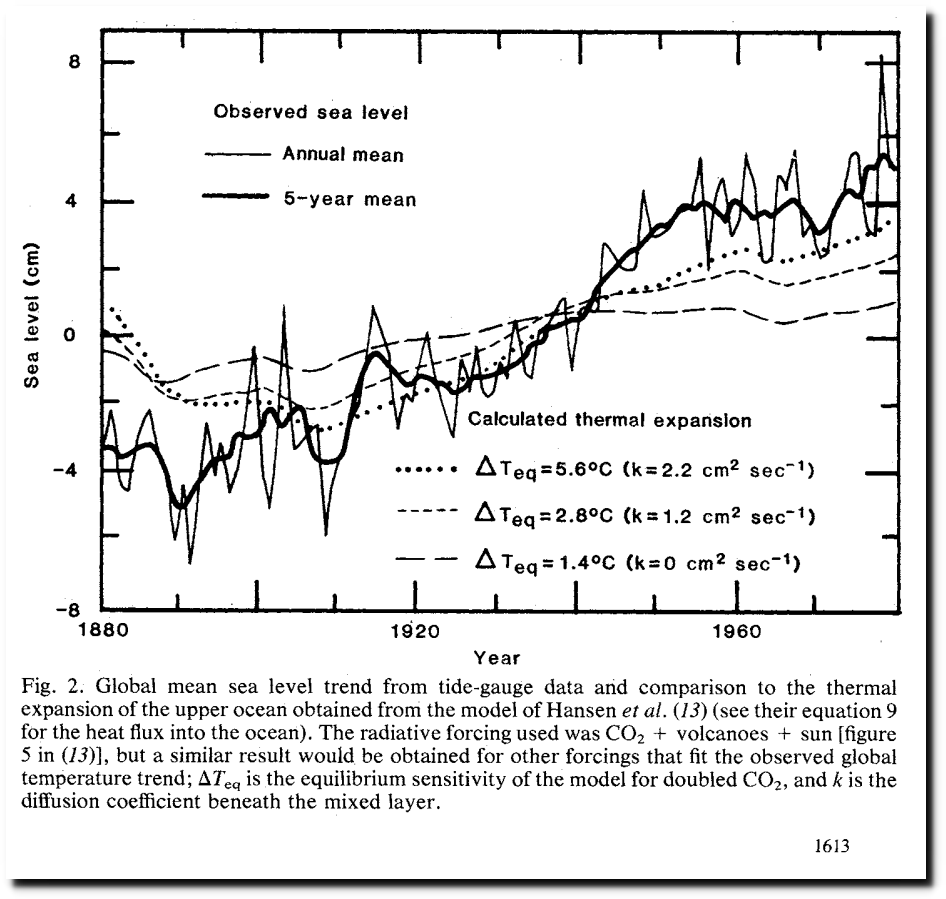
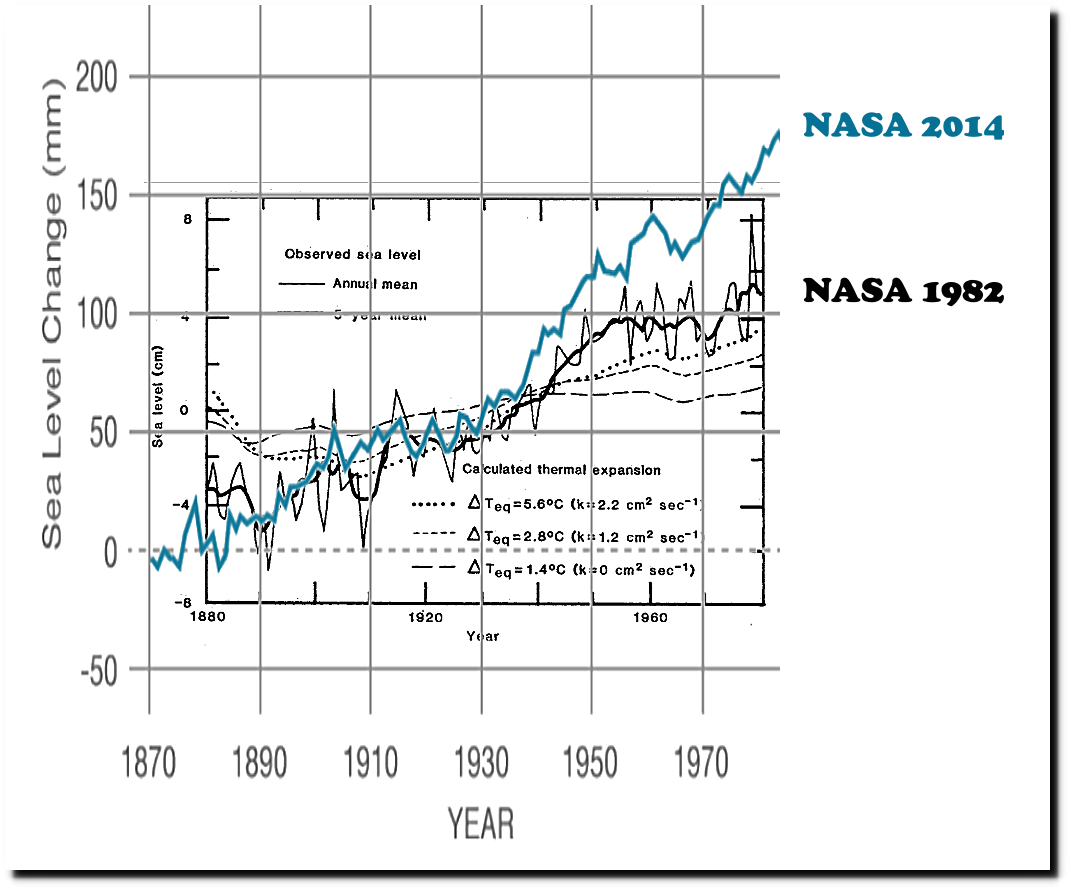
NASA has massively altered their sea level data over the past forty years.
High tide sea level at La Jolla, California has not changed perceptibly over the past 150 years.
As is always the case with government agencies and the press, their climate claims have no basis in history, facts or science.
“the leading theory was sexual transmission among gay and bisexual men”

Monkeypox likely spread by sex at two raves in Europe, expert says
On May 25, 1896 tornadoes and floods killed around 100 people in Michigan, Iowa and Illinois.
“May 25, 1896
This week of almost continuous strong and violent tornado activity (perhaps the most violent single week of tornado activity in US history) continued with a 1 AM, F4 tornado in Ogle County, Illinois. A mother and three children died as a home was leveled south of Egan. A half hour later, three more died and six were injured in a home south of Davis Junction, Illinois. The late afternoon devastated parts of central and eastern Michigan. At 6 PM, in Tuscola County, Michigan, a home in which a funeral was taking place was destroyed. The thirty people in attendance ran safely to a ditch before the home was “lifted and dashed to the ground.” A man in a nearby home was killed by debris as he watched the events from his window. Two hours later, two people were killed as thirty homes were destroyed at Mount Clemons, Michigan. At 9 PM, the third F5 tornado of the year began leveling homes near Ortonville, Oakwood, and Thomas, Michigan. Nine people died in a single home at Ortonville. On the ground for thirty miles, the funnel killed at least forty-seven people.”

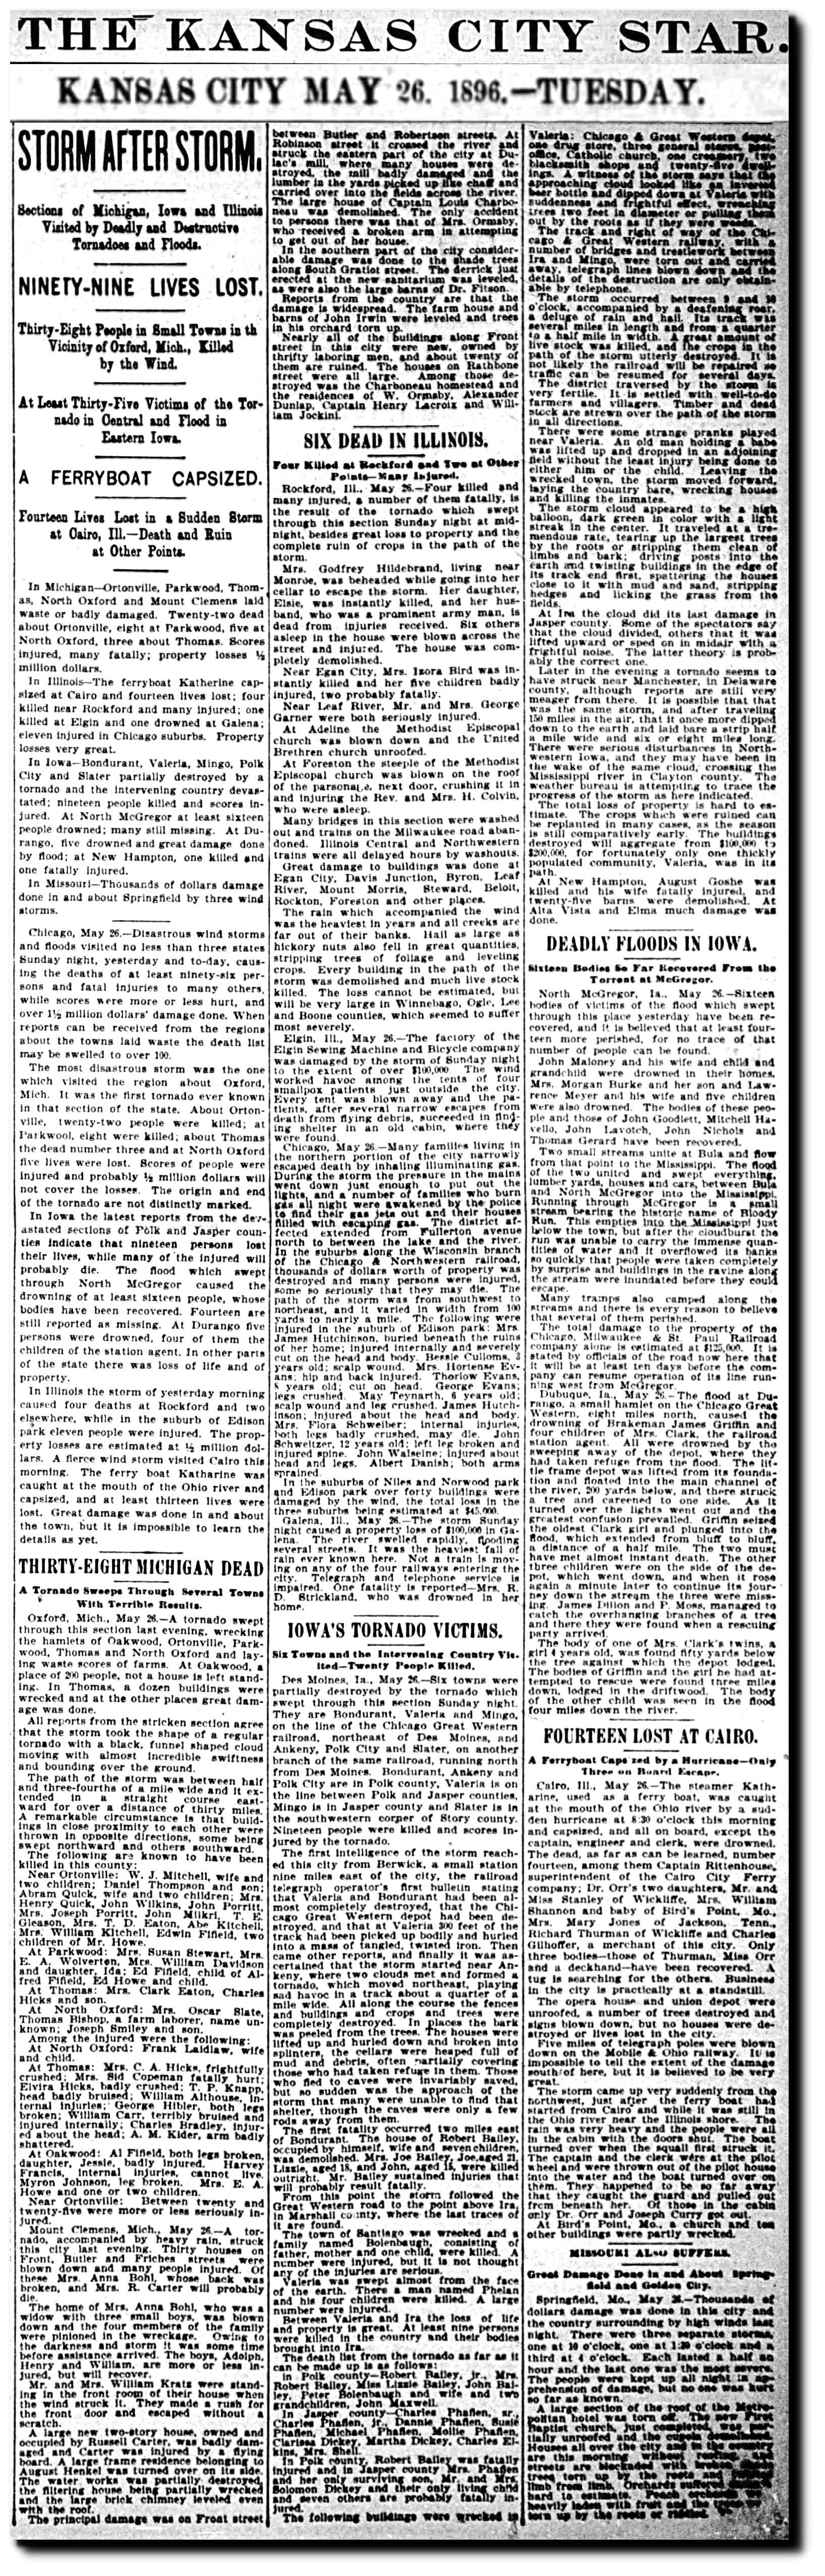
26 May 1896, 1 – The Kansas City Star at Newspapers.com
“May 25, 1896 – Forty-seven were killed and at least 100 injured in a massive tornado that leveled many homes near Ortonville, Oakwood and Thomas. Parts of the homes were found 12 miles away. Nine people were killed in one Ortonville home. The towns of Oakwood and Thomas were never rebuilt.”
History of tornadoes in Oakland County, Michigan – The Oakland Press
“Late during the evening hours of May 25, an F5 tornado touched down in Eastern Michigan and moved northeast for about 30 miles (48 km).[6] The tornado affected portions of Oakland, Lapeer and Livingston Counties northwest of Detroit. Towns affected included Thomas, Ortonville, Oakwood, and Whigville just after 9:00 pm. Homes were leveled or swept away, and fatalities occurred along the path. Entire farms were leveled, and debris from homes was found up to 12 miles (19 km) away. Trees were completely debarked along the path as well, with even small twigs stripped bare in some cases. Homes were swept away in Thomas, including one that was obliterated with the debris scattered up to 10 miles away. A piano from that residence was found 200 yards away from the foundation, with one end “pounded full of grass”. Weather Bureau inspectors reported that grass in the center-most part of the circulation was “pounded down into the earth, as if it had been washed into the earth by a heavy flow of water.”[15] At least 100 people were injured.[6] With 47 deaths, this is the second-deadliest tornado ever in Michigan trailing only the Flint Tornado of 1953 which killed 116 in Genesee County just outside Flint. Twenty-two people were killed in Ortonville, ten in Oakwood, three in Thomas, four north of Oxford and three in Whigville with others in rural areas. Nine of the fatalities were in a single home in Ortonville.[16][17] Other killer tornadoes on that day touched down in Ogle County, Illinois (two different tornadoes) and Macomb & Tuscola Counties in Michigan. Several homes and farms in the Mount Clemens area were wiped out and others were moved from their foundations. The recently completed Colonial Hotel was leveled. Thirty homes were leveled in total, and two people were killed.”
A tornado outbreak on May 24, 1896 killed dozens of people in Iowa, Illinois and Kansas.
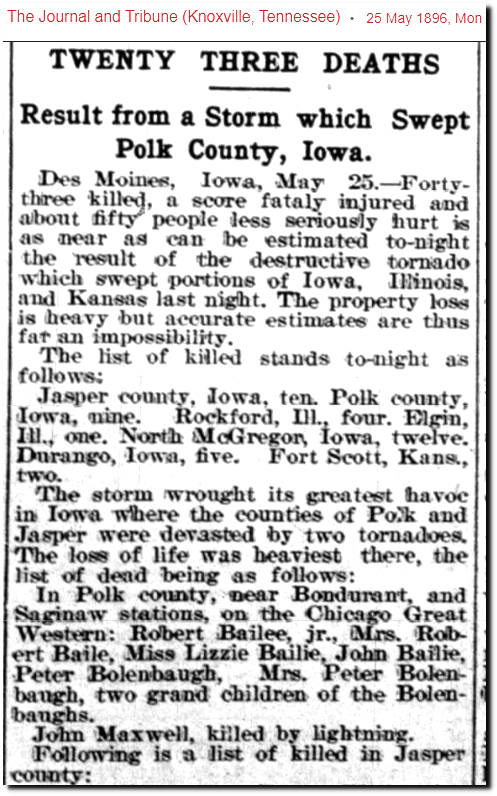
25 May 1896, 1 – The Journal and Tribune at Newspapers.com
“May 25, 1896
This week of almost continuous strong and violent tornado activity (perhaps the most violent single week of tornado activity in US history) continued with a 1 AM, F4 tornado in Ogle County, Illinois. A mother and three children died as a home was leveled south of Egan. A half hour later, three more died and six were injured in a home south of Davis Junction, Illinois. The late afternoon devastated parts of central and eastern Michigan. At 6 PM, in Tuscola County, Michigan, a home in which a funeral was taking place was destroyed. The thirty people in attendance ran safely to a ditch before the home was “lifted and dashed to the ground.” A man in a nearby home was killed by debris as he watched the events from his window. Two hours later, two people were killed as thirty homes were destroyed at Mount Clemons, Michigan. At 9 PM, the third F5 tornado of the year began leveling homes near Ortonville, Oakwood, and Thomas, Michigan. Nine people died in a single home at Ortonville. On the ground for thirty miles, the funnel killed at least forty-seven people.”
Policy is based around ideas and goals which are completely out of the realm of rational thought.
“The U.K. will cease all coal-fired electricity generation in October 2024, bringing forward the end date for the fuel by a year, in a bid to boost the country’s climate credentials ahead of an all-important climate summit in November.”
June 30, 2021
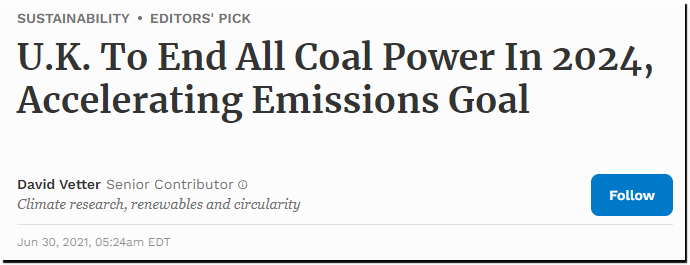
U.K. To End All Coal Power In 2024, Accelerating Emissions Goal
“Energy prices have spiked to a record high in Britain after calm weather shut down the country’s wind turbines amid a global shortage of natural gas.”
September 6, 2021
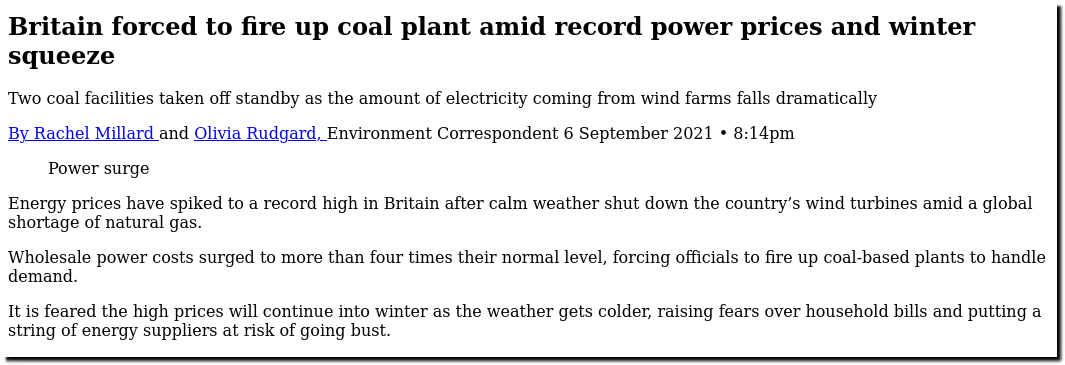
Britain forced to fire up coal plant amid record power prices and winter squeeze
“The government is considering delaying the closure of some of the UK’s last remaining coal-fired power stations due to the impact of the energy crisis and the war in Ukraine.”
March 14, 2022
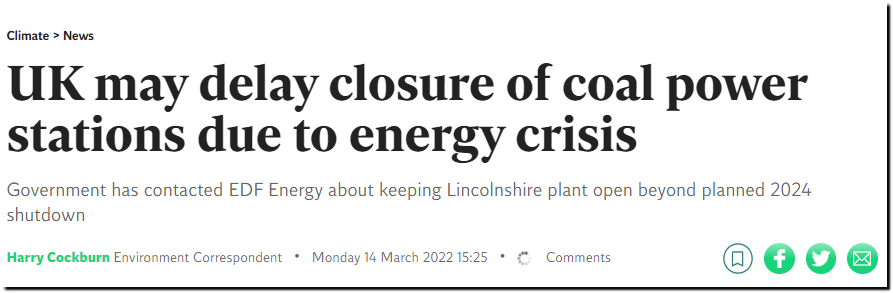
UK government ‘could keep coal power stations running longer’ | The Independent
NOAA says the climate was very different the last time CO2 levels were this high, and this proves we need more windmills.
“The atmospheric burden of CO2 is now comparable to where it was during the Pliocene Climatic Optimum, between 4.1 and 4.5 million years ago, when CO2 was close to, or above 400 ppm. During that time, sea level was about 78 feet higher than today, the average temperature was 7 degrees Fahrenheit higher than in pre-industrial times, and studies indicate large forests occupied areas of the Arctic that are now tundra.”
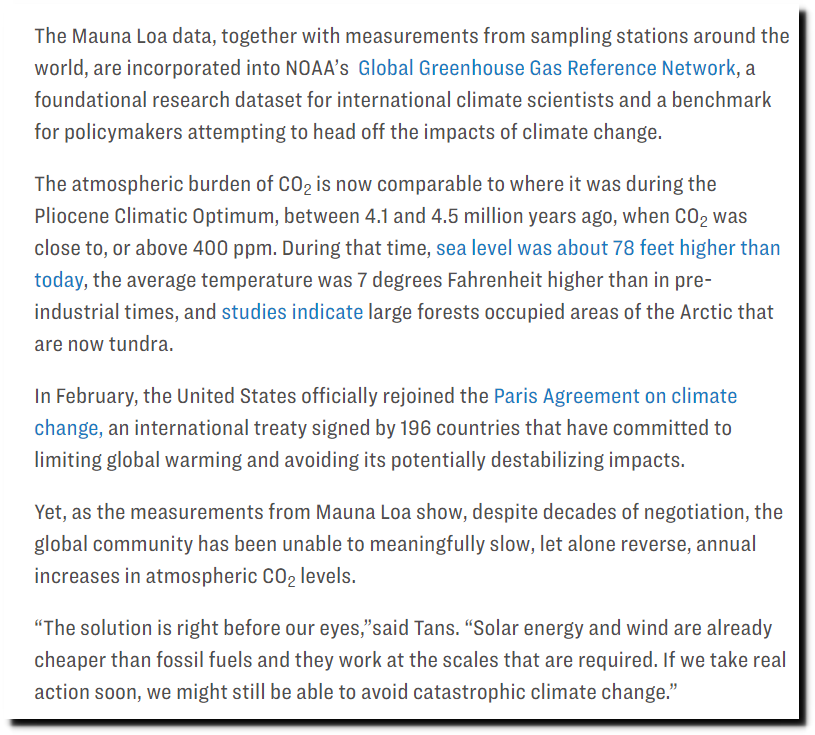
Carbon dioxide peaks near 420 parts per million at Mauna Loa observatory – Welcome to NOAA Research
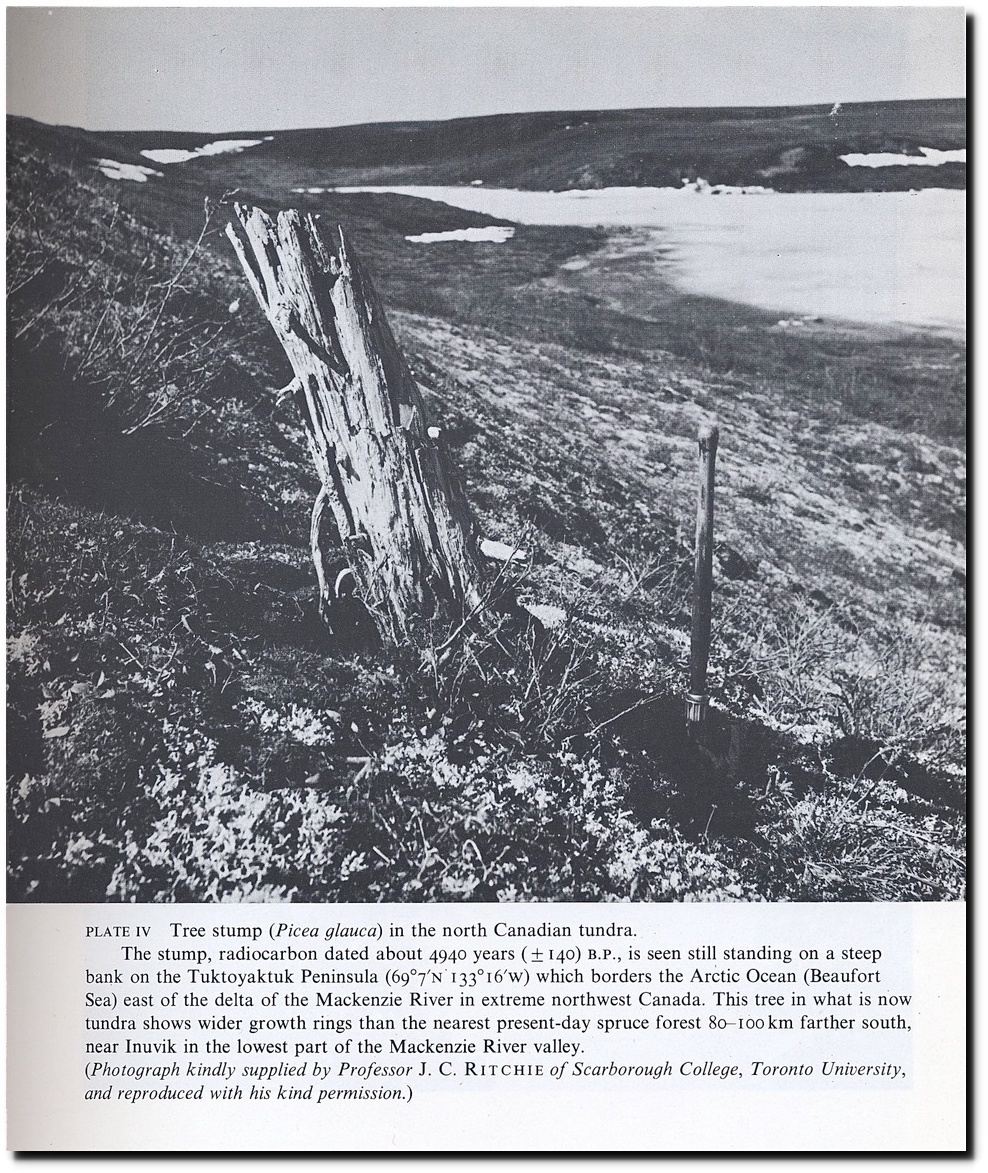
The Arctic was also much warmer 6,000 years ago when CO2 levels were low. The evidence shows CO2 does not control the climate, but NOAA concludes the exact opposite.
Less Ice In Arctic Ocean 6000-7000 Years Ago — ScienceDaily
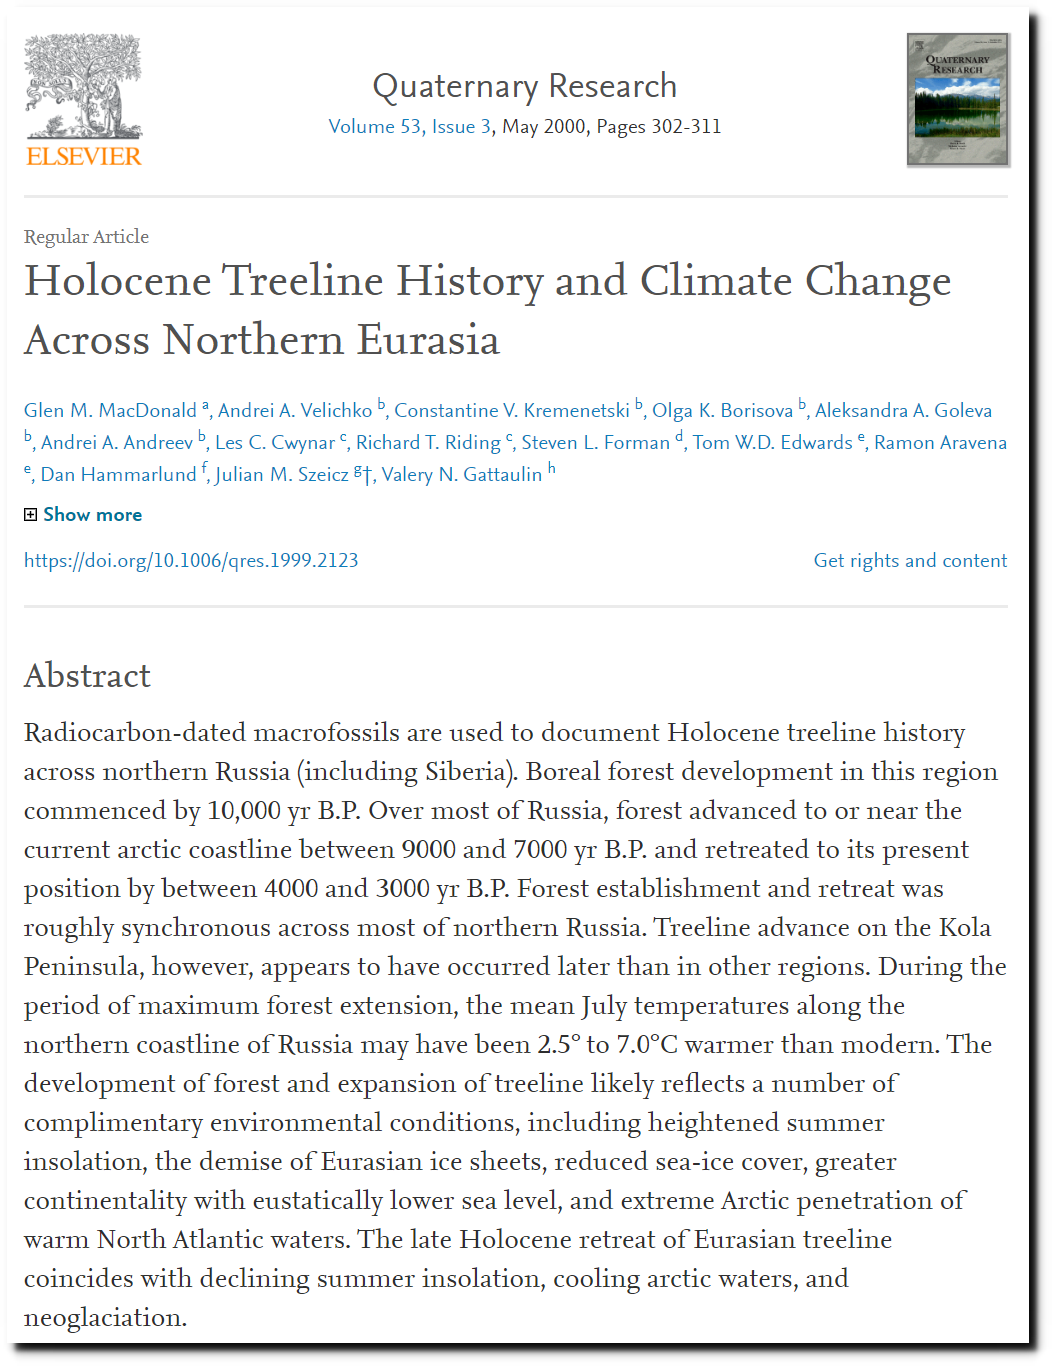
Holocene Treeline History and Climate Change Across Northern Eurasia – ScienceDirect
Globalist billionaires at the World Economic Forum say they are rescuing poor people from future climate change by implementing policies which make it impossible for poor people to afford to live now.
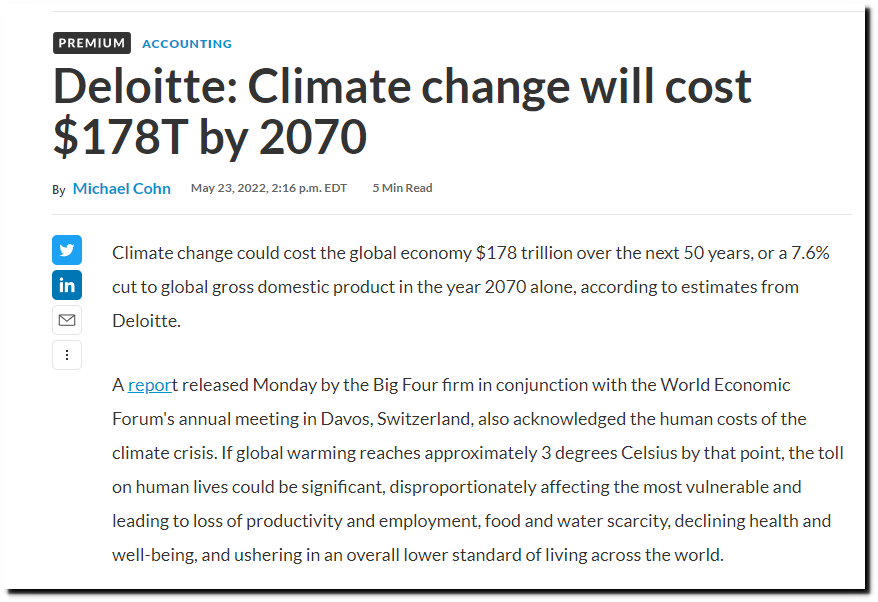
Deloitte projects climate change will cost $178T by 2070 | Accounting Today

Western governments are making disastrously poor energy decisions based on terrible science and a failure to listen to anyone who knows what they are talking about.
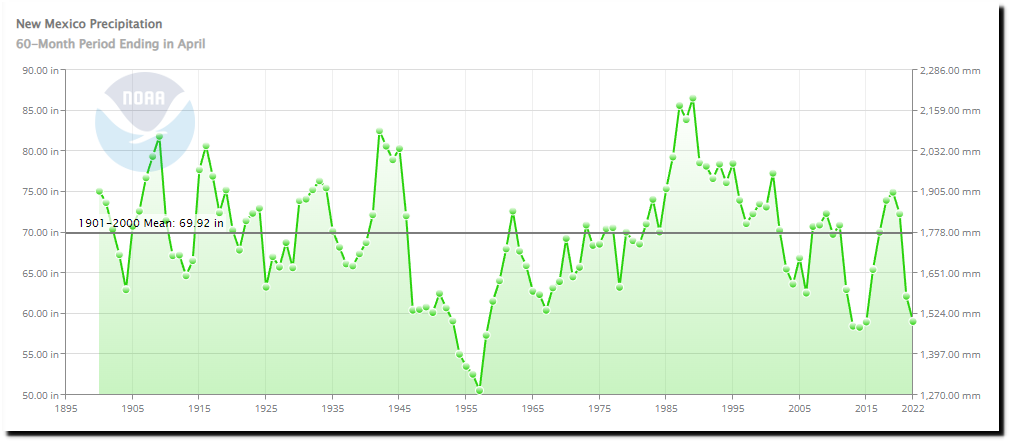
Scientists reported the drought in the west is the worst in 1,200 years.
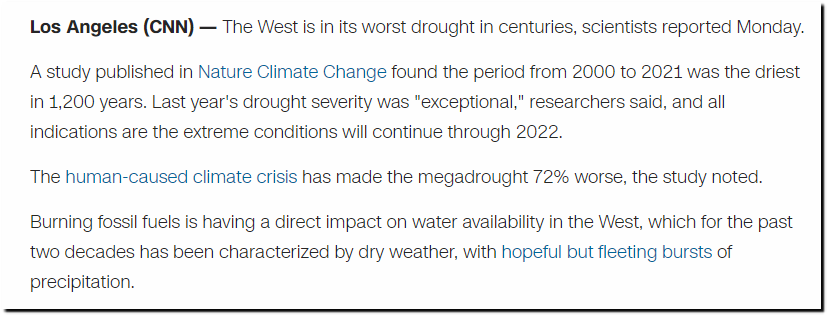
West’s megadrought is worst in 1,200 years, study finds – CNN
Apparently those “scientists” didn’t do any actual research.
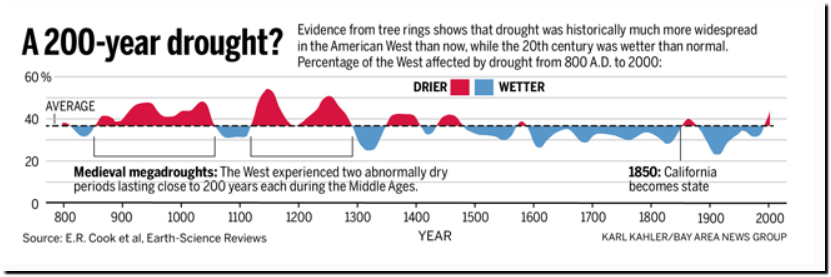
Graphic: California’s droughts in the past 1,200 years – The Mercury News
” at least one other study, published in 1922, discusses a drought in California that lasted more than a century”
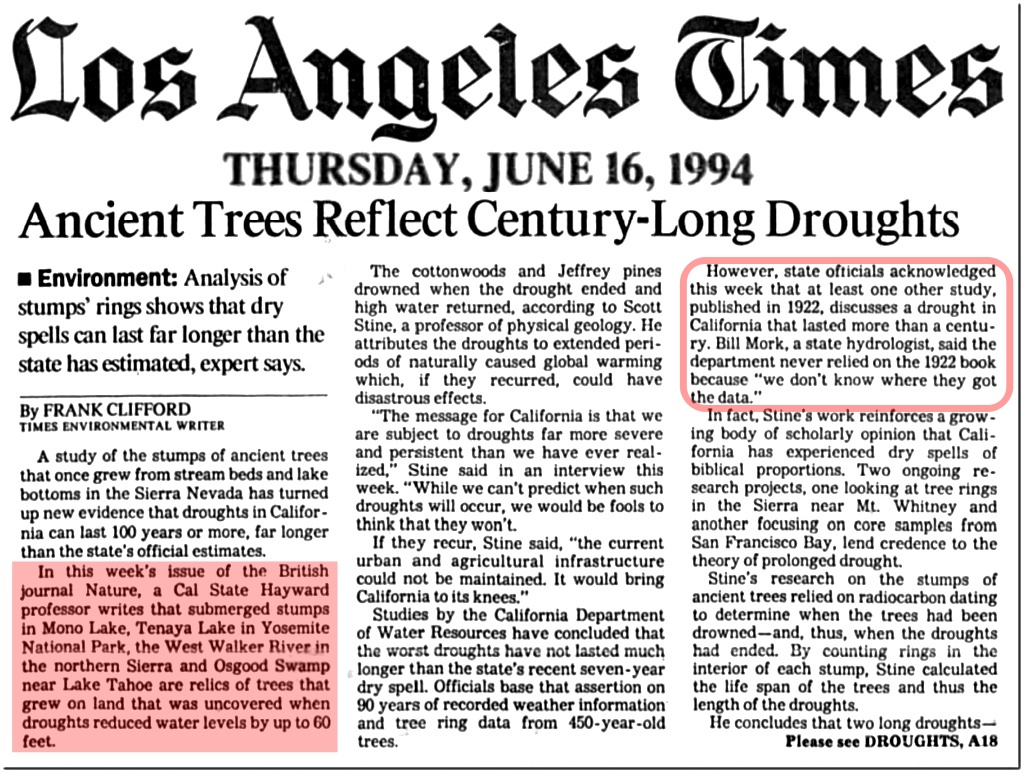
16 Jun 1994, Page 259 – The Los Angeles Times at Newspapers.com
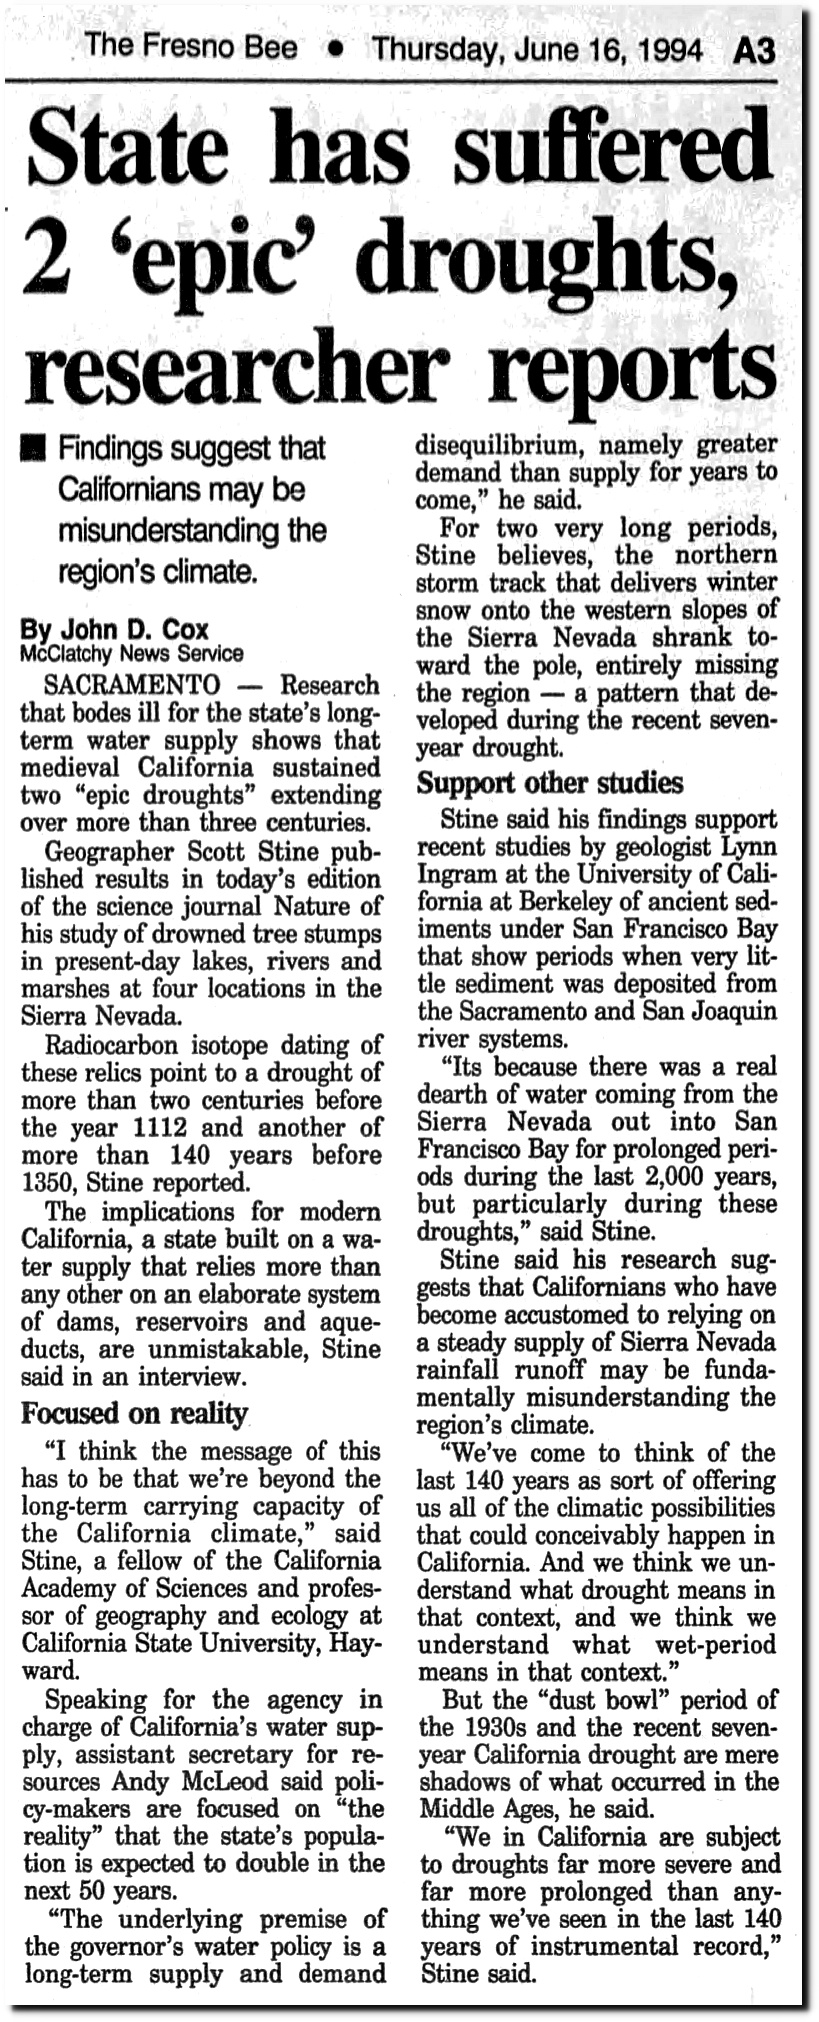 16 Jun 1994, 3 – The Fresno Bee at Newspapers.com
Thirty years ago, the New York Times knew that the 20th century was unusually wet in California, and that the Medieval Warm Period was global.
“Lisa J. Graumlich, who examines the ring patterns of foxtail pine trees and western junipers in the Sierra Nevada, has compiled a detailed record of the year-to-year variation in temperature and precipitation over the last thousand years.
She has seen in the North American trees the feathery but unmistakable signatures of the Medieval Warm Period, a era from 1100 to 1375 A.D. when, according to European writers of the time and other sources, the climate was so balmy that wine grapes flourished in Britain and the Vikings farmed the now-frozen expanse of Greenland; and the Little Ice Age, a stretch of abnormally frigid weather lasting roughly from 1450 to 1850. A Crucial Question
“We can now see that these were global climate phenomena, not regional temperature variations,” she said. “The question is, how did we get those warmer temperatures during pre-industrial times, and what can we learn from those conditions about what is going on today?”

Western landscapes in presettlement era were very smoky places.
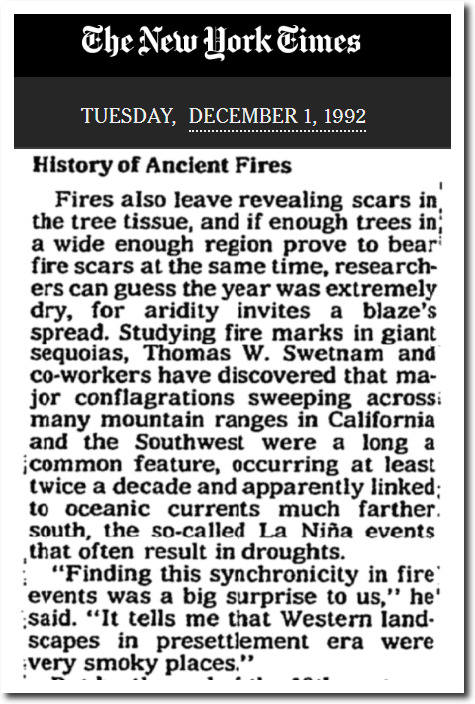
Warming? Tree Rings Say Not Yet – The New York Times
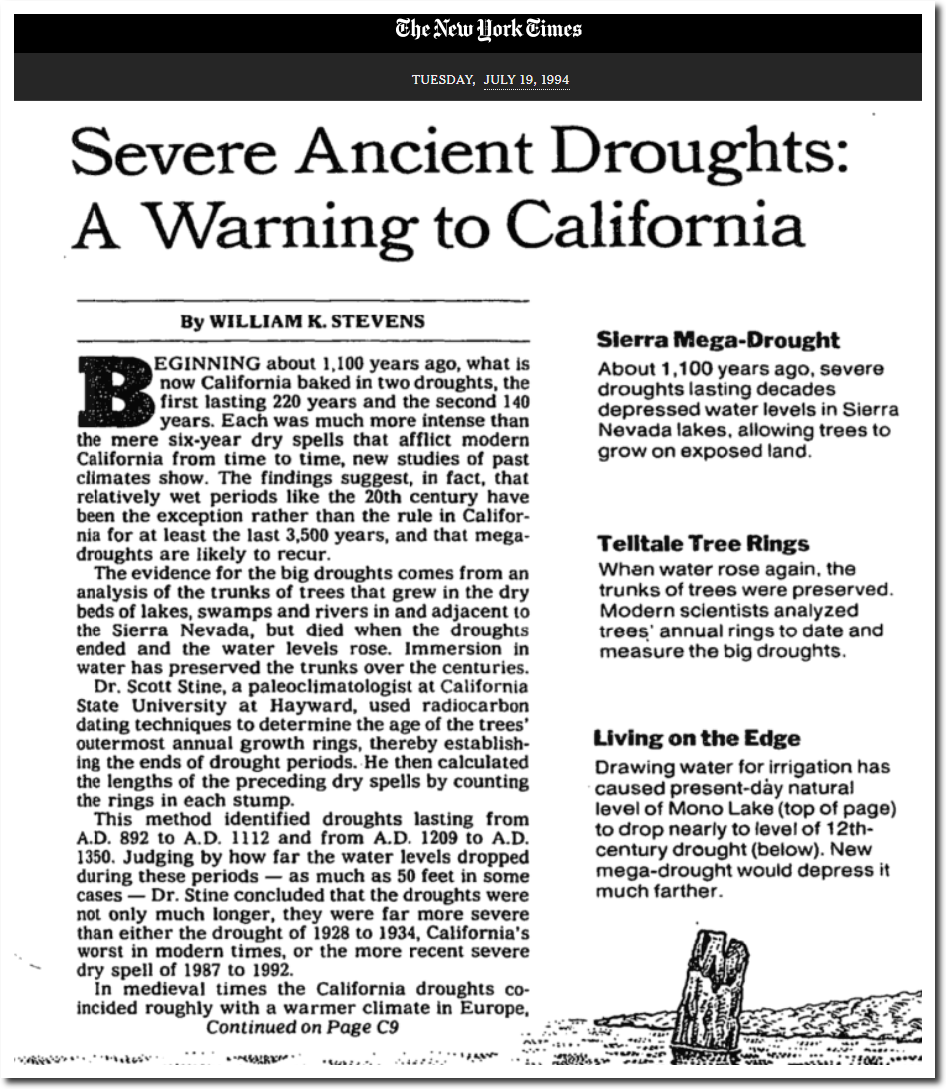
Severe Ancient Droughts: A Warning to California – The New York Times
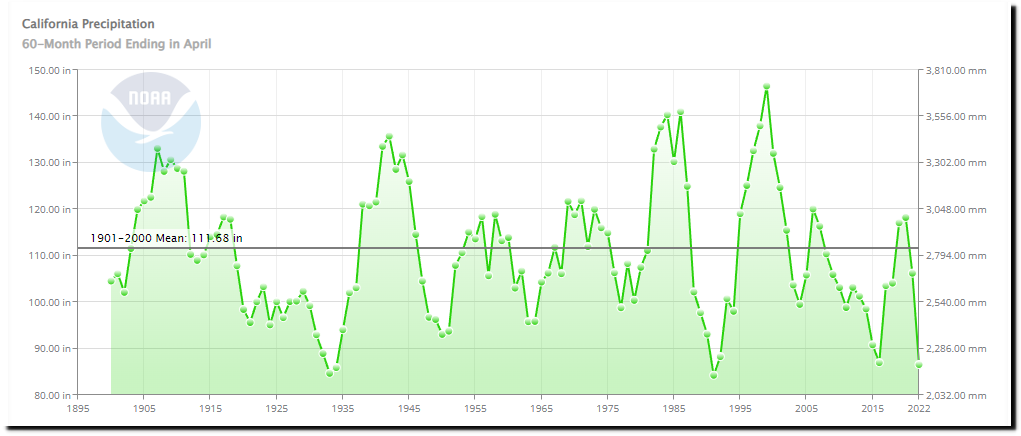
Climate at a Glance | National Centers for Environmental Information (NCEI)
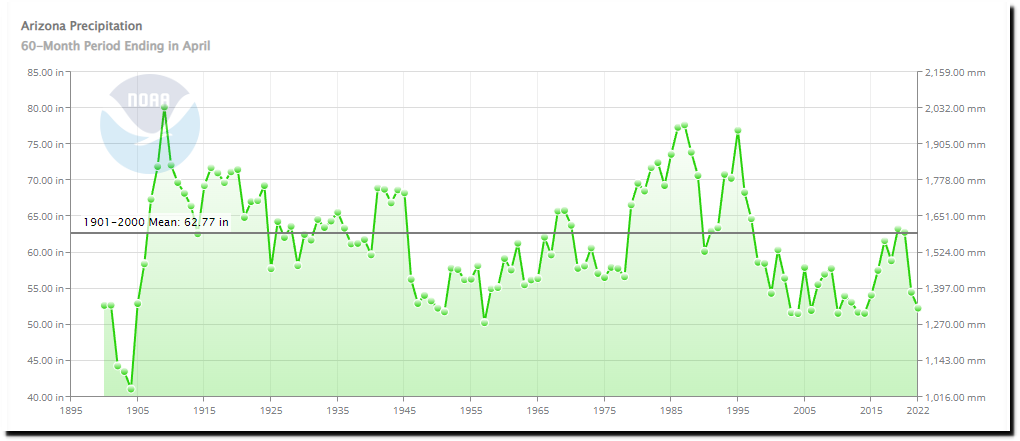
Climate at a Glance | National Centers for Environmental Information (NCEI)
Climate at a Glance | National Centers for Environmental Information (NCEI)
