Tamino posted the monthly anomaly graph below purportedly showing that snow cover is on a linear decline.

http://tamino.wordpress.com/2011/03/05/snow/
First problem is that he is running a linear trend line across what is obviously a step function. In the late 1980s there was a step down, and since 1990 the trend is flat to up. The graph below shows monthly snow cover since 1990, which is on a slight upwards trend.

http://climate.rutgers.edu/
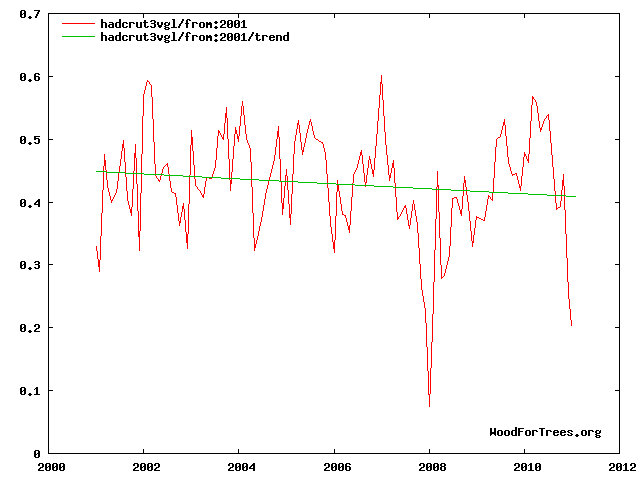
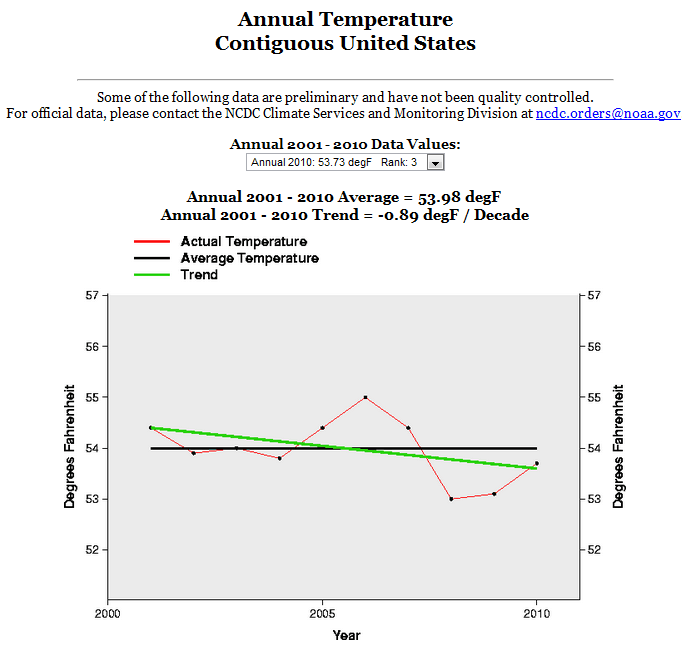
His second problem is that he is mixing apples and oranges. Winter snow cover is indicative of cold temperatures. Winter temperatures across the US, Europe and Asia have gotten colder over the last 20 years. A fact that Tamino and his ilk conveniently and consistently ignore.
Continue reading →