Every once in a while a reader earns special attention
New comment on your post “July 1934 Was Much Hotter Than July 2010”
Author : KarmakazeComment:
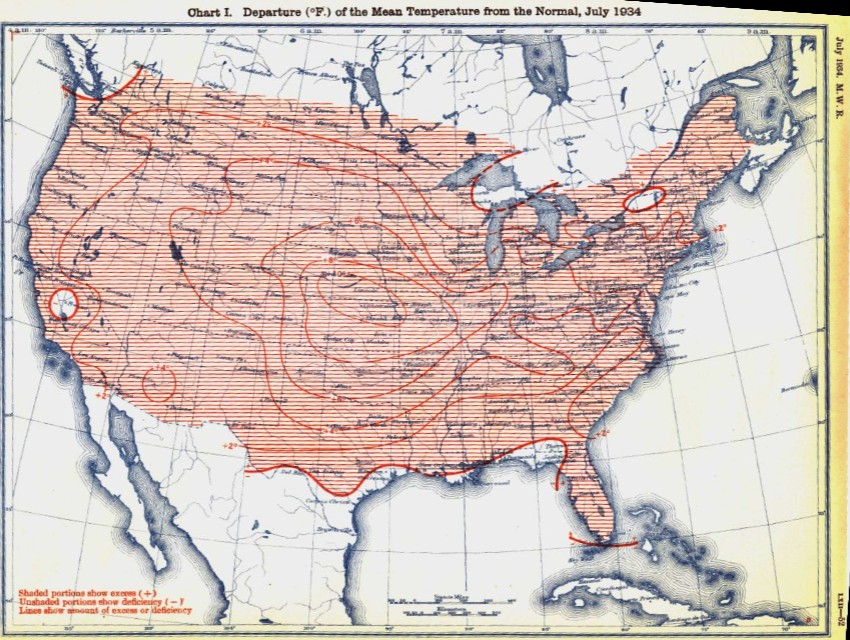
I agree with Steve Goddard! Send this out to everyone you know, so they can see how stupid he is!Seriously, you do realise an anomaly map shows the difference from some standard temperature, right? You also saw that the 2010 map is the departure from the 1971 to 2000 normal, right?
So what is the 1934 temperature map comparing to, the pre 1934 normal? It’s not labelled on the map, but clearly it can’t be the SAME normal, can it?
Fool.
Our friend thinks he is on to something. He reasons that the two maps below use a different baseline, and that affects the outcome.


July, 2010 July, 1934
Being generous (i.e. accepting Hansen’s adjustments as legit) let’s pretend that the baseline on the 1934 map is 0.4 degrees lower than the baseline on the 2010 map. Given that the granularity of the color bands is 2.0 degrees, we would see very little (if any) change in the map. And we don’t have any way of obtaining that information anyway.
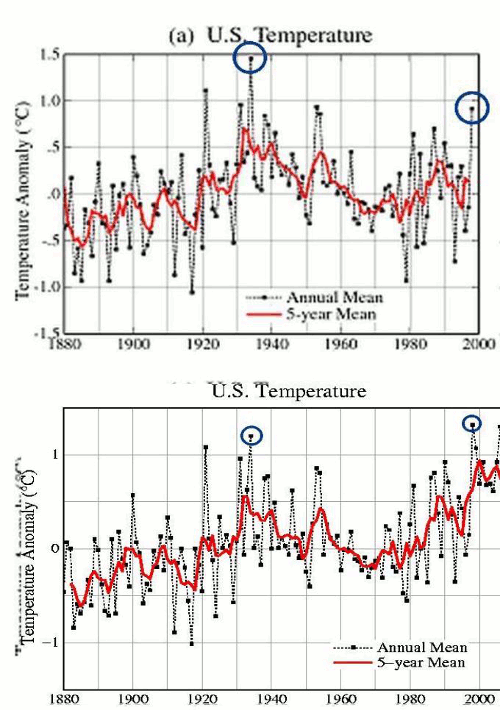
Now, if we look at a more legitimate scenario – i.e. Hansen’s map before if was corrupted – we see that there actually isn’t much (if any) difference in the baselines.

http://www.giss.nasa.gov/research/briefs/hansen_07/fig1x.gif
The interesting thing about alarmists is that they tend display an uncanny lack of quantitative skill. For them the fact that the Earth has warmed a few tenths of a degree means that the world is coming to an end.