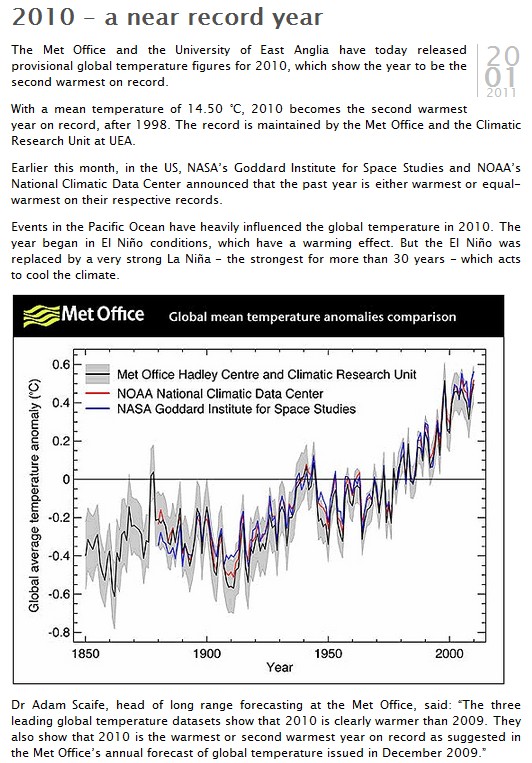
[At reader’s request, I am sticking this to the top of the front page. Look below for new articles.]
[12:54 Mountain Time : NASA has fixed the graph. See update ]
[14:05 Mountain Time : New graph is not the same as the original graph – more soon]
I’ve reported on this before, but here is a more in depth explanation.
In 1999, Hansen wrote a report which was largely inconsistent with his current claims. Twelve years ago he understood that the US climate was hotter and more extreme in the 1930s. He also knew that 1934 was the hottest year in the US.
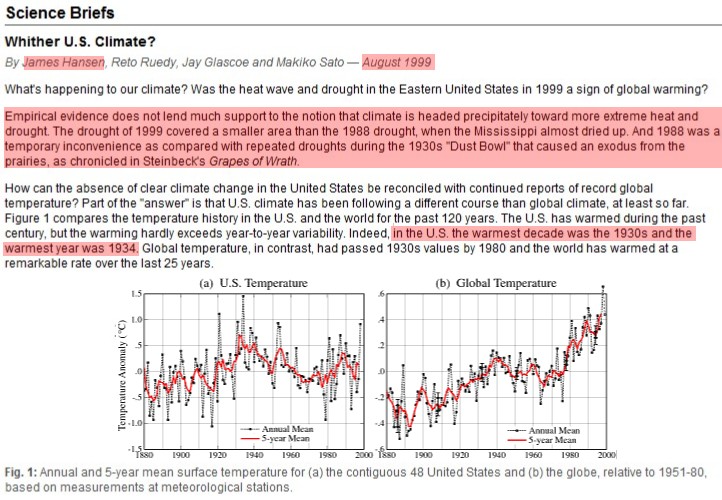
http://www.giss.nasa.gov/research/briefs/hansen_07/
Note the US temperature graph above, and compare that with the current US temperature graph below.
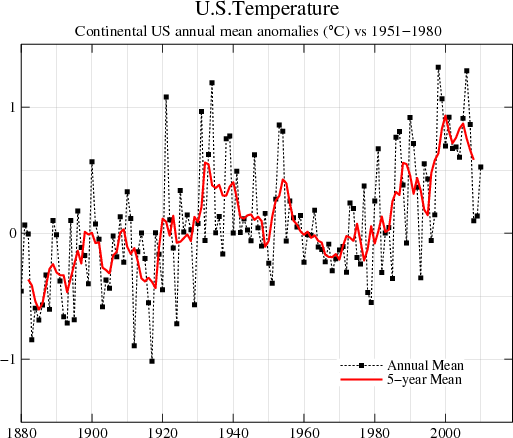
http://data.giss.nasa.gov/gistemp/graphs/Fig.D.gif
In the original version, 1934 was much warmer than 1998. Sometime in the year 2000, the data was “adjusted” to make 1998 warmer. The blink comparator below shows the radical change which occurred.