
NASA has this global warming thing pegged solid.


A new NASA report is out showing the extreme heat affecting the world. Particularly in Europe.

My comments are interspersed in red.
The world is getting warmer. Whether the cause is human activity or natural variability (or manipulation by GISS) thermometer readings all around the world have risen steadily since the beginning of the Industrial Revolution.
According to an ongoing temperature analysis conducted by scientists at NASA’s Goddard Institute for Space Studies (GISS), the average global temperature on Earth has increased by about 0.8°Celsius (1.4°Fahrenheit) since 1880. Two-thirds of the warming has occurred since 1975 (carefully cherry-picked start date), at a rate of roughly 0.15-0.20°C per decade.
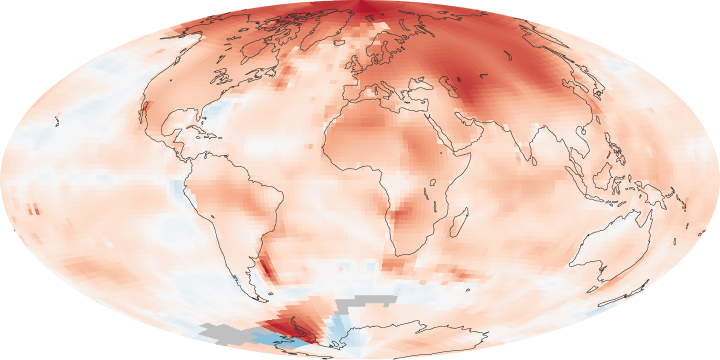
The maps above show temperature anomalies, or changes, for 2000-2009 (top) and 1970-1979 (ice age scare.) The maps do not depict absolute temperature, but how much warmer or colder a region is compared to the norm for that same region from 1951-1980 (global cooling cherry-pick.) That period was chosen largely because the U.S. National Weather Service uses a three-decade period to define “normal” or average temperature (because it gave us a scary red map.) The GISS temperature analysis effort began around 1980, so the most recent 30 years were 1951-1980. It is also a period when many of today’s adults grew up, so it is a common reference that many people can remember. (We ignore the 1930s because we don’t want to confuse people with the truth.)
http://earthobservatory.nasa.gov/IOTD/view.php?id=47628
According to an ongoing temperature analysis conducted by scientists at NASA’s Goddard Institute for Space Studies (GISS), the average global temperature on Earth has increased by about 0.8°Celsius (1.4°Fahrenheit) since 1880. Two-thirds of the warming has occurred since 1975, at a rate of roughly 0.15-0.20°C per decade.
The maps above show temperature anomalies, or changes, for 2000-2009 (top) and 1970-1979. The maps do not depict absolute temperature, but how much warmer or colder a region is compared to the norm for that same region from 1951-1980. That period was chosen largely because the U.S. National Weather Service uses a three-decade period to define “normal” or average temperature. The GISS temperature analysis effort began around 1980, so the most recent 30 years were 1951-1980. It is also a period when many of today’s adults grew up, so it is a common reference that many people can remember.
BOULDER, Colo.–(BUSINESS WIRE)–The 2010 Churchill polar bear season promises to be a banner year for bear watchers, says Natural Habitat Adventures polar bear expert Steve Selden, editor of churchillpolarbears.org, a polar bear news and conservation website published as a joint venture between Natural Habitat Adventures and World Wildlife Fund. “Churchill will welcome thousands of travelers over the next seven weeks,” writes Selden, referring to the October and November Churchill, Manitoba, polar bear tour season, which coincides with the bears’ annual migration to await the formation of sea ice for winter hunting on Hudson Bay. In a recent blog post, Selden predicts “prodigious numbers of bears” this year based on unusually high summer sightings.
They invade residential areas in Canada because they want more open space.

Todd Stern, the U.S. special envoy for climate change, told delegates at Cancun that Washington spent more than $90 billion to tackle domestic environmental issues meant to reduce overall emissions of greenhouse gases.
The most important trait of a scientific mind is having your eyes open.

http://green.blogs.nytimes.com
The White House believes the NASA’s key functions are relations with the Islamic world and producing nonsensical studies and data about a non-existent problem.

Snow is indeed a thing of the past in the UK.

They will have to wait three more days for the next “increasingly rare event.”

“The country is rejecting his agenda. My vision of America is diametrically opposed to his. He sees America as the problem. I see America as the solution,” she told Time magazine in an interview conducted by email.
When asked what she thought of Mr Obama’s presidency so far, she replied: “Two words: Jimmy Carter.” She added that “someone who can draw a sharp contrast” was capable of beating the incumbent in two years’ time.


