Shock News : Drought Kills Half Of The Sheep In Australia

http://home.iprimus.com.au/foo7/droughthistory.html#7

The Murray River (Australia’s longest) was dry for six months in 1902.

From 1896 to 1902, the worst drought in Australia’s history is believed to have killed half of the sheep population. It was also a period of both record heat and cold. April, 1902 was the driest month of the twentieth century.

Continue reading →

Posted in Uncategorized | 6 Comments

Second Hand Smoke Kills Exactly Four Times As Many People As Global Warming

http://www.reuters.com/article/idUSTRE6AP00D20101126

http://www.guardian.co.uk/news/2005/may/19/thisweekssciencequestions.climatechange


Posted in Uncategorized | 13 Comments

Deciphering The Met Office

Some confusing communications have been released this week from the Met Office. The reason they are confusing is because we are not educated enough to understand them, but I will attempt to explain them here.

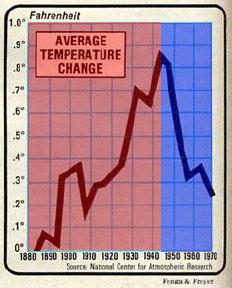
The area in red above is warming caused by burning coal. The area in blue is cooling caused by burning coal. You are also allowed to believe that cooling didn’t happen.

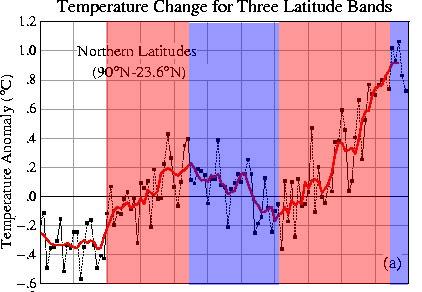
Looking at the longer term picture below, again red regions represent warming caused by burning coal, and blue regions represent cooling caused by burning coal.

The science is actually quite simple. Whatever trend numbers you come up with (after adjustments) you simply declare the slope to be upwards – and then blame it on burning coal.

Hope this helps.

Posted in Uncategorized | 3 Comments

Met Office Challenge Part 2

http://www.woodfortrees.org/

The red line represents the HadCRUT global cooling trend over the last decade (1/1/2001 – 10/31/2010.) The green line represents GISS.

“There’s a very clear warming trend but it’s not as rapid as it was before,” Pope told reporters yesterday in London. Where the average temperature rose at about 0.16 degrees per decade since the 1970s, the rate through the 2000s has been from 0.05 to 0.13 degrees, she said.

http://www.bloomberg.com/

The Met Office has been slacking, as they have been unable to locate the steep warming trend which GISS has clearly identified. But I have full confidence that with enough elbow grease they will be able to turn their “0.05 to 0.13” warming cooling trend around. England does not want another own goal against the Americans

[youtube=http://www.youtube.com/watch?v=OxspfInbLV8]

Posted in Uncategorized | 8 Comments

High Resolution Imagery Detects Human Impact On Arctic Ice

recent results from the Met Office do show that there is a detectable human impact in the long-term decline in sea ice over the past 30 years, and all the evidence points to a complete loss of summer sea ice much later this century.

http://www.metoffice.gov.uk/corporate/pressoffice/2009/pr20090211.html

I’ve long wondered how they differentiate “human impact” from natural ice cycles – which are several orders of magnitude larger than anything observed in the last 30 years. However, image processing of high resolution satellite imagery (seen below) has recently revealed an undeniable human footprint on the ice.

Continue reading →

Posted in Uncategorized | 3 Comments

Berbatov : At The Right Place At The Right Time

Five goals. I particularly liked the assist he took from Chimbonda.

Posted in Uncategorized | 2 Comments

Sea Ice Crossover Delayed

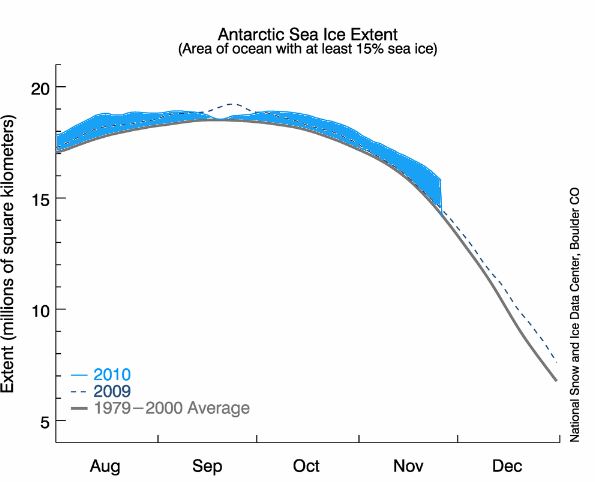
Normally, Arctic sea ice extent surpasses Antarctic extent in early December, but it isn’t going to happen this year. Antarctic ice is 1.7 million km² above normal, and Arctic ice is below normal by the same amount. Based on current trajectories, it appears that the crossover will occur in late December.

However, this graph doesn’t give the full story. Colder weather is settling in over the Hudson Bay and Chukchi Sea, so we should see the Arctic line turn sharply upwards during the next two weeks. Look for a positive anomaly of global sea ice in the near future.

That is what climatologists call a “meltdown.”

Posted in Uncategorized | 8 Comments

“Hottest Year Ever” Story Is Worse Than It Seems

http://www.remss.com/msu/msu_data_monthly.html

At present, no one other than GISS claims 2010 is the hottest year ever. The Met Office has announced their intentions to “adjust” their data in order to make 2010 (possibly) #1, but it hasn’t happened yet.

The other half of the story is that the main reason temperatures were recorded high during January-April was because of the record low Arctic Oscillation. The same weather pattern which made much of the Northern Hemisphere very cold, also brought balmy -21C weather to the Canadian Arctic – as opposed to the normal -25C weather.

-21C isn’t “hot” by most people’s definitions.

Posted in Uncategorized | 4 Comments

Sinclair Gets More Clueless By The Day

Blue area shows ice excess since August 1. On average, there have been more than 640,000 km^2 (10,000 Manhattans) of excess ice.

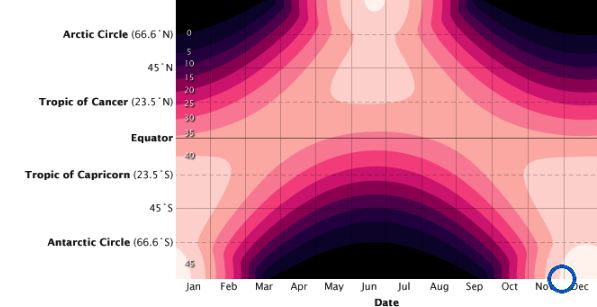
Peter Sinclair claimed in his hack attack piece that the excess does not occur when the sun is high in the sky. But the blue circle below shows that he has it backwards. We are at peak anomaly now, and the sun is almost at it is maximum. The Earth is closest to the Sun this time of year too.

http://earthobservatory.nasa.gov/Features/EnergyBalance/page3.php

Posted in Uncategorized | 5 Comments

Pattern Recognition Test For TSA Employees

Update – new terrorist added today!

One of the people pictured below is not a terrorist. Can you find that person?

Continue reading →

Posted in Uncategorized | 10 Comments