Update from John Cook :
Sorry it’s taken me so long to get to this discussion where earlier clarification would’ve been helpful.
Steve is correct that the caption of my Figure 1 is mislabelled – I should’ve said “NH land temperature”, not “NH temperature”. I’ve corrected the caption and indicated the update at the bottom of the blog post. Using instrumental land temperature is the appropriate metric as Moberg’s proxy is also a measure of NH land temperature. To use the full NH temperature would be comparing apples to oranges.
Steve is incorrect when he claims “he goes on and does climate sensitivity calculations based on bogus data from a cherry-picked hemisphere”. I don’t do any climate sensitivity calculations in this post. I’ve cited Hegerl 2000 which uses proxy data (not instrumental data) over the last 750 years to calculate a best guess climate sensitivity of around 3 degrees C. I’ve also compared this to the IPCC climate sensitivity range of 2°C to 4.5°C which is based on the full body of evidence (eg – proxy data over the last millennium, global instrumental data going back to 1850, global climate responses to volcanic eruptions, global satellite measurements of outgoing radiation, etc).
——————————————————————————————————
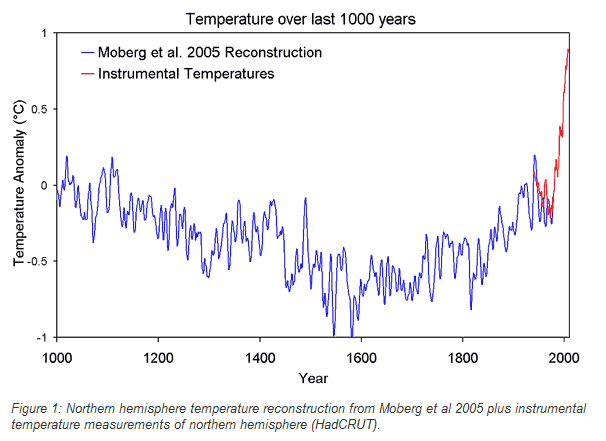
John Cook has taken the hockey stick to a new level of BS with the graph above. It shows northern hemisphere temperatures rising more than 1ºC since the mid-1970s, supposedly based on HadCrut.
The actual HadCrut northern hemisphere graph shows a much smaller rise of about 0.7ºC since the mid-1970s, and little warming over the last decade.