
CBS News says the Arctic is record hot at 100 degrees and bazillions of scientists say we have to take action to save the climate.
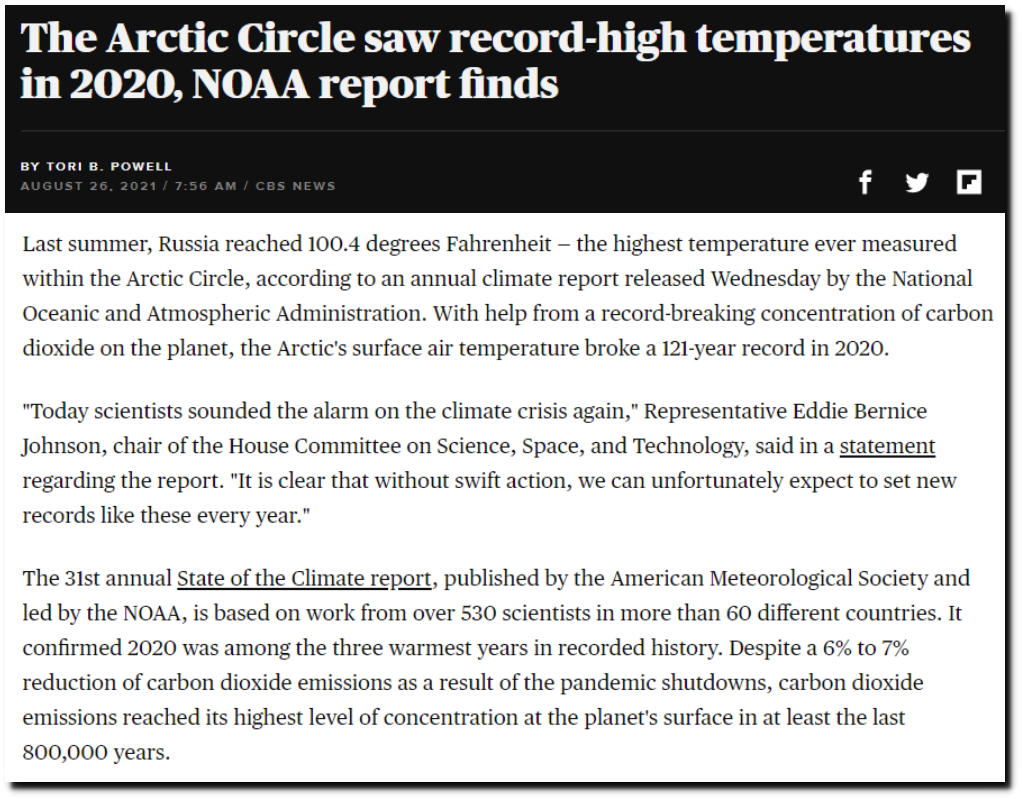
The Arctic Circle saw record-high temperatures in 2020, NOAA report finds – CBS News
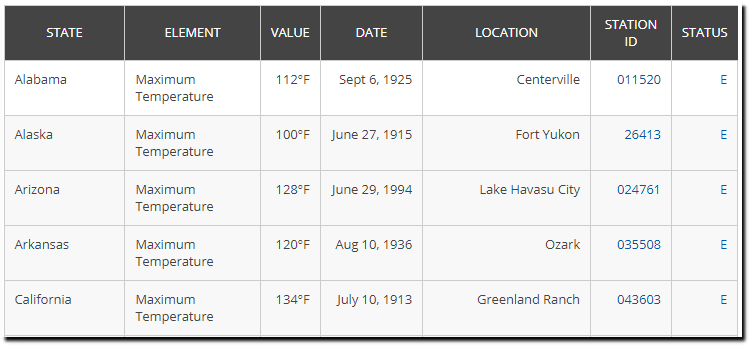
The official record temperature for Alaska is 100F above the Arctic Circle.
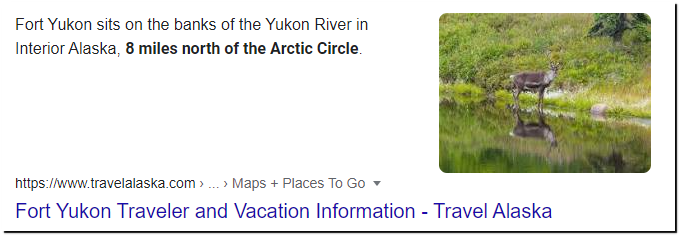
Fort Yukon Traveler and Vacation Information
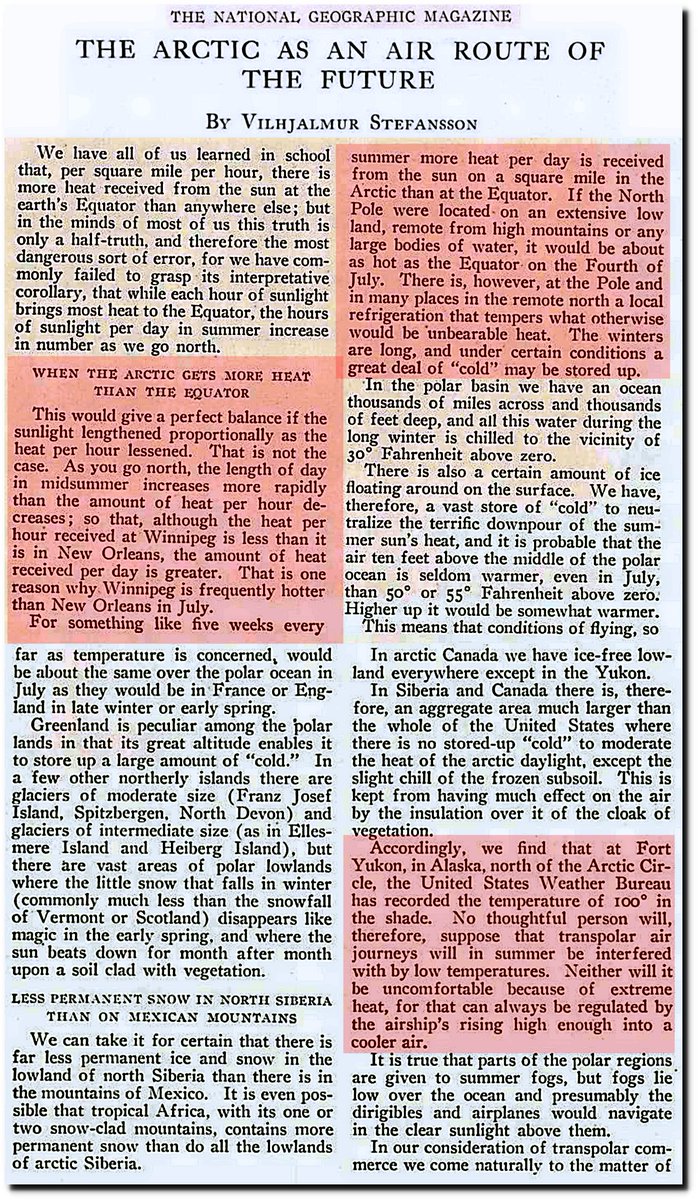
National Geographic Magazine Archive
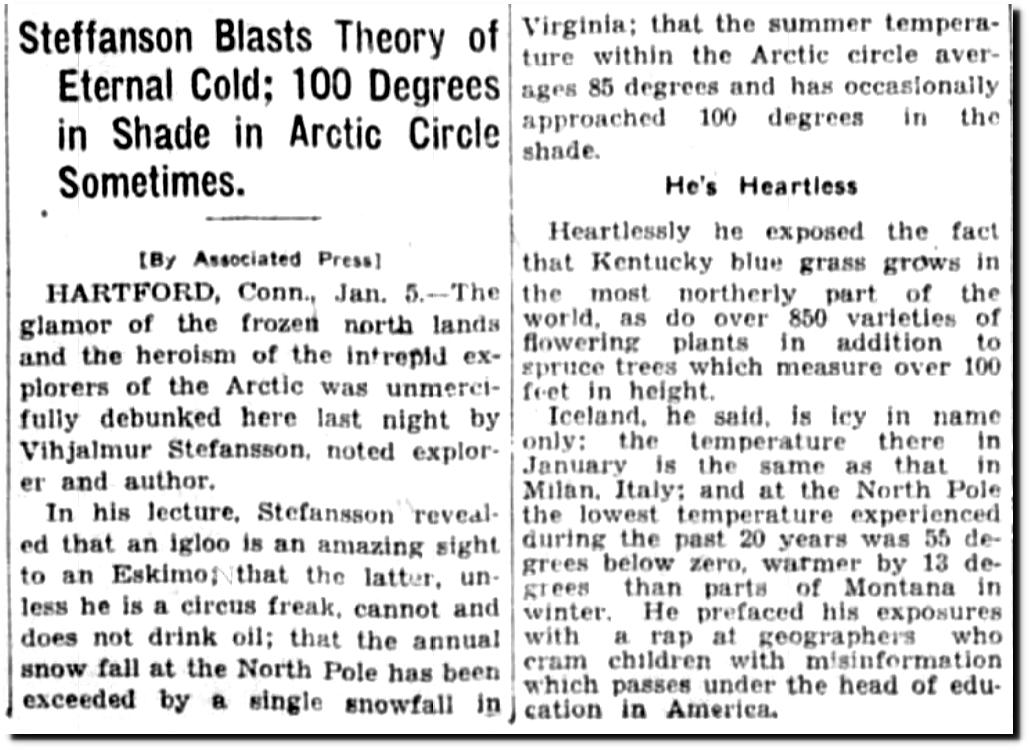
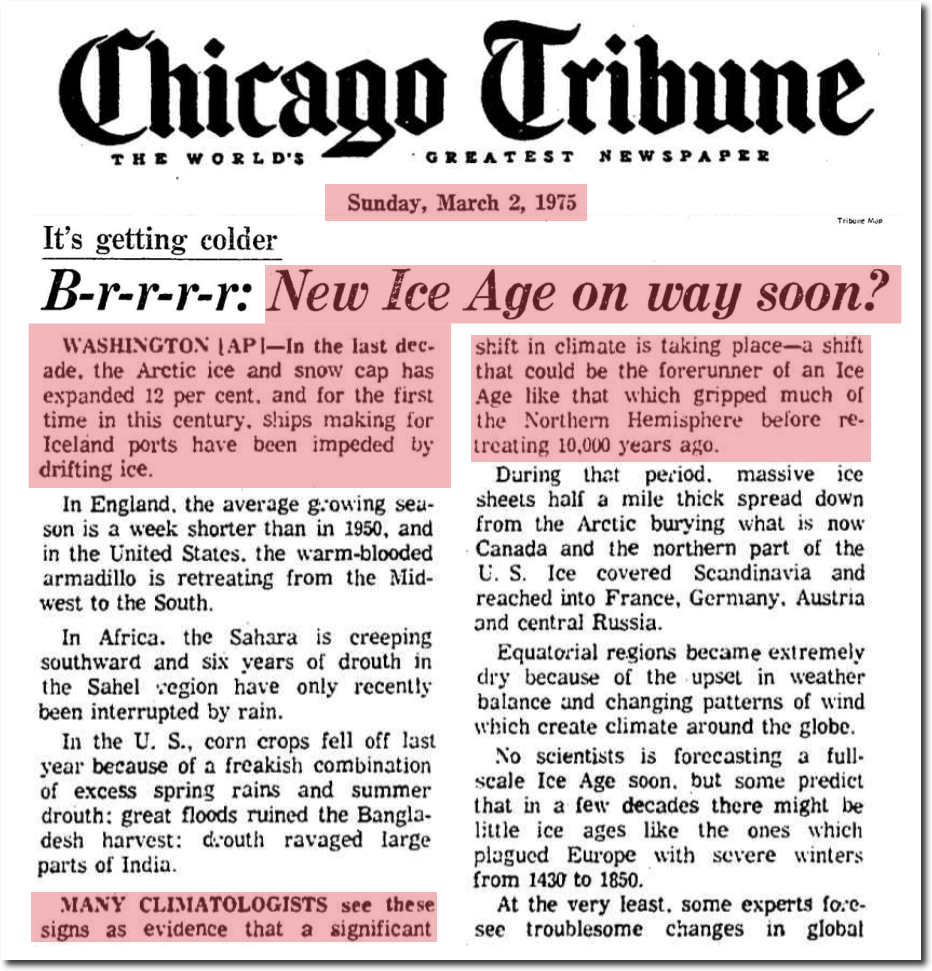
05 Jan 1928, Page 1 – The Winnipeg Tribune at Newspapers.com
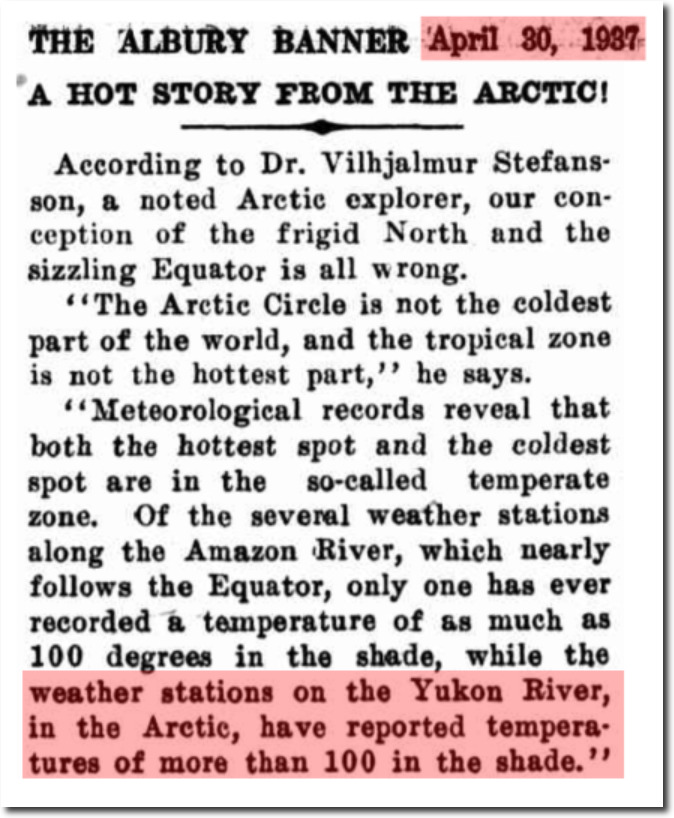
30 Apr 1937 – A HOT STORY FROM THE ARCTIC! – Trove
During the summer of 1927, temperatures over 32C were persistent in the Arctic.
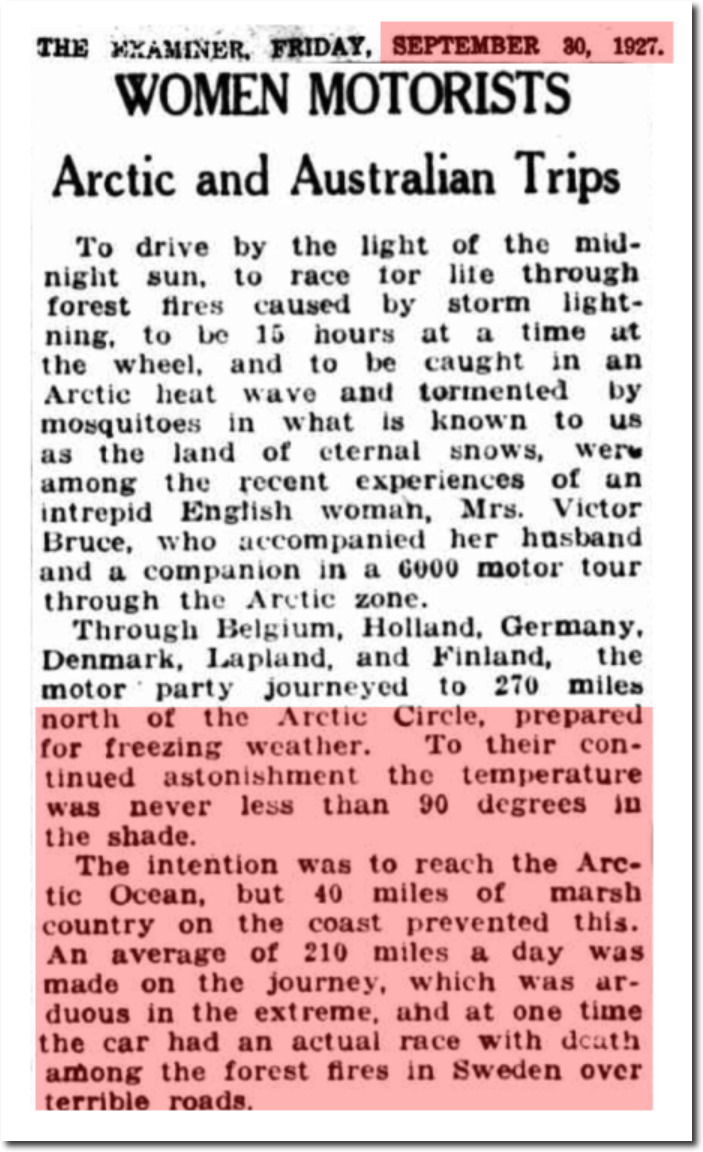
30 Sep 1927 – WOMEN MOTORISTS – Trove
The North Pole recieves the most solar energy of any place on earth at midsummer.
The total energy received each day at the top of the atmosphere depends on latitude. The highest daily amounts of incoming energy (pale pink) occur at high latitudes in summer, when days are long, rather than at the equator.
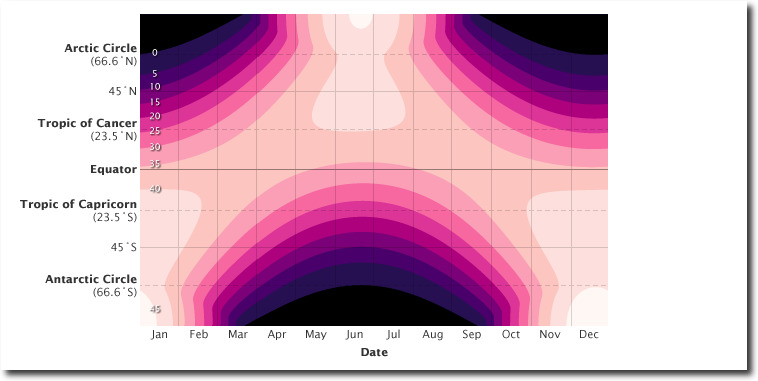
Climate and Earth’s Energy Budget
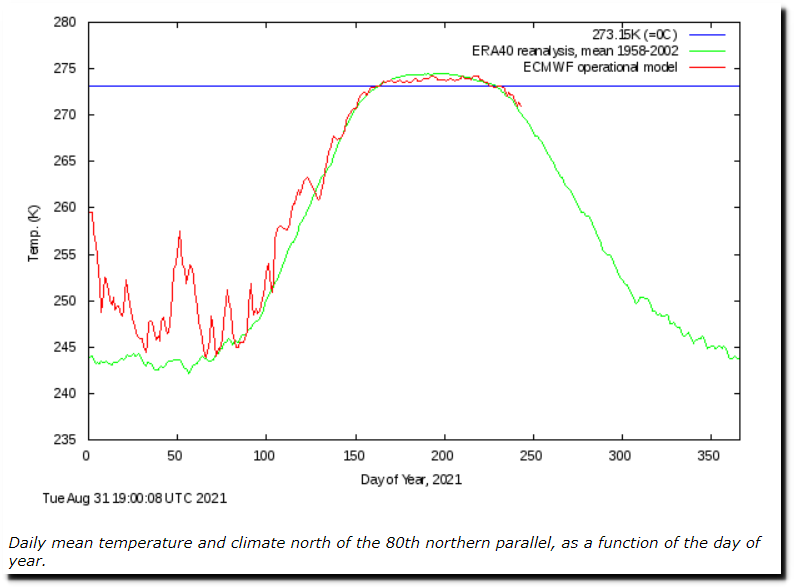
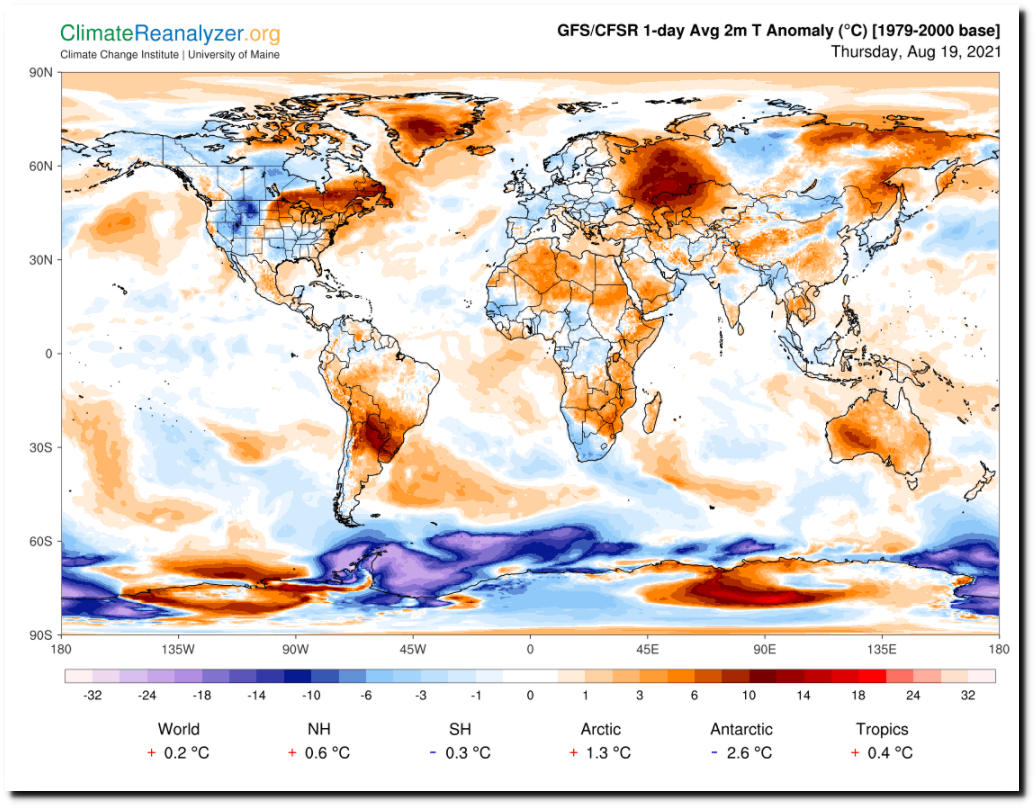
Temperatures at the North Pole were below average almost every day this summer.
Ocean and Ice Services | Danmarks Meteorologiske Institut
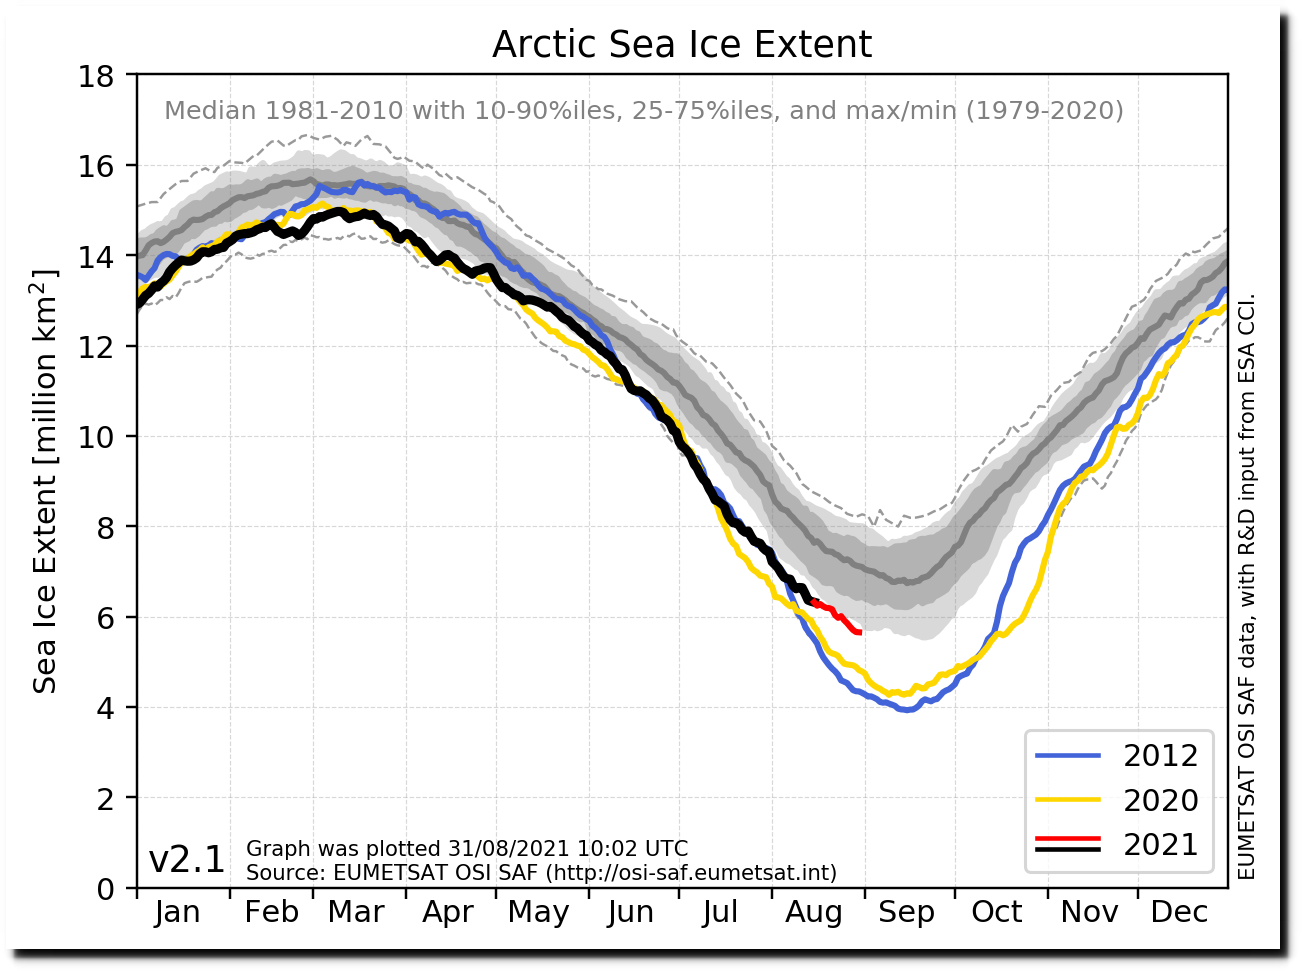
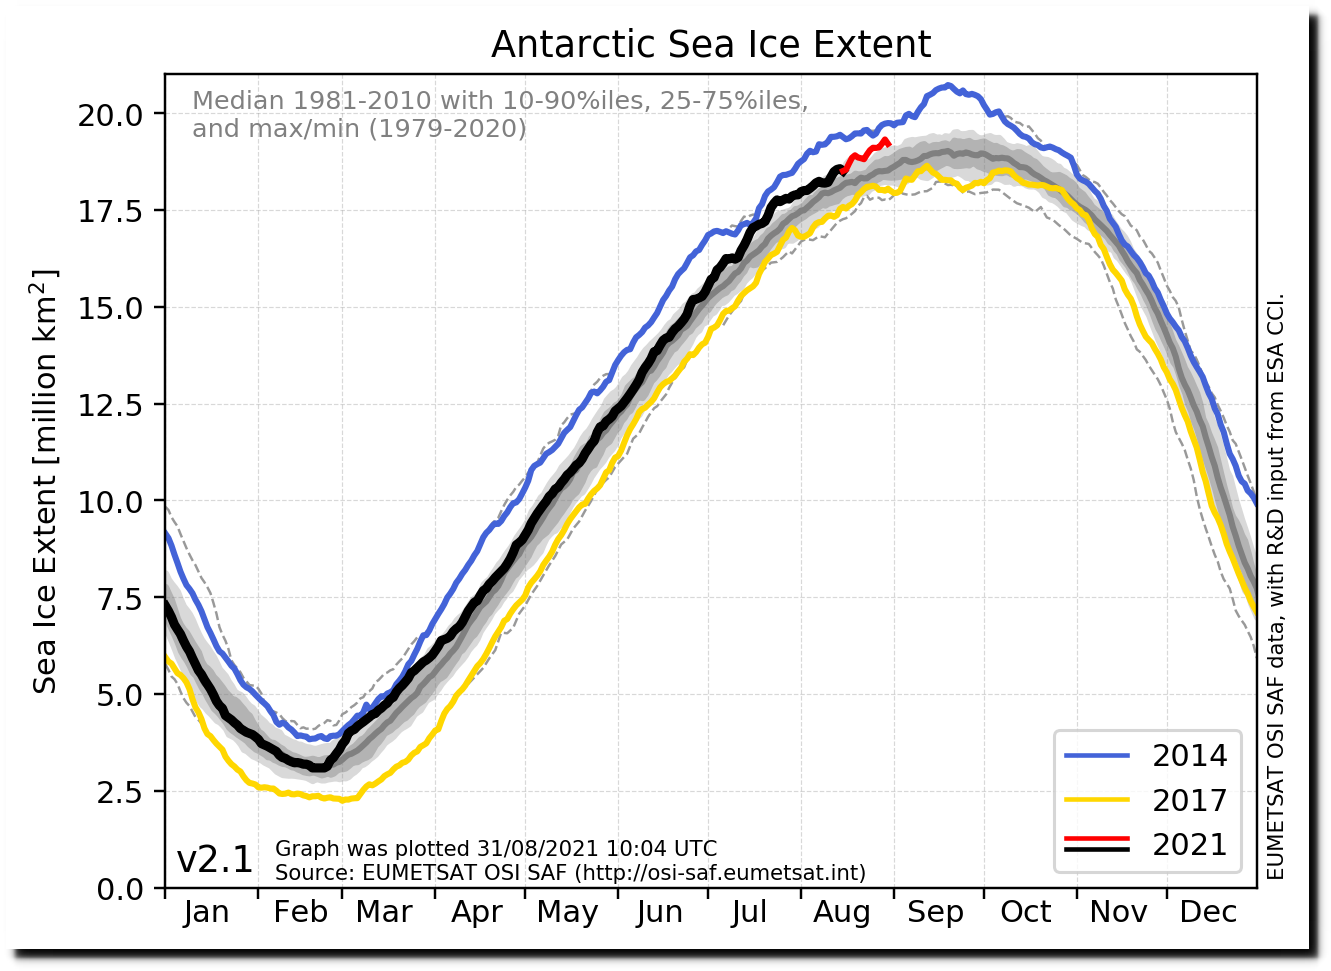
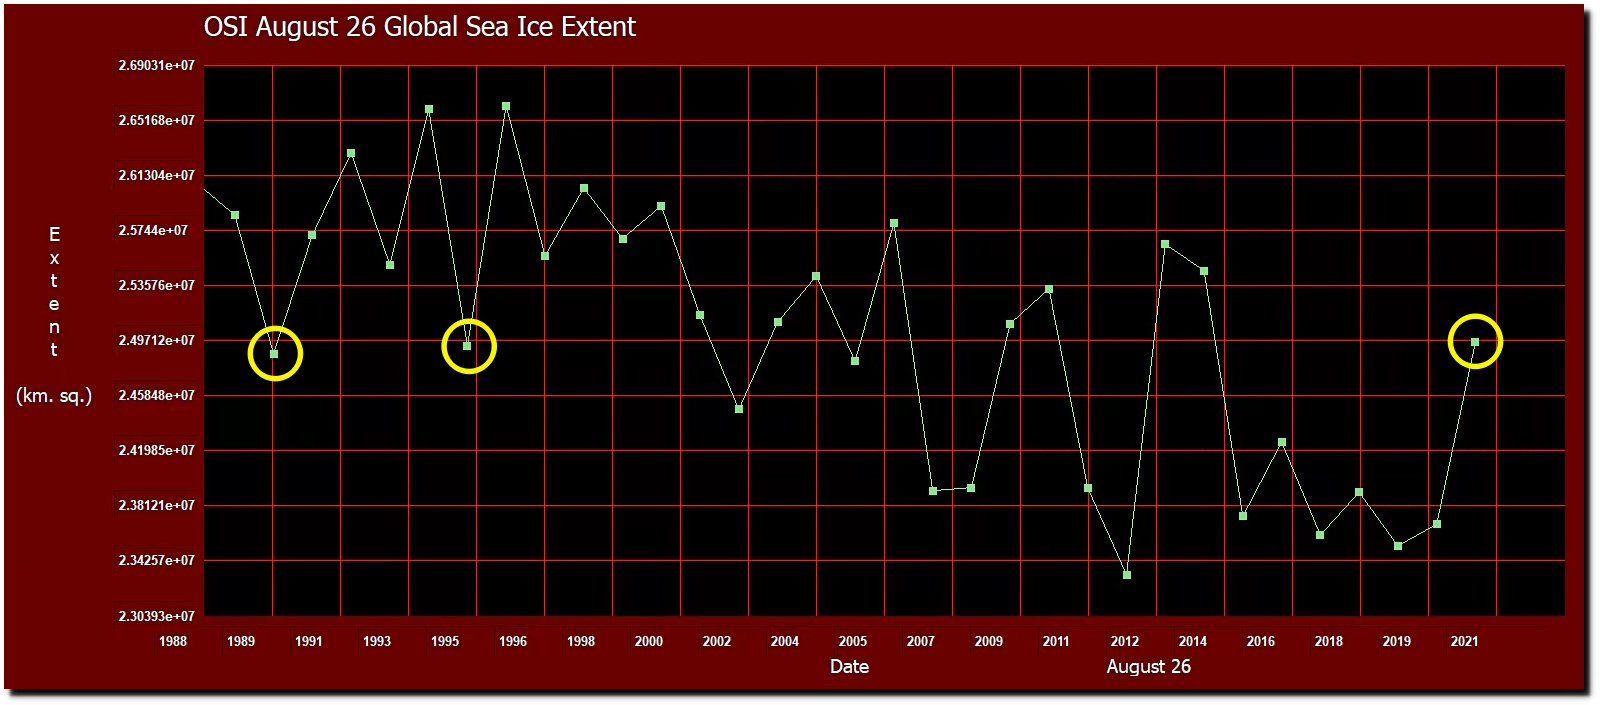
Ice extent at both poles is highest in seven years.
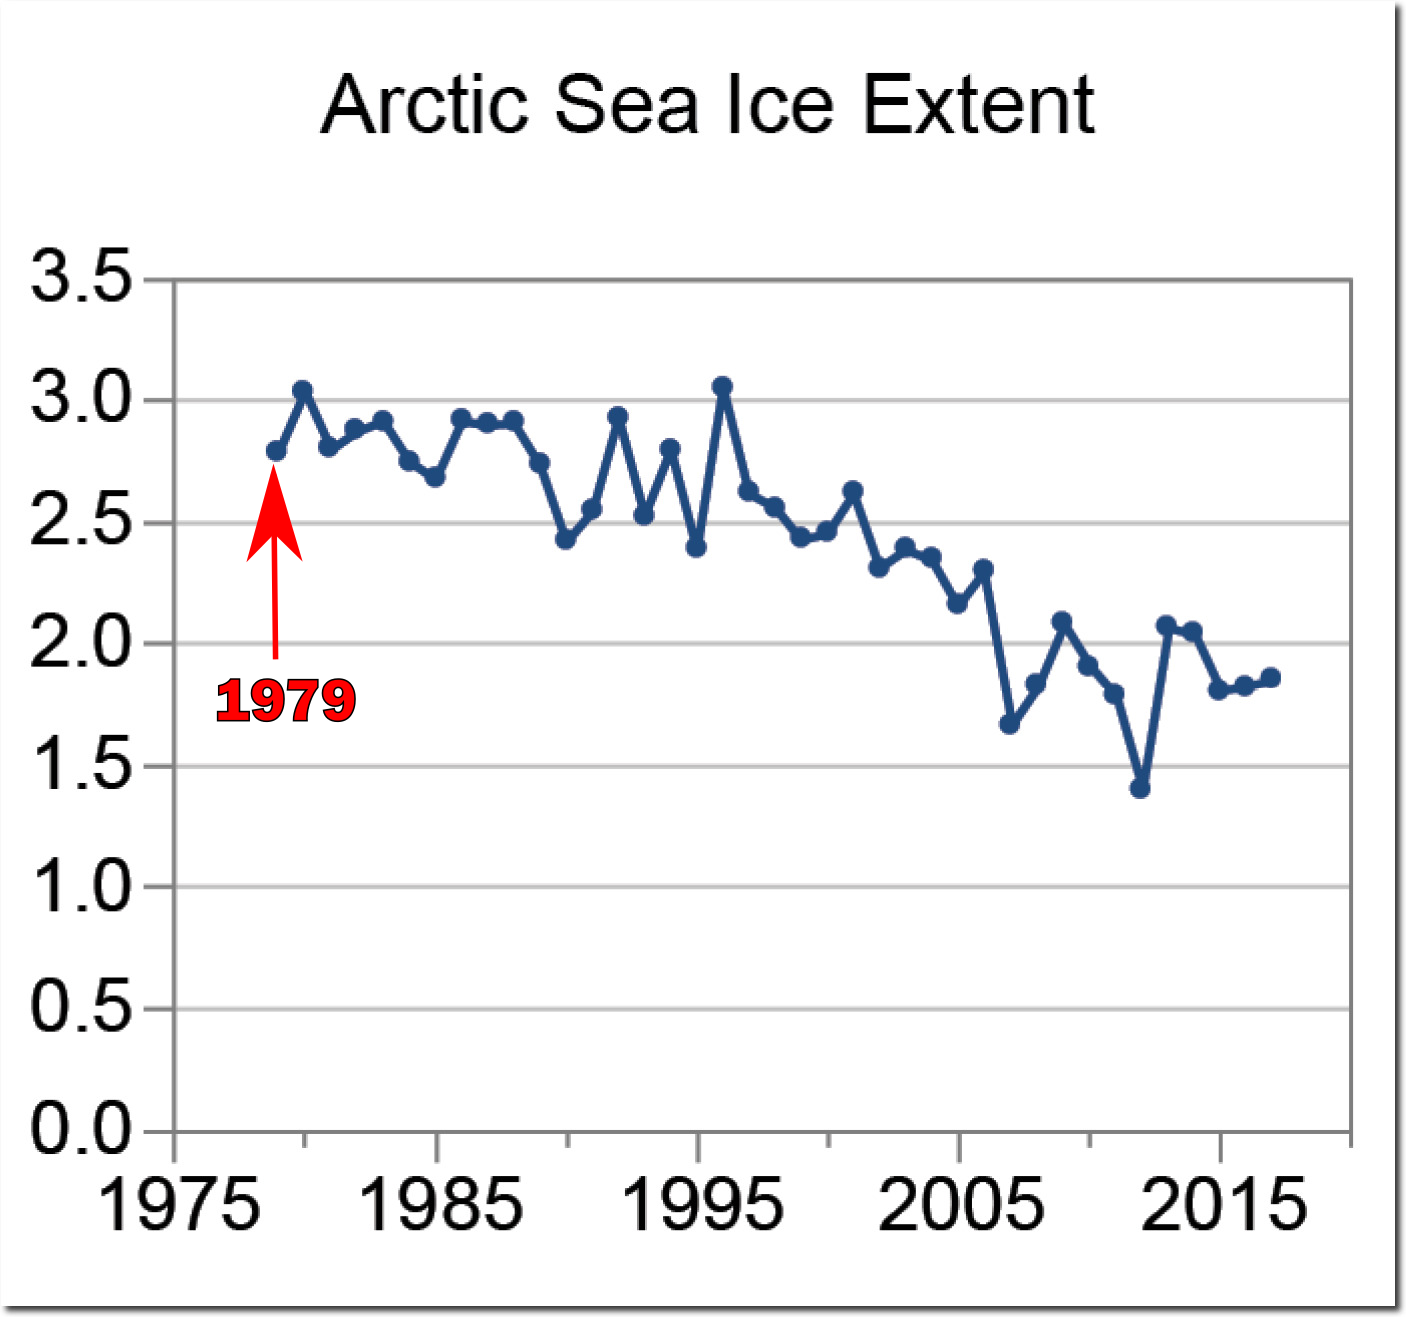
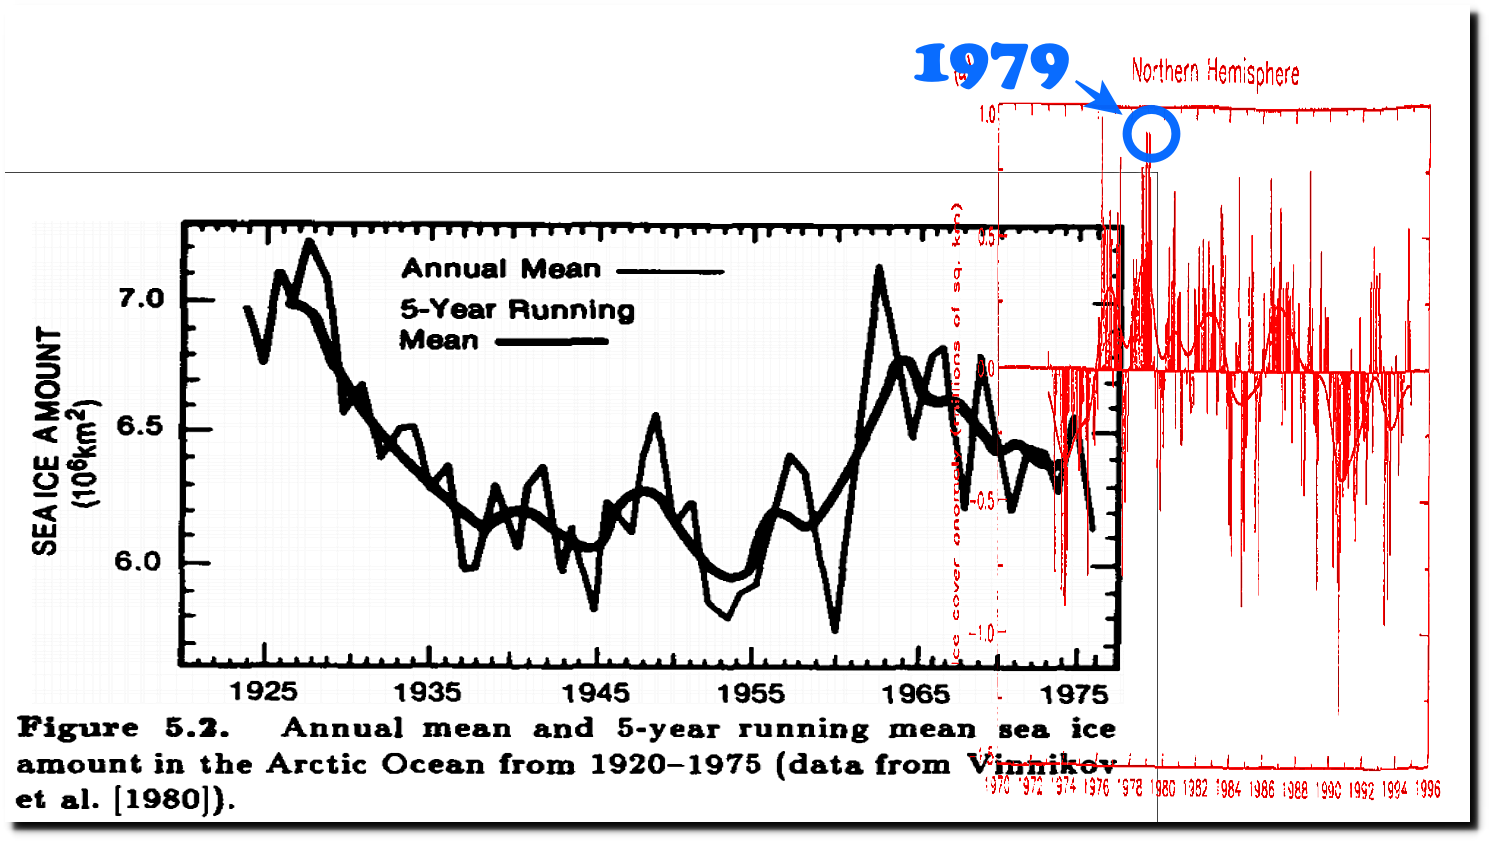
The 1980 USSR Report showed mid-1950s late August Arctic sea ice cover about 6 million km. sq, which is the same as this year.
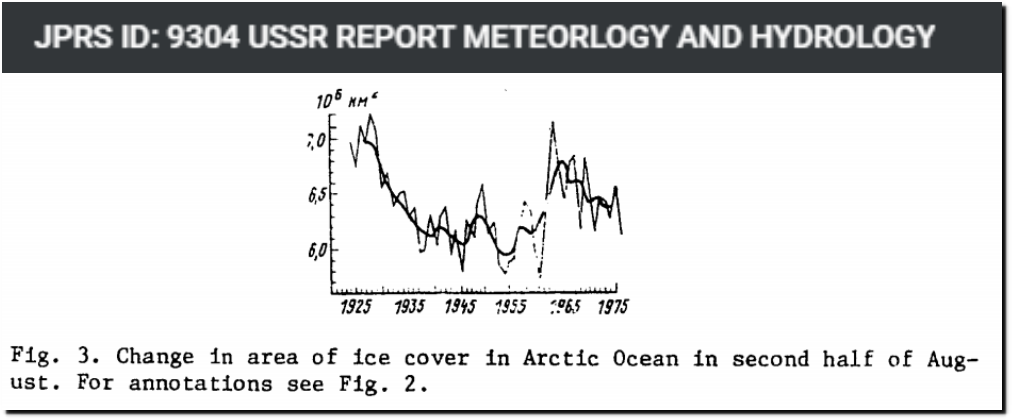
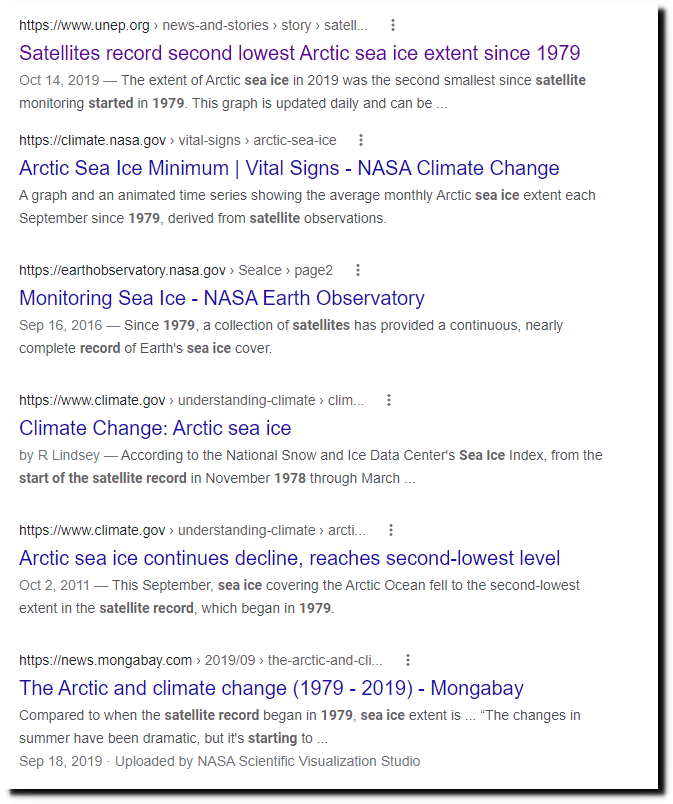
It also said satellites were used to measure sea ice since 1966.

JPRS ID: 9304 USSR REPORT METEORLOGY AND HYDROLOGY
OSI-420 | osisaf.metsis.met.no
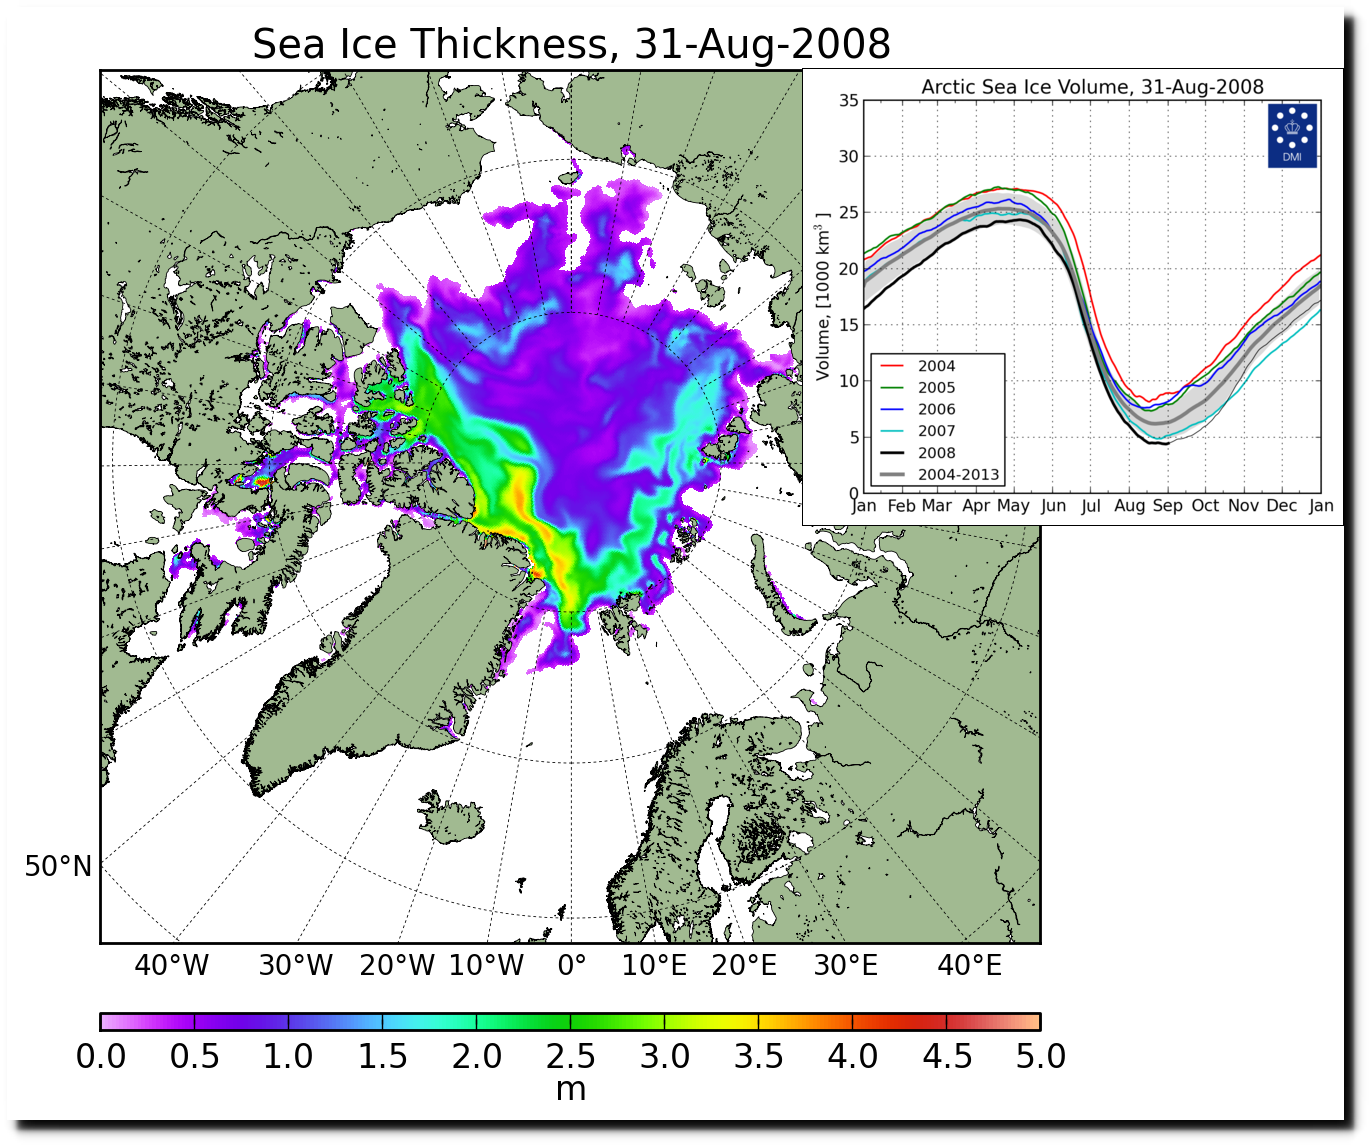
Arctic sea ice volume is up 20% from last year and just below the 2004-2013 average.
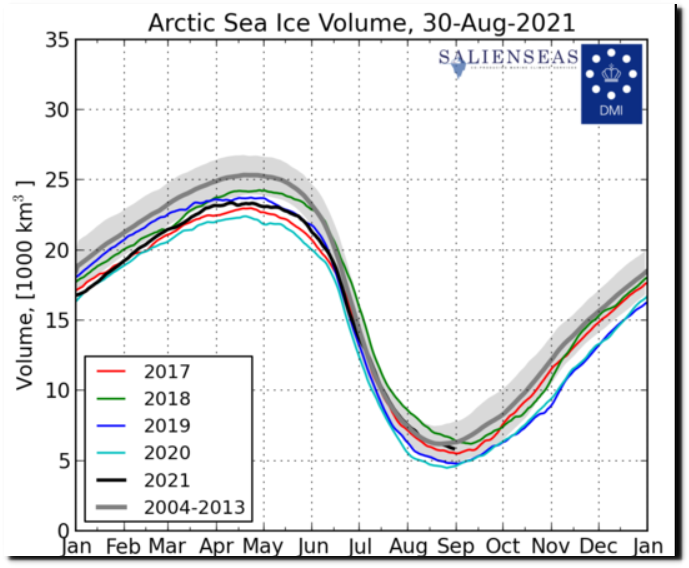
FullSize_CICE_combine_thick_SM_EN_20210830.png (1337×1113)
Sea ice volume has increased 20% over the last 13 years.

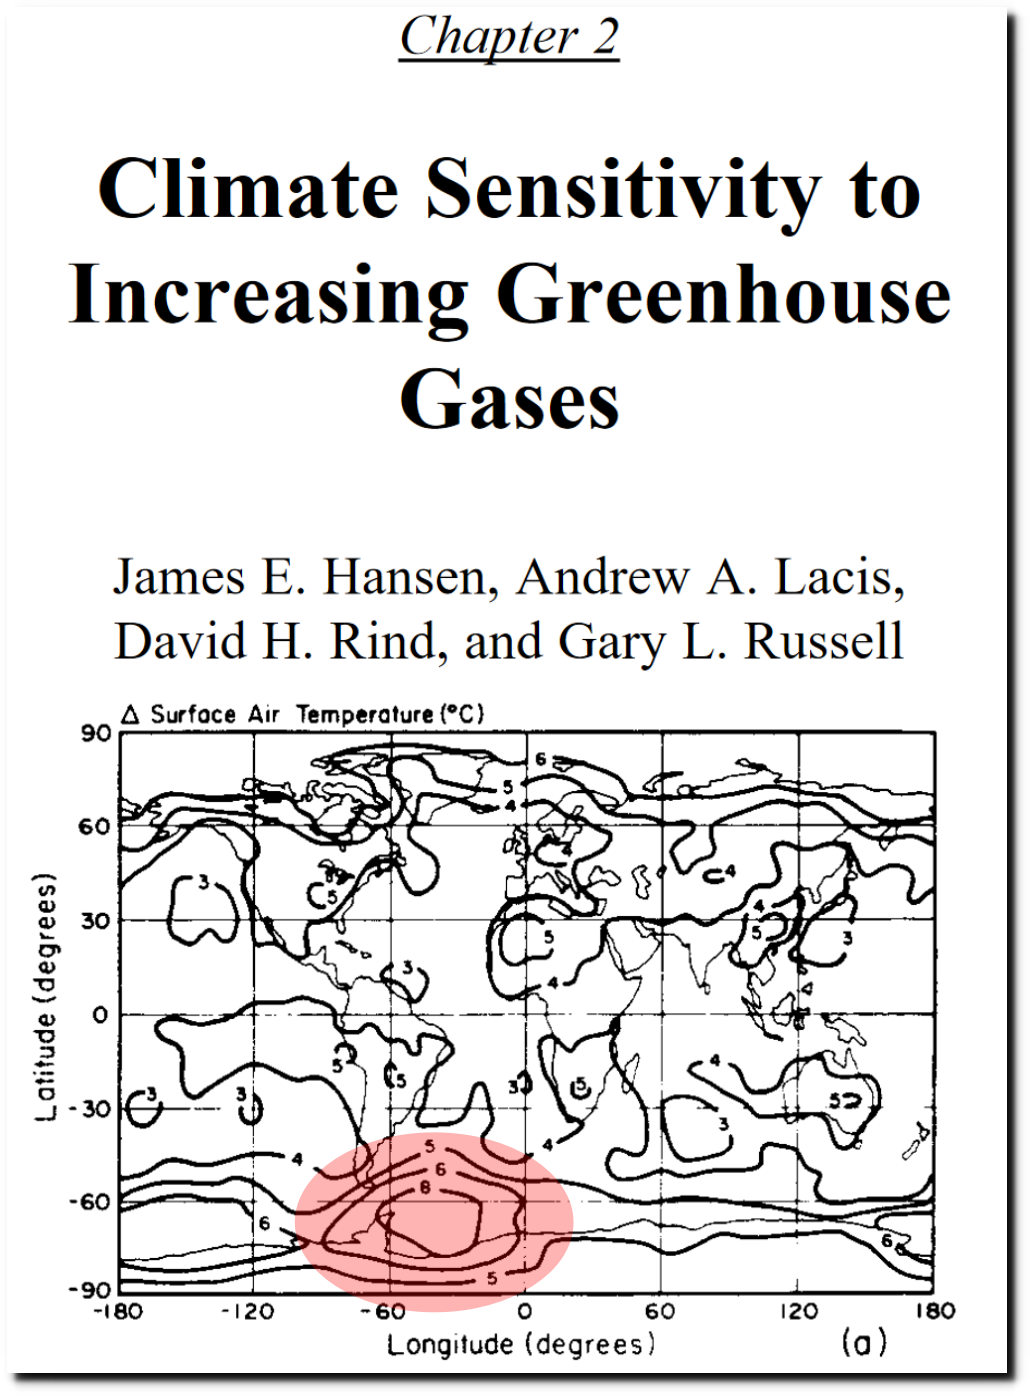
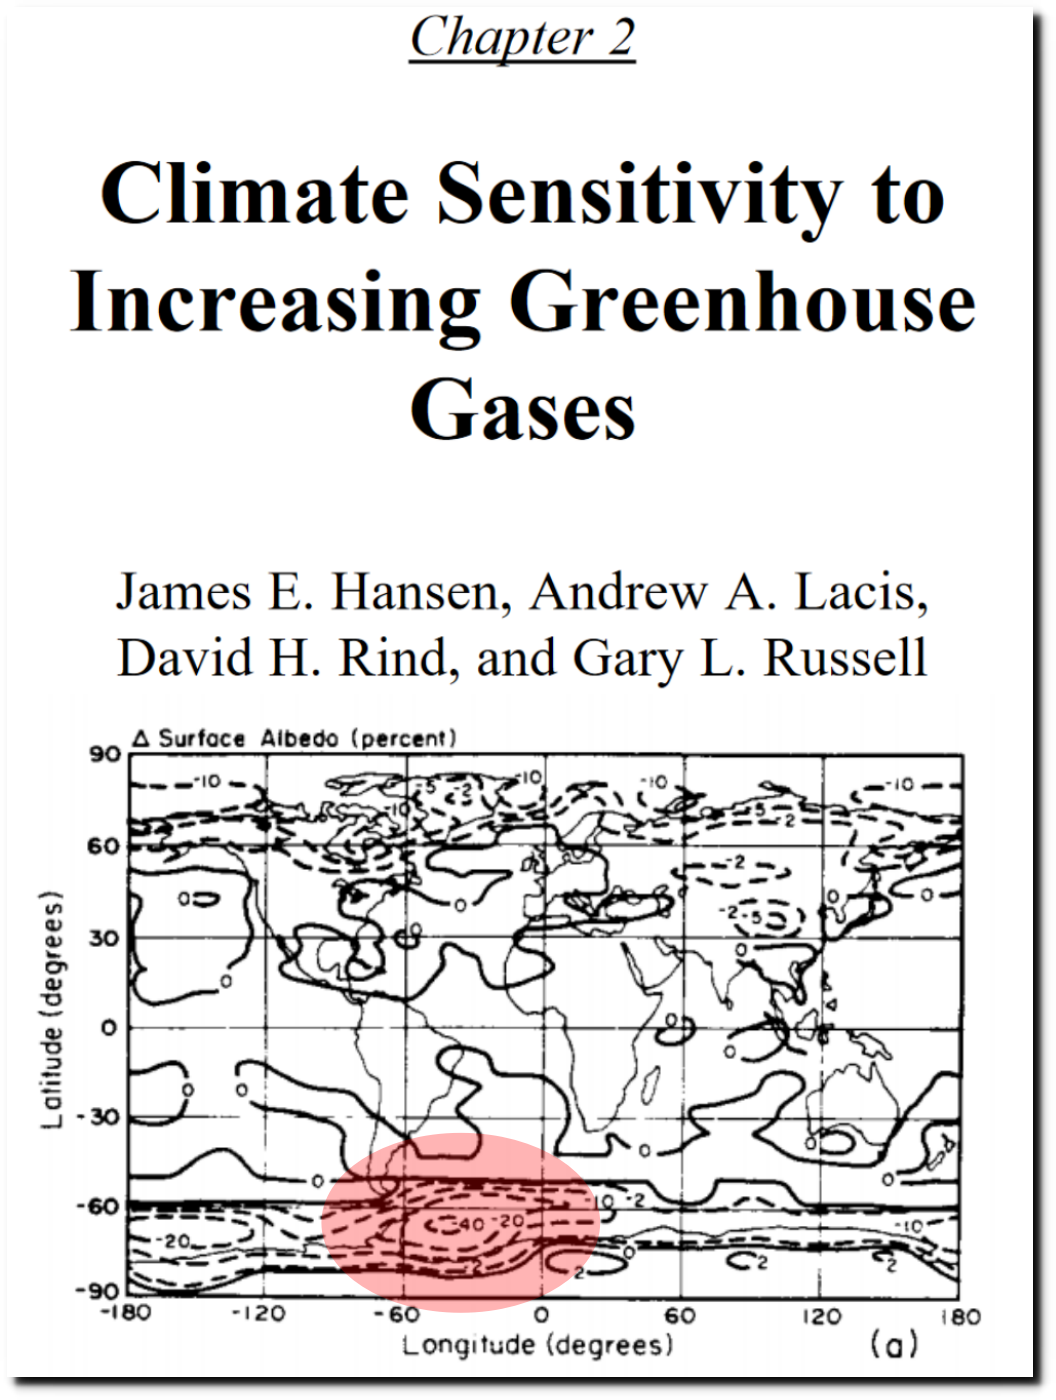
Hansen predicted peak warming and sea ice loss around Antarctica. The exact opposite has occurred.
In 2004, Gavin Schmidt reported decades of significant cooling over Antarctica.
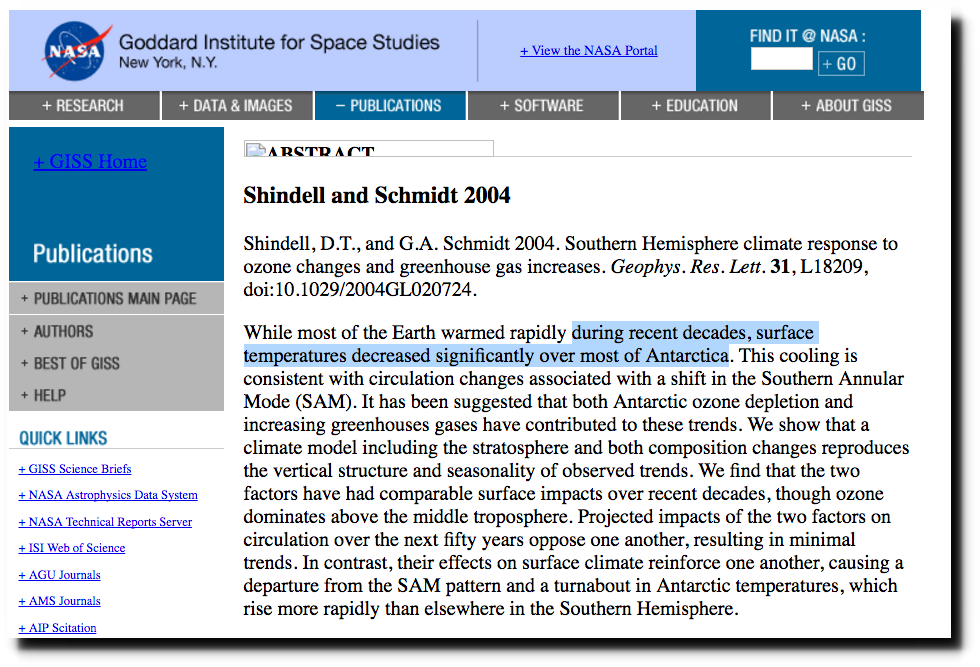
Pubs.GISS: Abstract of Shindell and Schmidt 2004
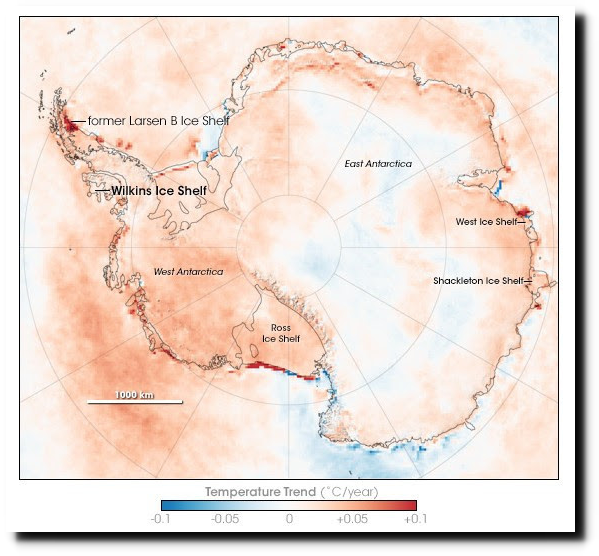
In 2005, NASA published a map showing the cooling.
SVS: Antarctic Heating and Cooling Trends
By 2007, NASA had completely erased the cooling.
Disintegration: Antarctic Warming Claims Another Ice Shelf : Feature Articles
By 2009, NASA had turned all the cooling into warming.

NASA – Satellites Confirm Half-Century of West Antarctic Warming
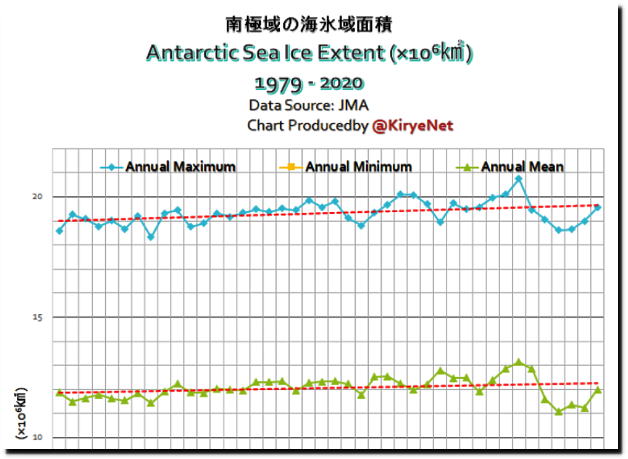
Antarctic sea ice extent has bene steadily increasing
The Greenland surface mass balance has been above average for three out of the last five years. Greenland’s surface has gained two trillion tons of ice over the past five years.
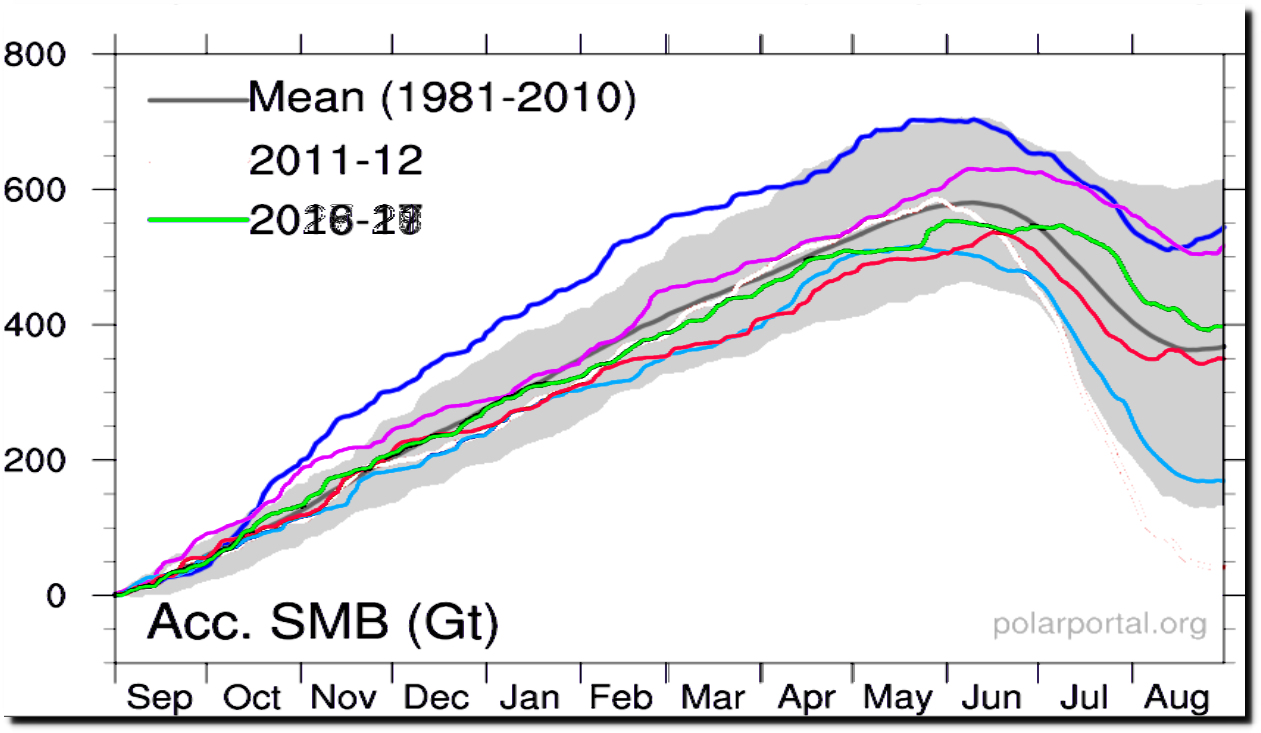
Surface Conditions: Polar Portal
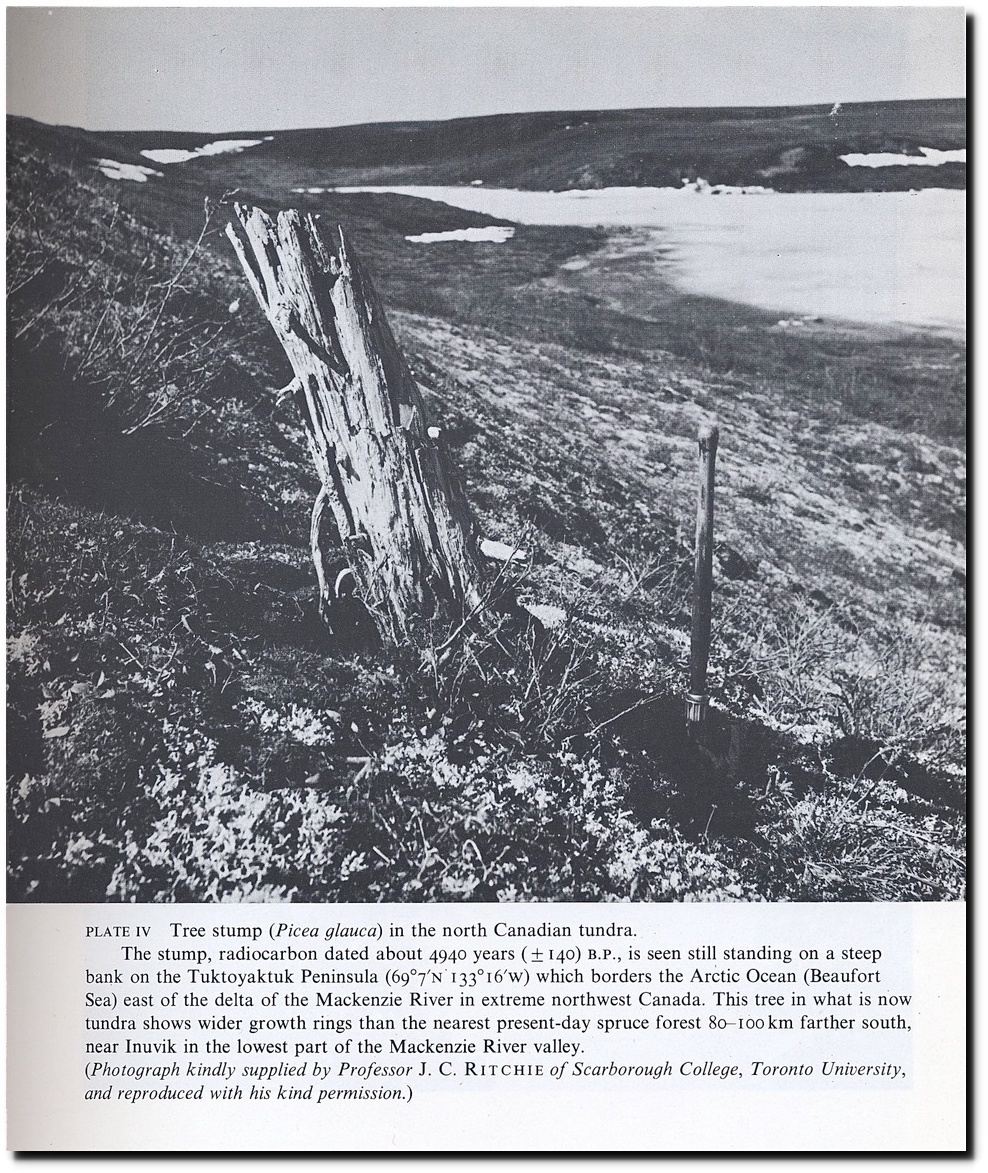
When Stonehenge was built, the Arctic Ocean was ice-free, there were trees growing all the way to the Arctic Ocean and July temperatures in the Arctic were 2.5-7C warmer.
Less Ice In Arctic Ocean 6000-7000 Years Ago — ScienceDaily
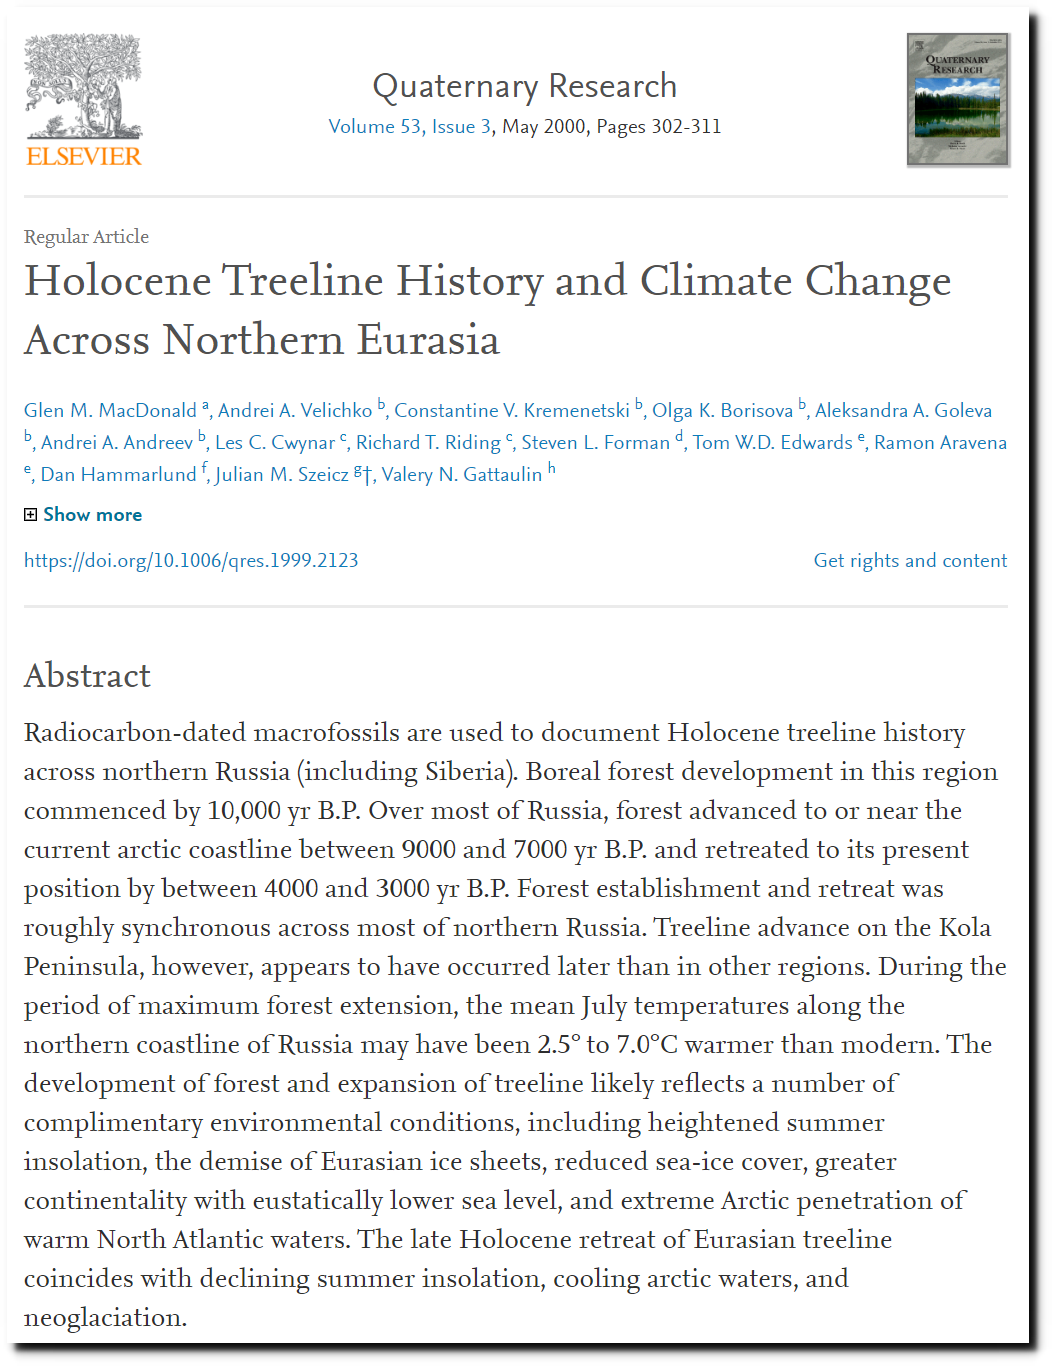
Holocene Treeline History and Climate Change Across Northern Eurasia – ScienceDirect
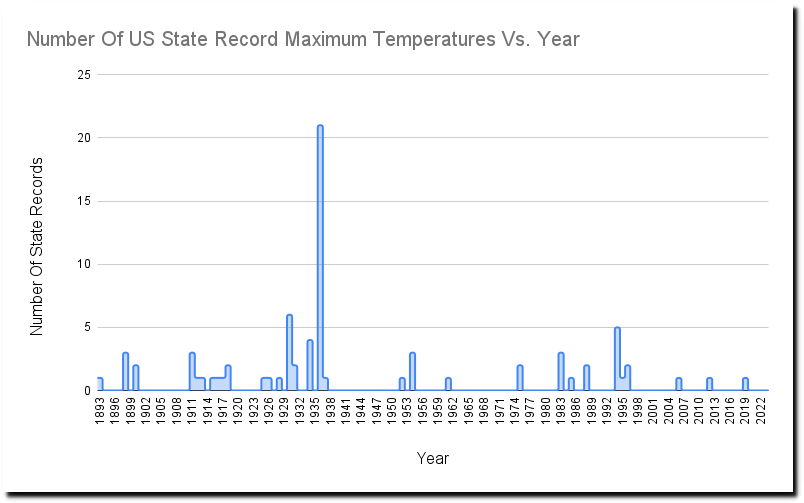
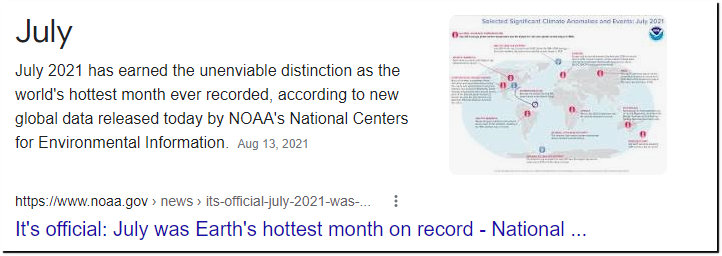
Most US state record maximum temperatures were set more than 85 years ago.
There is no indication government can control CO2, much less climate.
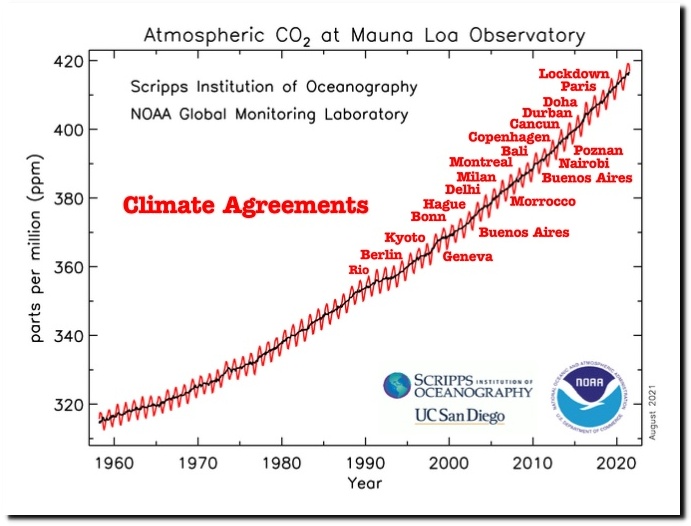
Global Monitoring Laboratory – Carbon Cycle Greenhouse Gases


