On August 12, 1936, one third of India was flooded and it was 120 degrees in Oklahoma.
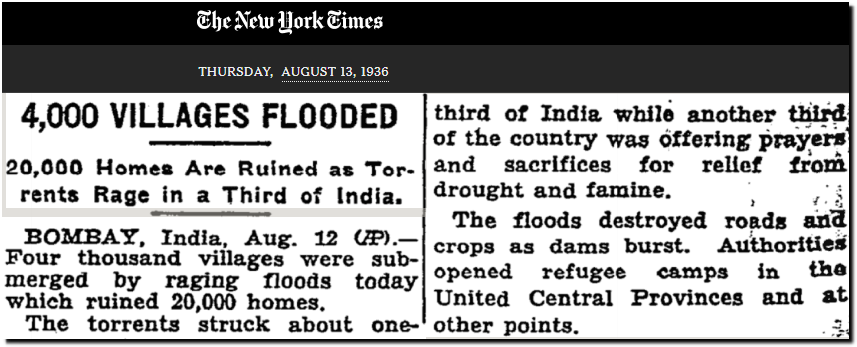
TimesMachine: August 13, 1936 – NYTimes.com
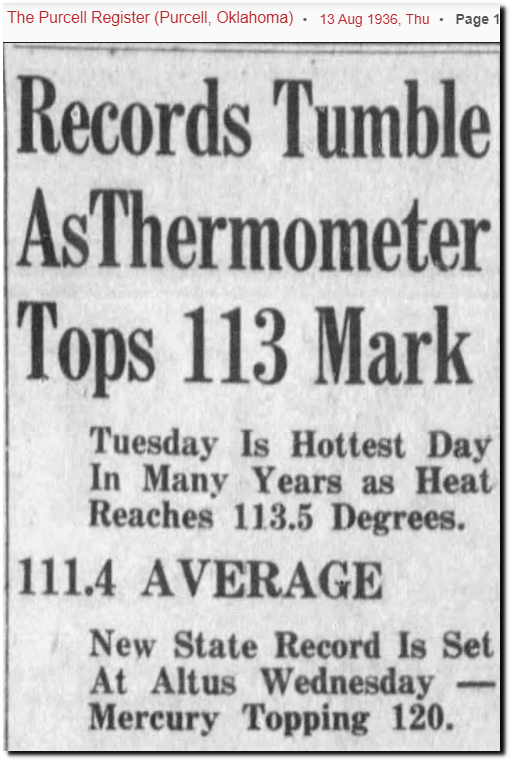 13 Aug 1936, 1 – The Purcell Register at Newspapers.com
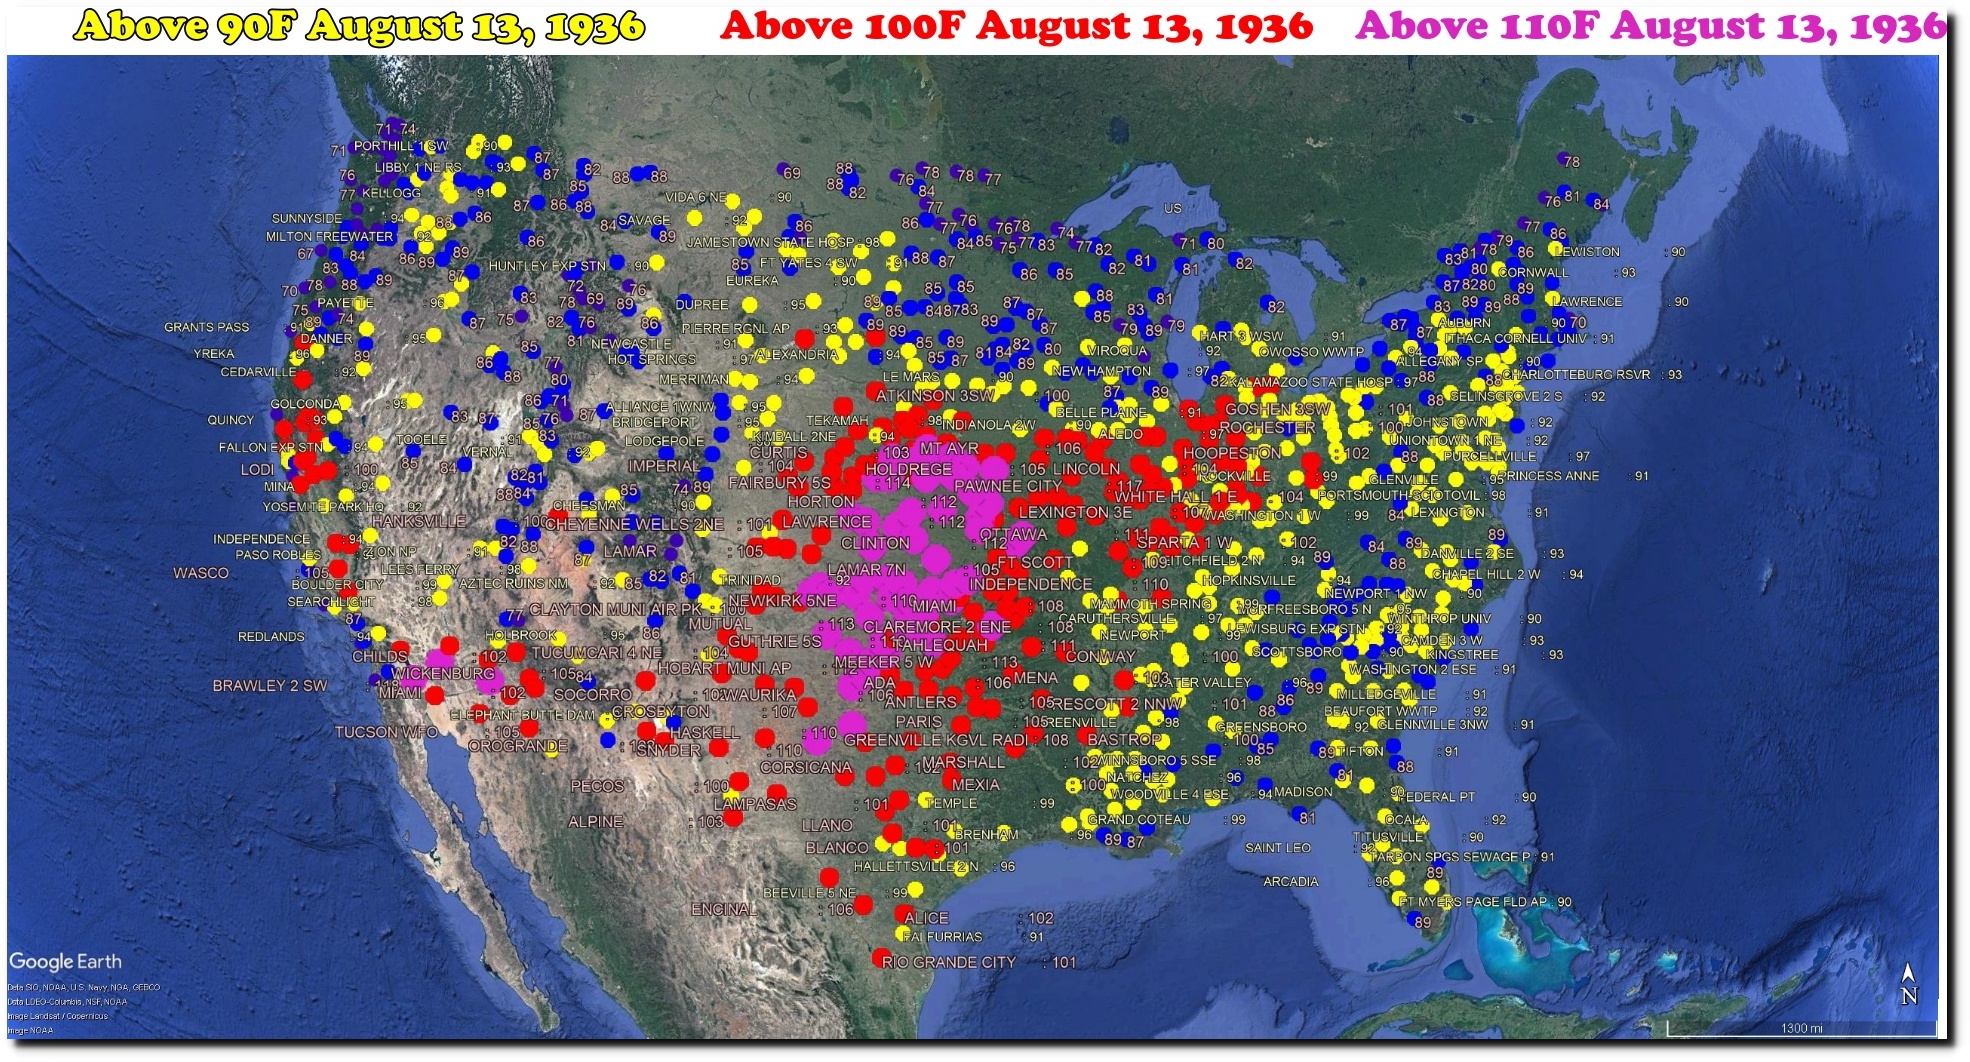
Oklahoma        120
Kansas	        119
California	118
Nebraska	117
Arizona	        115
Texas	        114
Missouri	112
Iowa	        109
Arkansas	107
South Dakota	107
Illinois	106
Colorado	105
Indiana	        105
New Mexico	105
Louisiana	104
Kentucky	101
Mississippi	101
Ohio	        101
Michigan	100
Tennessee	100
Utah	        100
Nevada	        99
New York	99
North Dakota	98
Virginia	97
Florida	        96
Idaho	        96
Oregon	        96
South Carolina	96
Montana	        95
Pennsylvania	95
West Virginia	95
Georgia	        94
New Jersey	94
North Carolina	94
Washington	94
Maryland	93
Vermont	        93
Wyoming	        93
Alabama	        92
Delaware	92
Wisconsin	92
Connecticut	90
Maine	        90
Massachusetts	90
Minnesota	89
New Hampshire	89
Rhode Island	86