
Disrupting the Borg is expensive and time consuming!

Google Search
-
Recent Posts
- Is Antarctica Melting?
- High Speed Analysis And Visualization
- El Nino To The Rescue?
- Fake News Update
- Growth Of Antarctic Sea Ice
- 65 Years Of Progress!
- El Nino To The Rescue?
- Worst March Drought On Record
- ChartGL Process Control Demo
- The Biggest Money Laundering Scam
- Drought In The Headwaters Of Lake Powell
- Unrealistic Expectations Of Water Availability
- Did Bill Gates Do This?
- Worst March Drought On Record In The US
- The Real Hockey Stick Graph
- Analyzing The Western Water Crisis
- Gaslighting 1924
- “Why Do You Resist?”
- Climate Attribution Model
- Fact Checking NASA
- Fact Checking Grok
- Fact Checking The New York Times
- New Visitech Features
- Ice-Free Arctic By 2014
- Debt-Free US Treasury Forecast
Recent Comments
- Bob G on Is Antarctica Melting?
- Bob G on Is Antarctica Melting?
- Peter Carroll on Is Antarctica Melting?
- Bob G on Is Antarctica Melting?
- conrad ziefle on Is Antarctica Melting?
- Gordon Vigurs on Is Antarctica Melting?
- Bob G on Is Antarctica Melting?
- conrad ziefle on High Speed Analysis And Visualization
- Bob G on 65 Years Of Progress!
- Bob G on 65 Years Of Progress!
Election Hacking
Posted in Uncategorized
Leave a comment
Kingman, Kansas Has Had An Obvious Cooling Trend Since 1908!
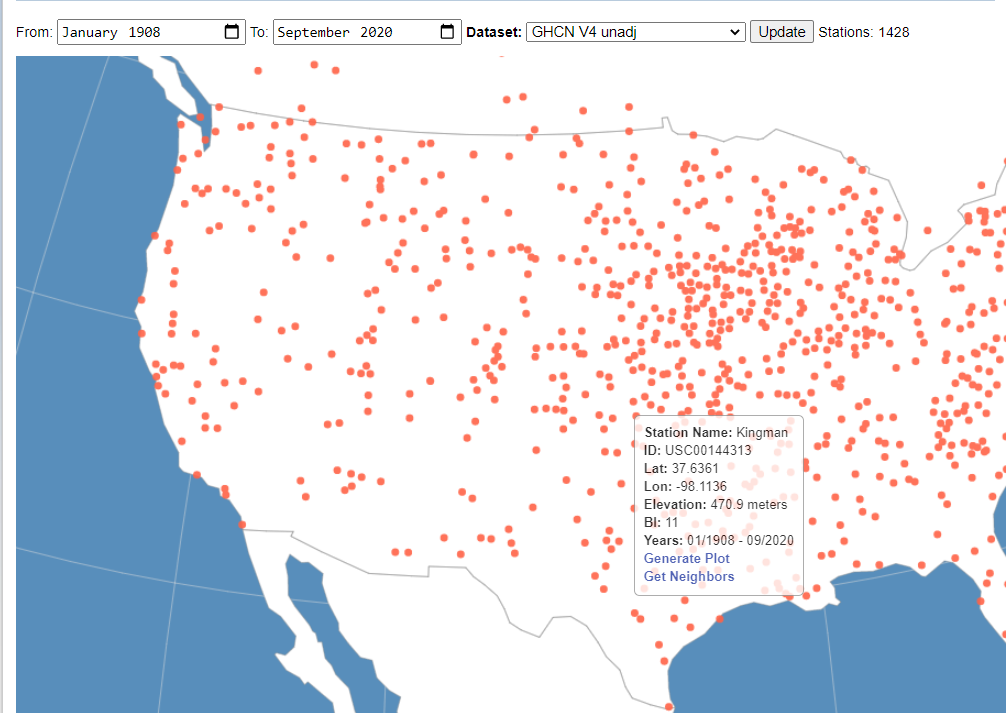
Hi, everyone.
Today, I researched the mean annual temperatures in Kingman, Kansas.
The GHCN V4 Unadjusted data from NASA website show an obvious cooling trend since 1908.
However, the GHCN V4 adj – homogenized data show that the Kingman station doesn’t have any annual temperature data from 1908 to 1952, and the station has had a warming trend.

Why do NASA do such ridiculous things?

As is well known to many people, NASA likes changing their temperature data.
Posted in Uncategorized
Leave a comment