“There are lies., damned lies, and statistics”
– Mark Twain
“It will be remembered as the greatest mass delusion in the history of the world – that CO2, the life of plants, was considered for a time to be a deadly poison.”
– Richard Lindzen, Professor Emeritus, Earth Sciences, M.I.T
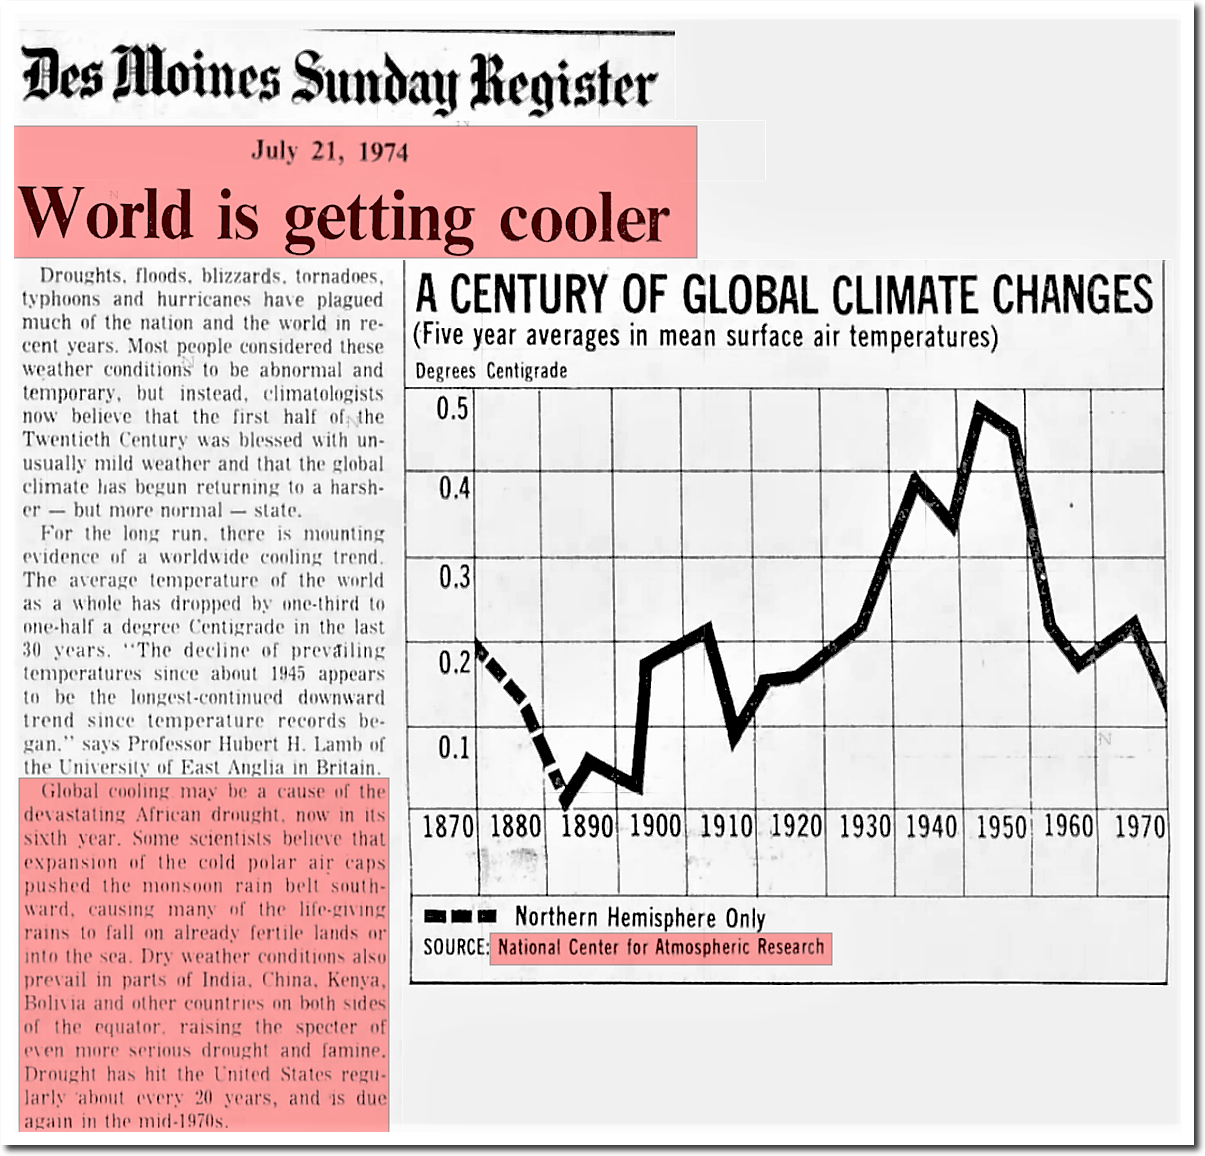
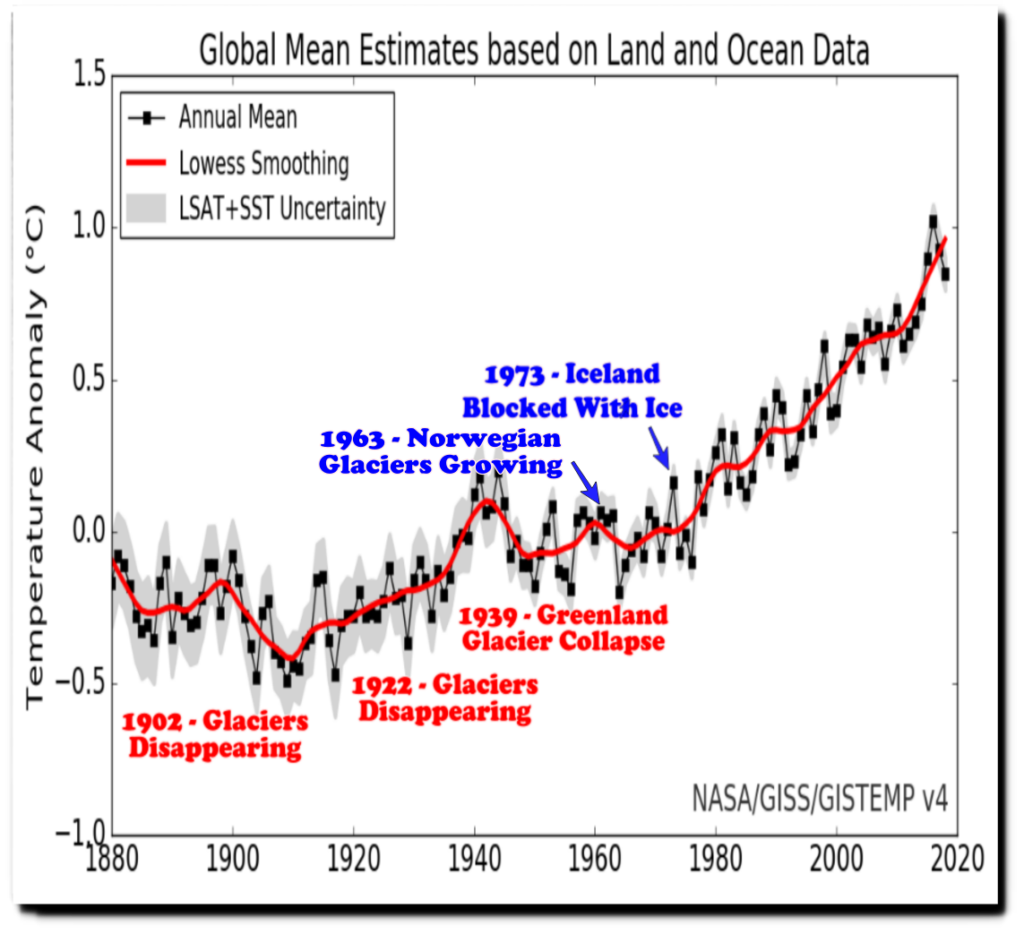
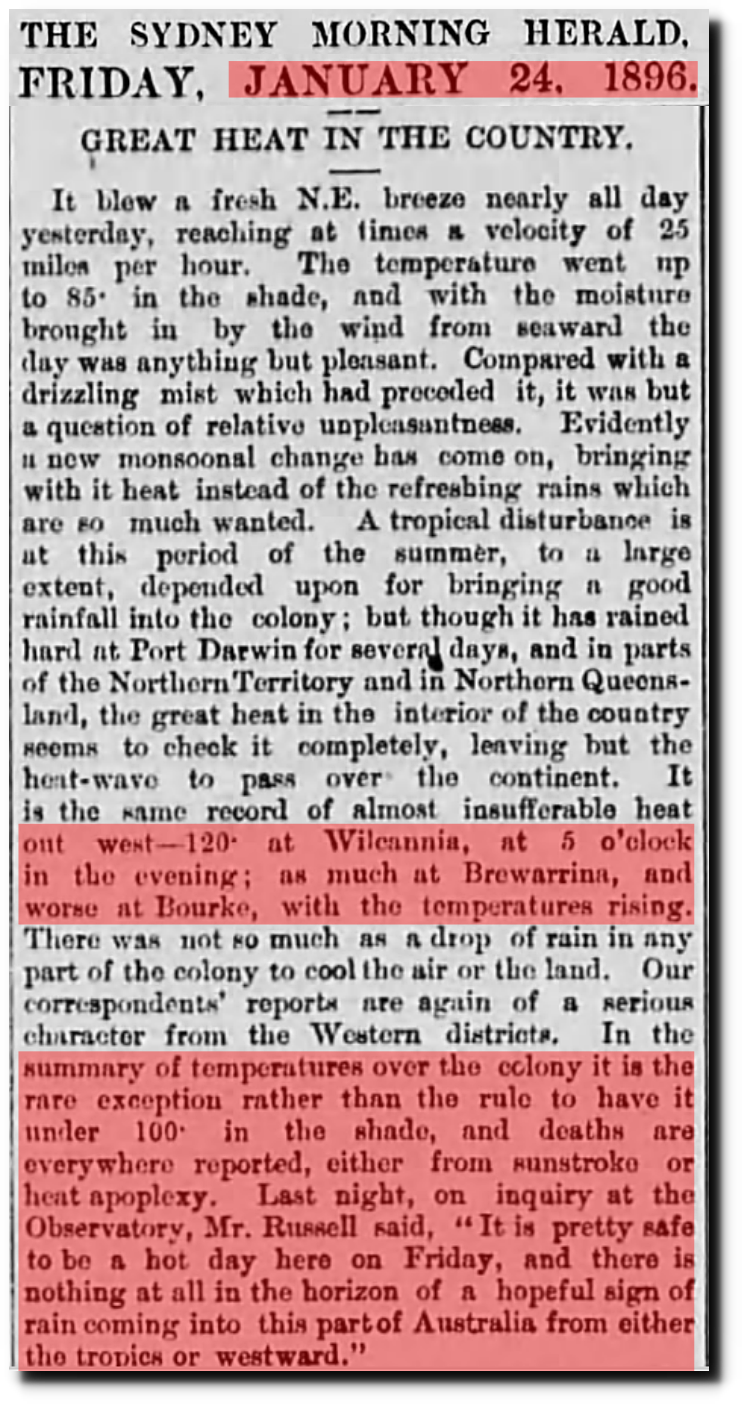
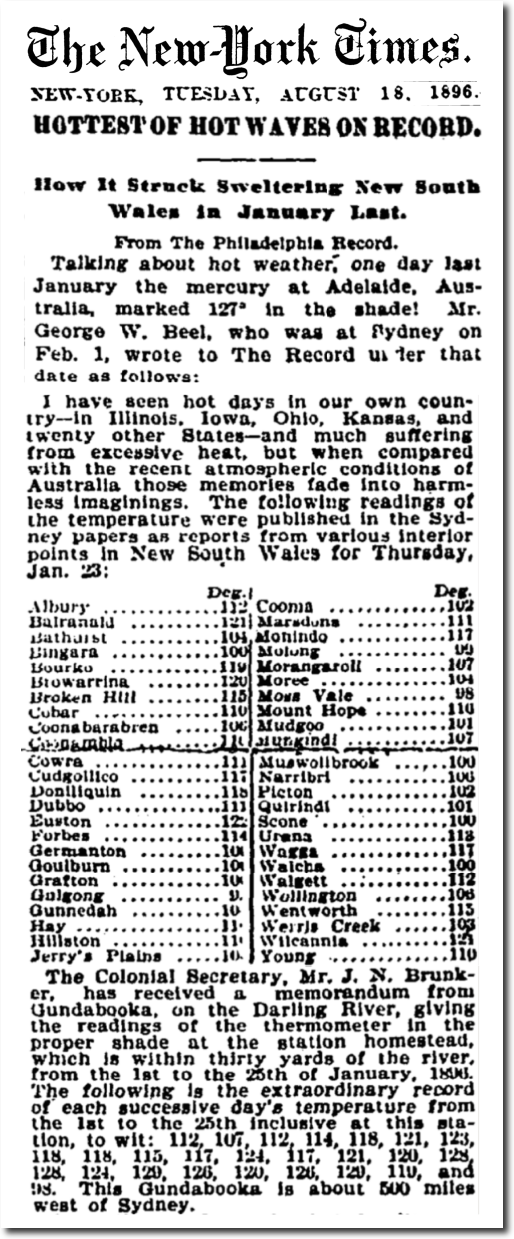
In 1974, there was unanimous consensus among scientists that earth had been cooling since the 1940s.
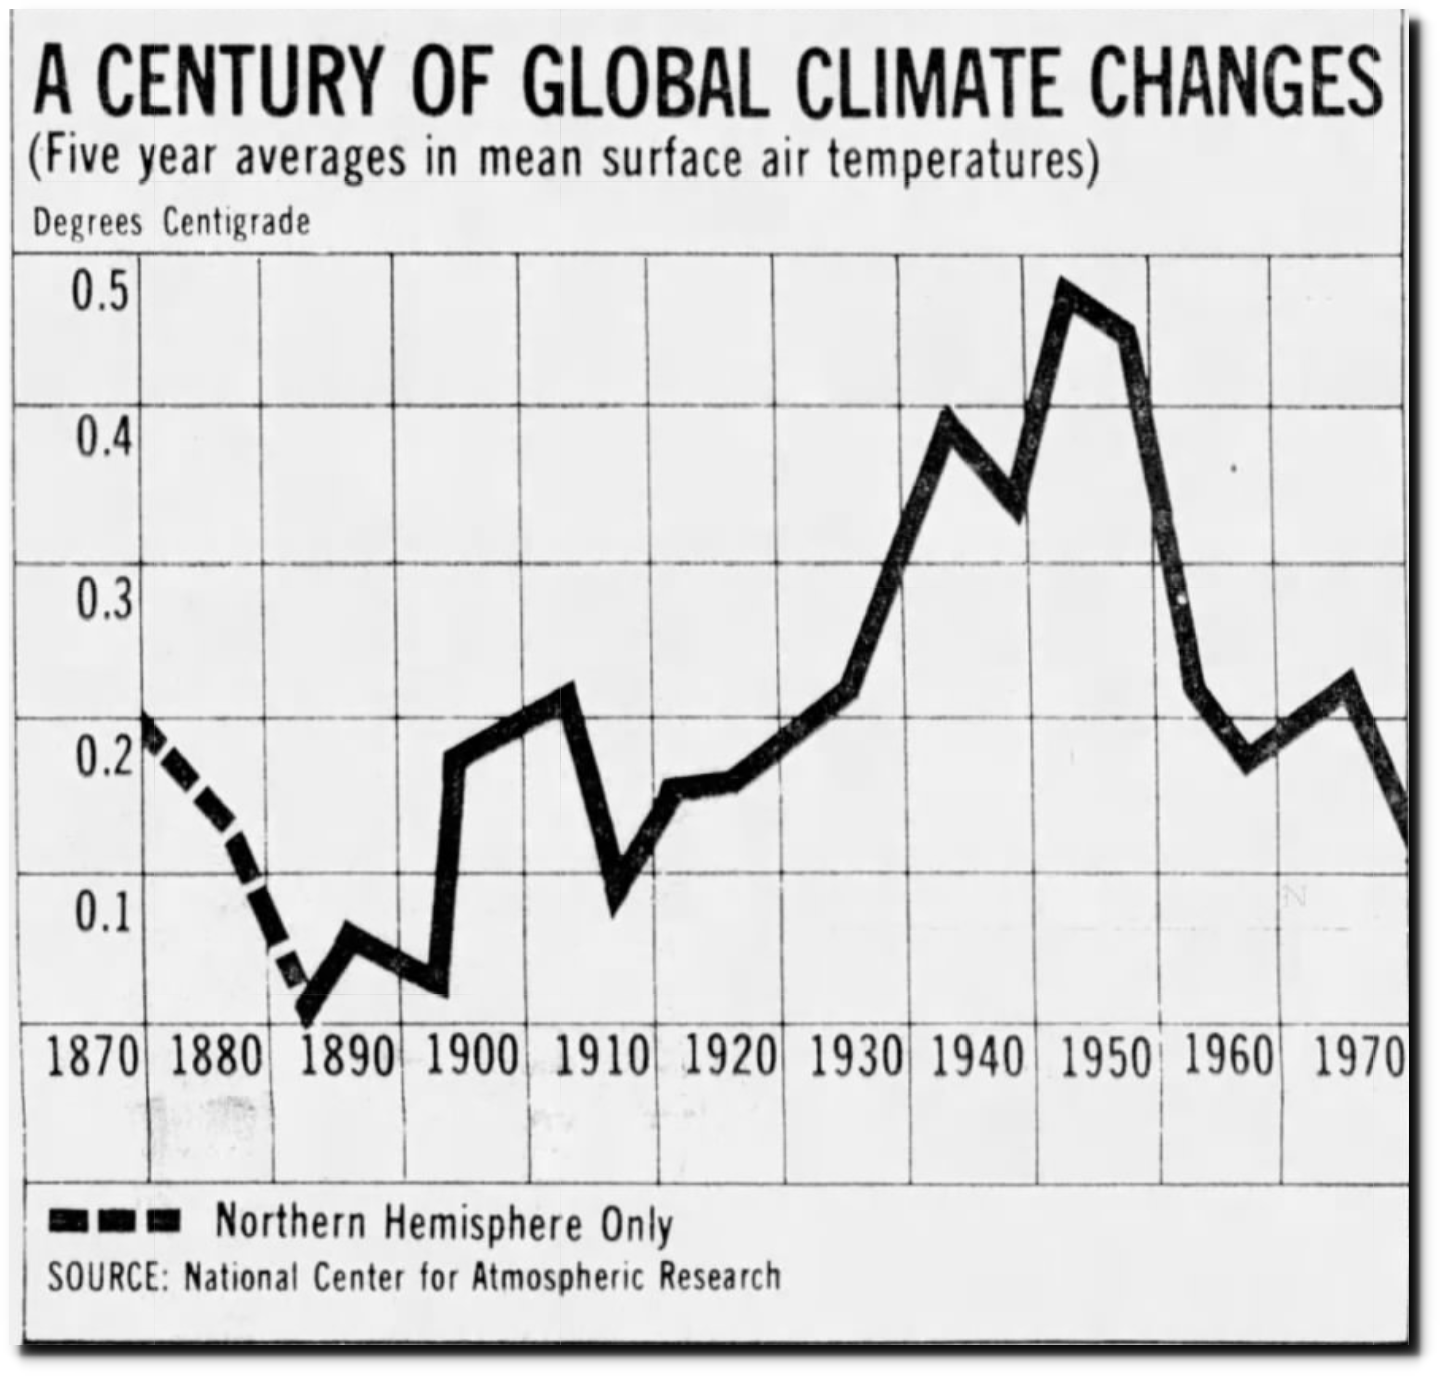
21 Jul 1974, 13 – The Des Moines Register at Newspapers.com
National Academy Of Sciences

January 30, 1961 – NYTimes
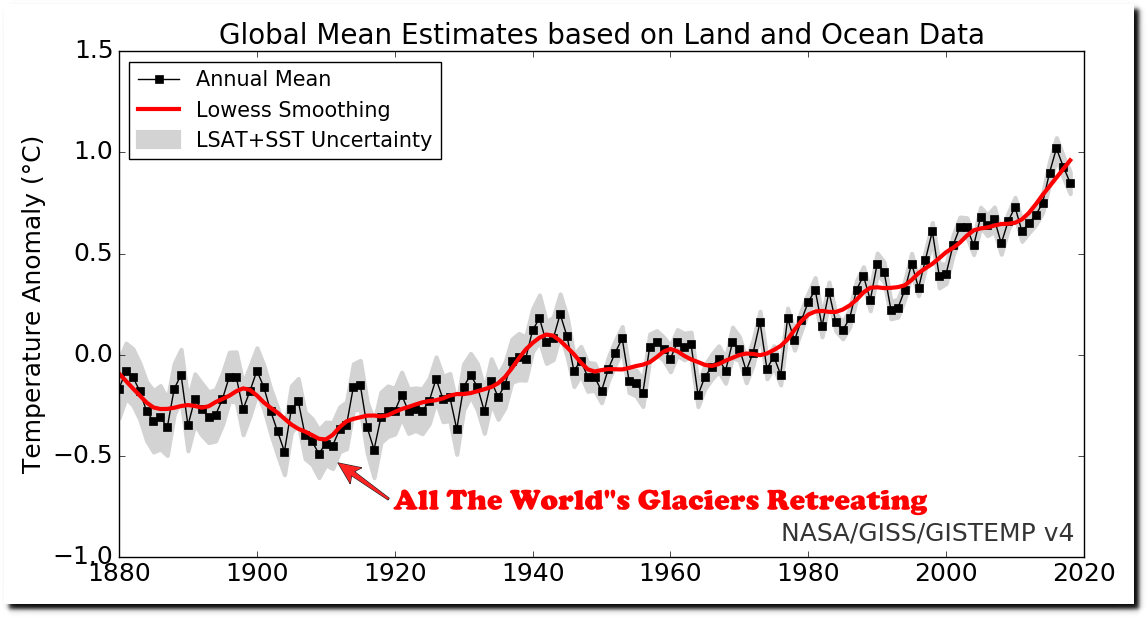
Fast forward forty-five years. A small group of people, many of whom who were not alive in 1974, have determined they know more about the weather in 1974 than the scientists who lived through it and studied it at the time.
graph.png (1130×600)
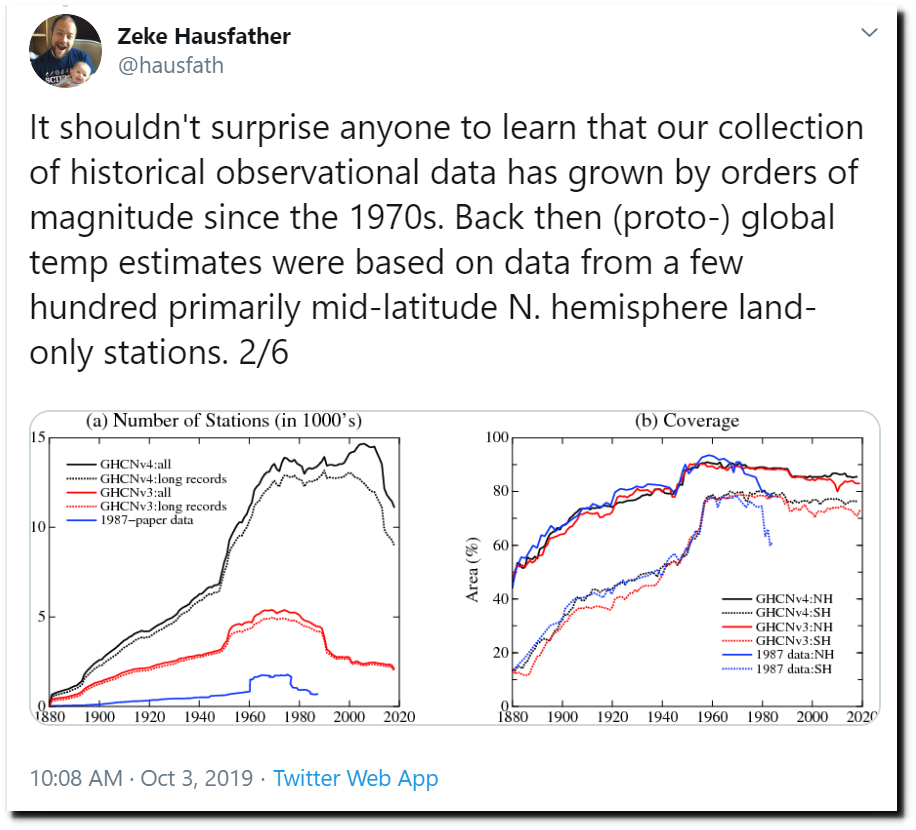
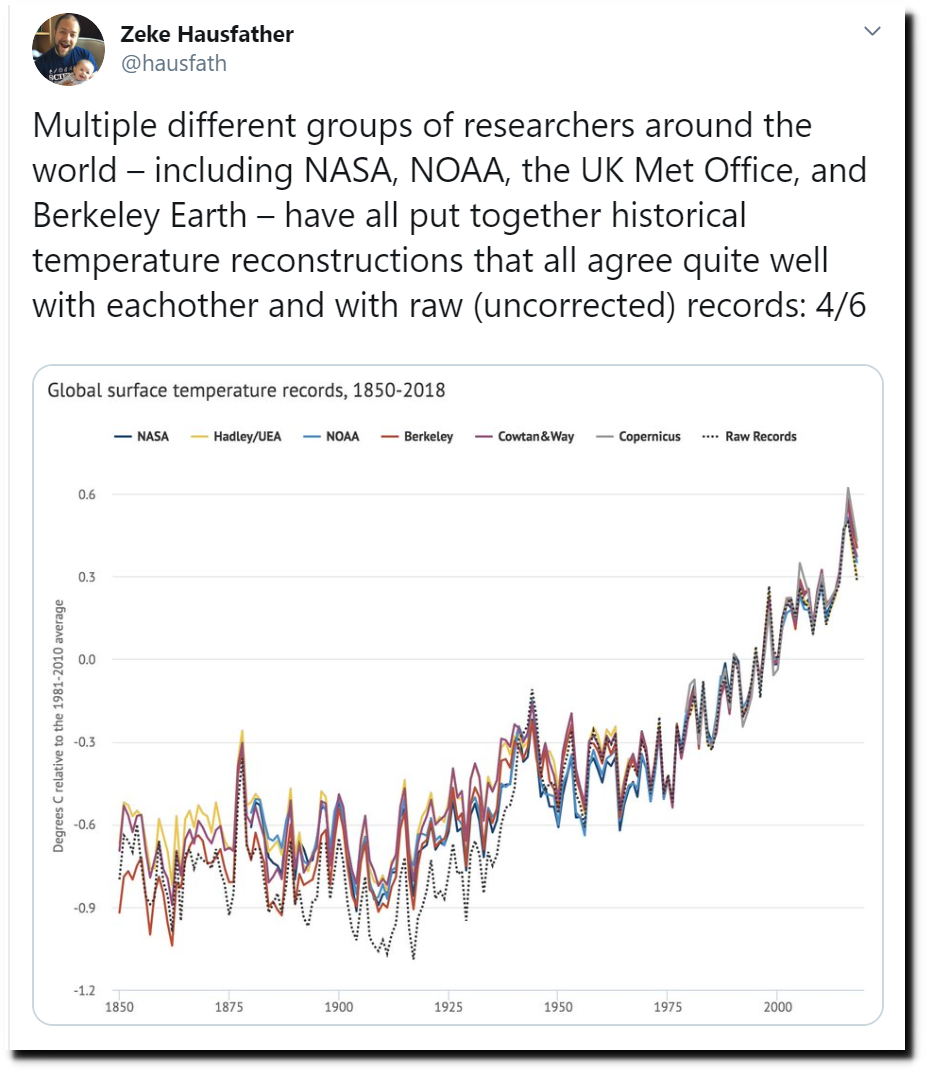
Zeke Hausfather, who openly brags about being a left-wing activist, is one of those people. He believes that adding tens of thousands of very low quality fragmented records into the database, has improved the quality of the temperature record.
It is simple enough to test out which version of the pre-1980 temperature record is better. The version made by the people who lived through it, or the younger people now who are paid to generate graphs which show a lot of warming. We can compare the two versions vs. historical accounts of ice and other observations.
It’s amazing how many people even today use a computer to do something you can do with a pencil and paper in less time.
– Richard P. Feynman
“Have no respect whatsoever for authority; forget who said it and instead look what he starts with, where he ends up, and ask yourself, “Is it reasonable?”
– Richard P. Feynman
“The test of all knowledge is experiment. Experiment is the sole judge of scientific truth.”
– Richard P. Feynman
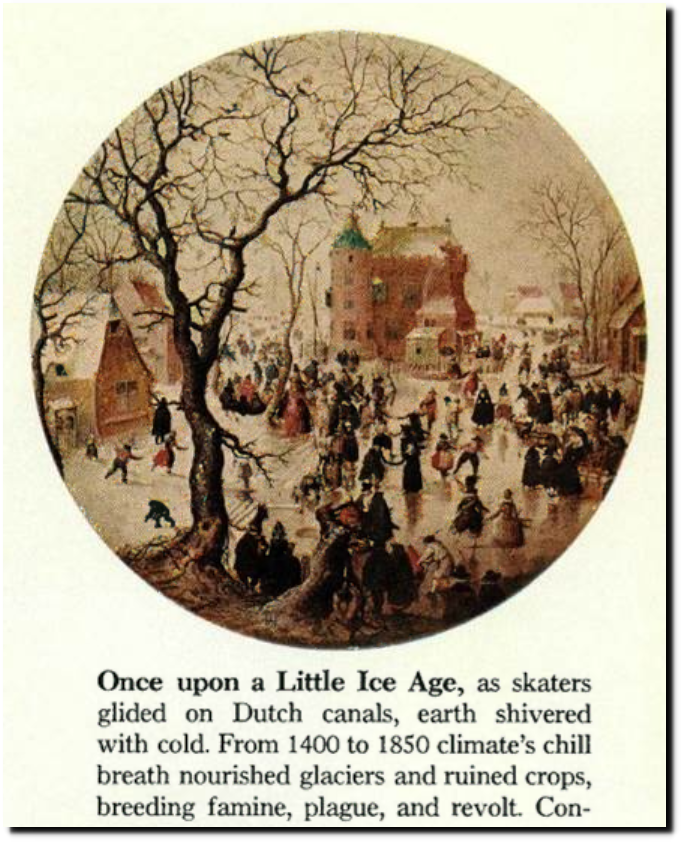
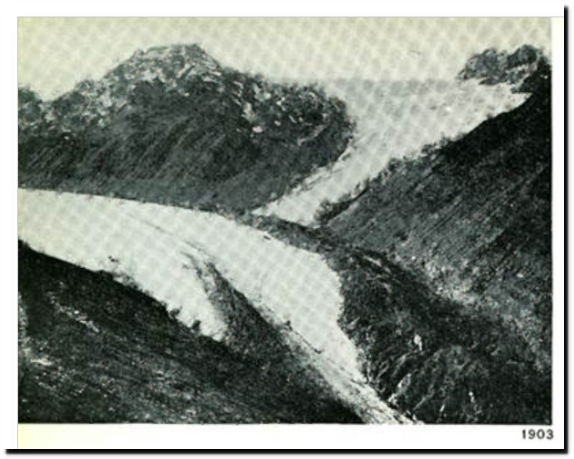
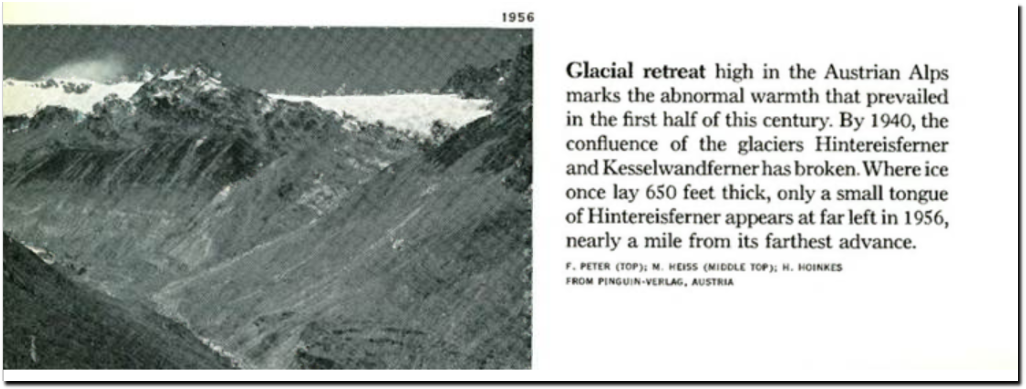
Glaciers and sea ice were rapidly shrinking during the first half of the 20th century.

16 Aug 1902 – Alpine Glaciers Disappearing. – Trove
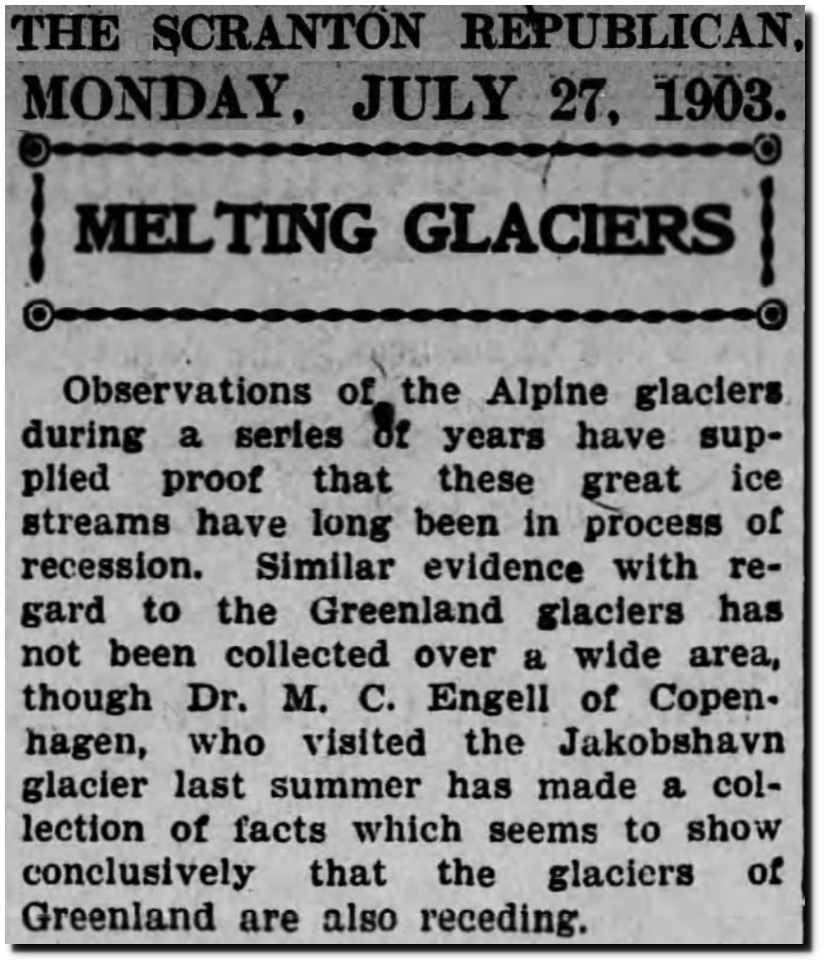
27 Jul 1903, Page 4 – The Tribune at Newspapers.com
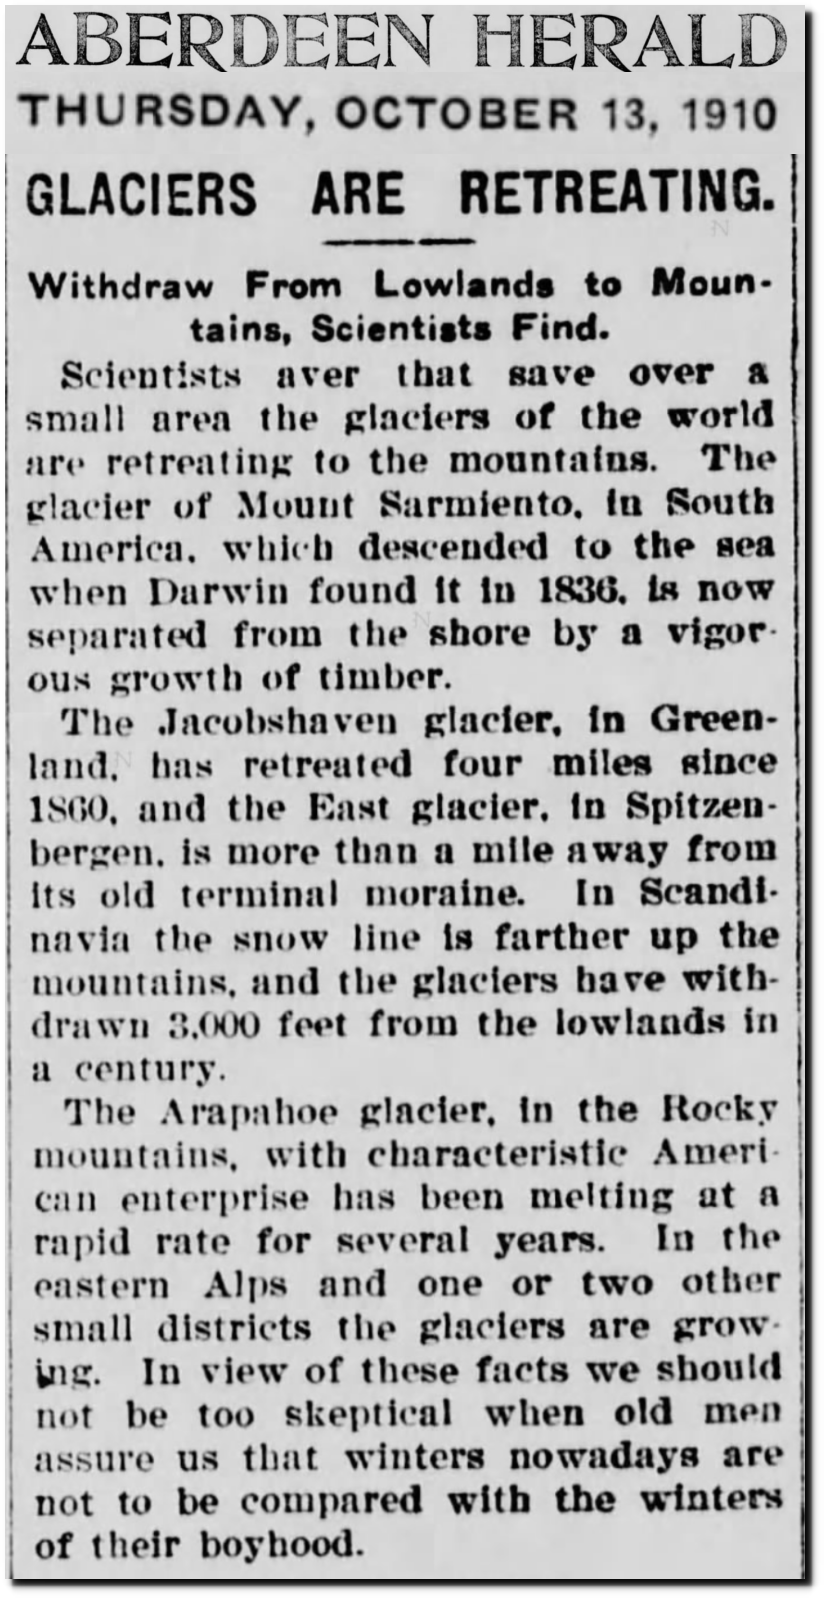
13 Oct 1910, Page 7 – Aberdeen Herald
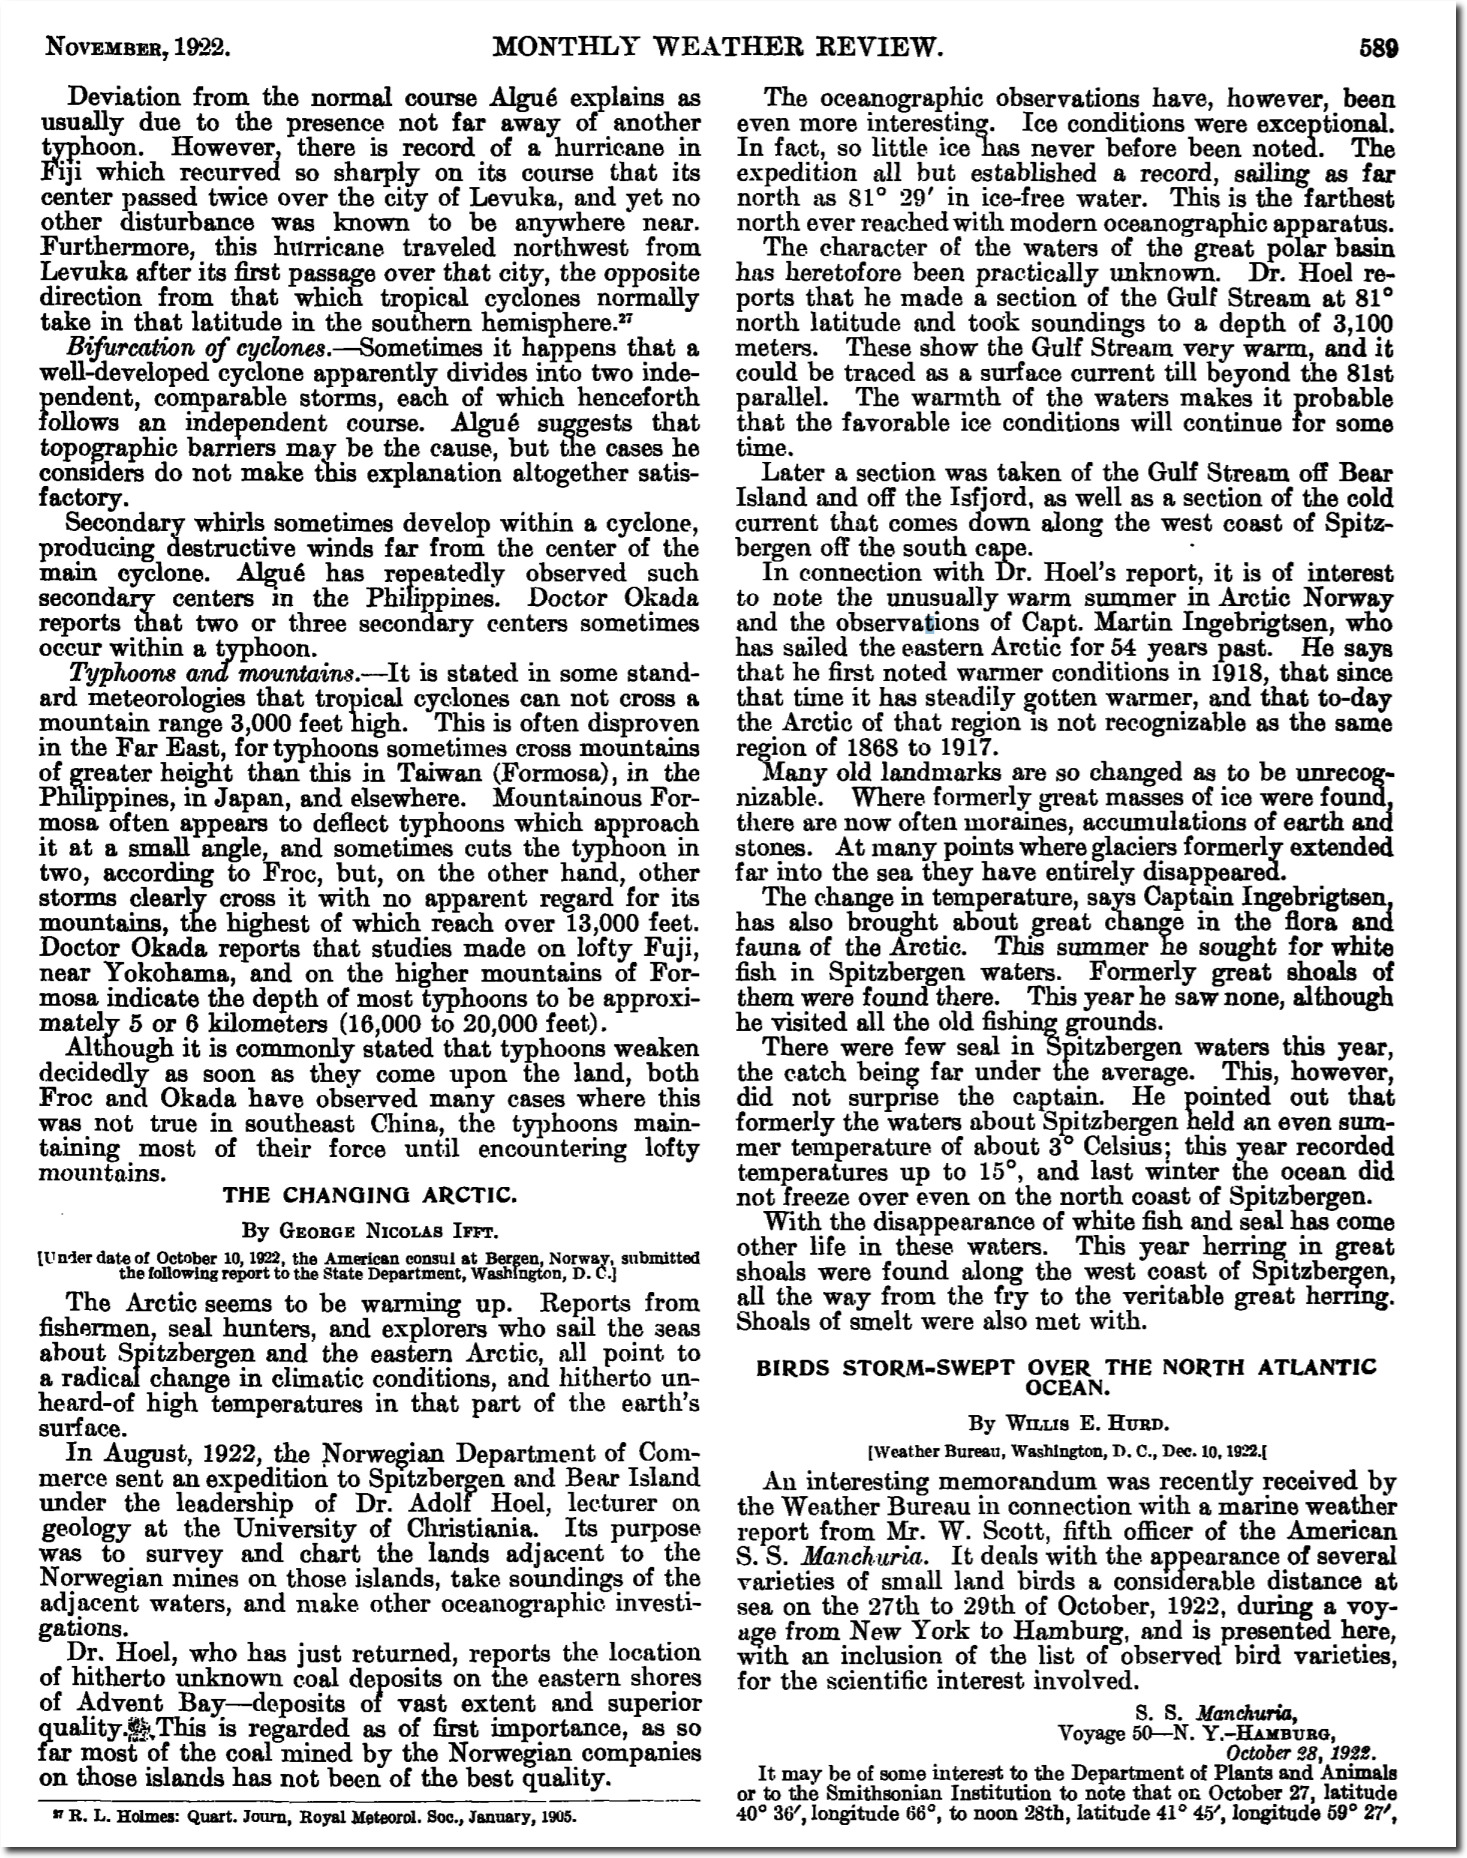
ftp://ftp.library.noaa.gov/docs.lib/htdocs/rescue/mwr/064/mwr-064-02-c1.pdf
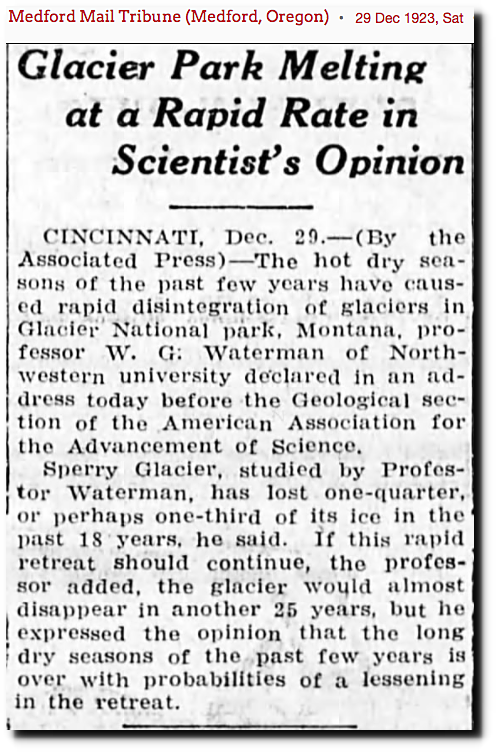
29 Dec 1923, Page 5 – at Newspapers.com
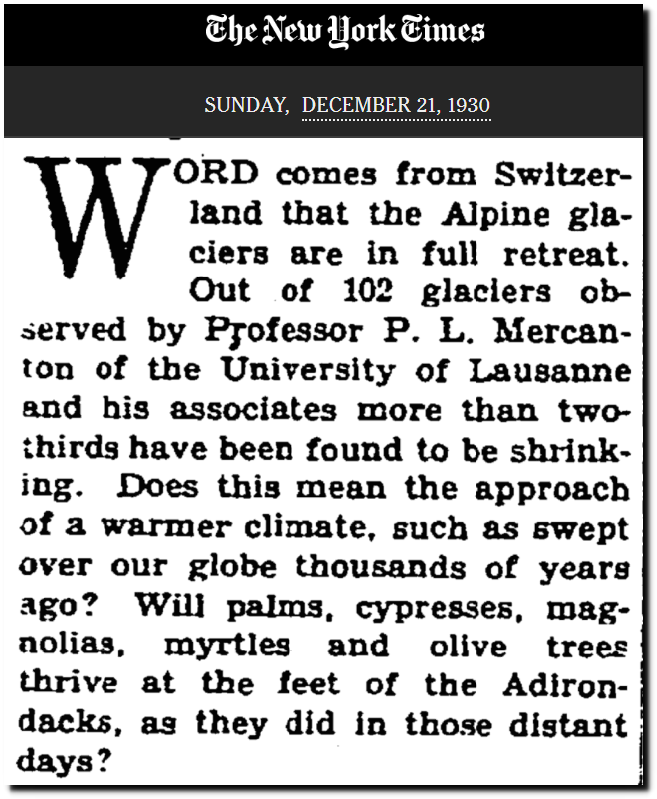
GLACIERS Now in Full Retreat in the Alps, NYTimes.com
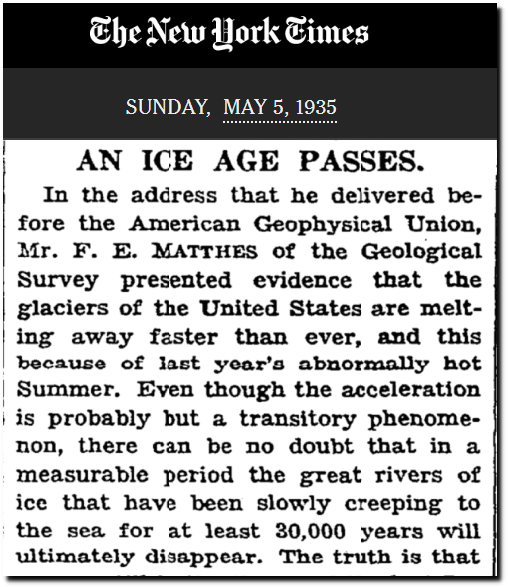
AN ICE AGE PASSES. – Editorial – NYTimes.com
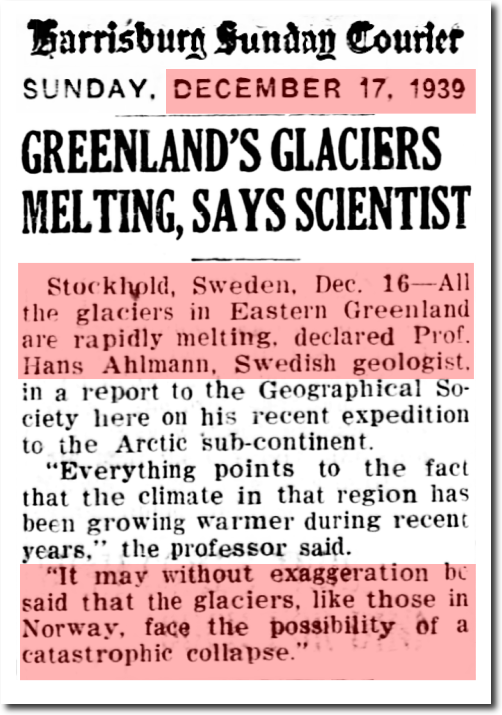
17 Dec 1939, Page 15 – Harrisburg Sunday Courier at Newspapers.com
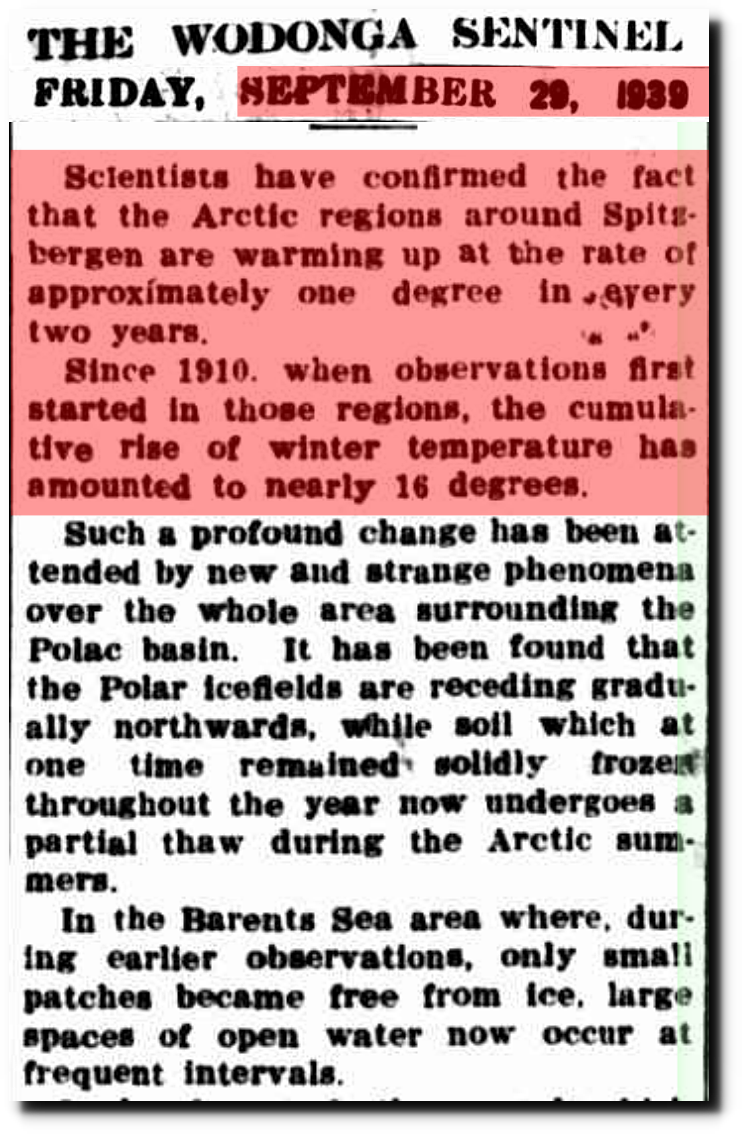
29 Sep 1939 – What is The World Coming To? – Trove

13 Oct 1940, Page 76 – Hartford Courant at Newspapers.com

31 May 1947 – MELTING ICE CAP DANGER – Trove
18 Feb 1952 – Melting Icecaps Mystery – Trove
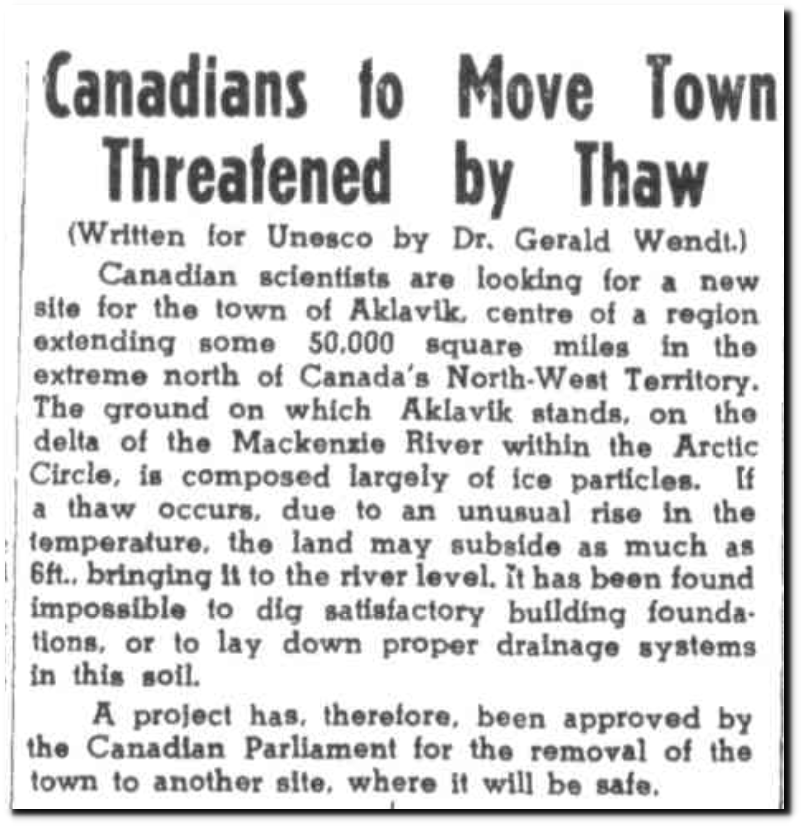
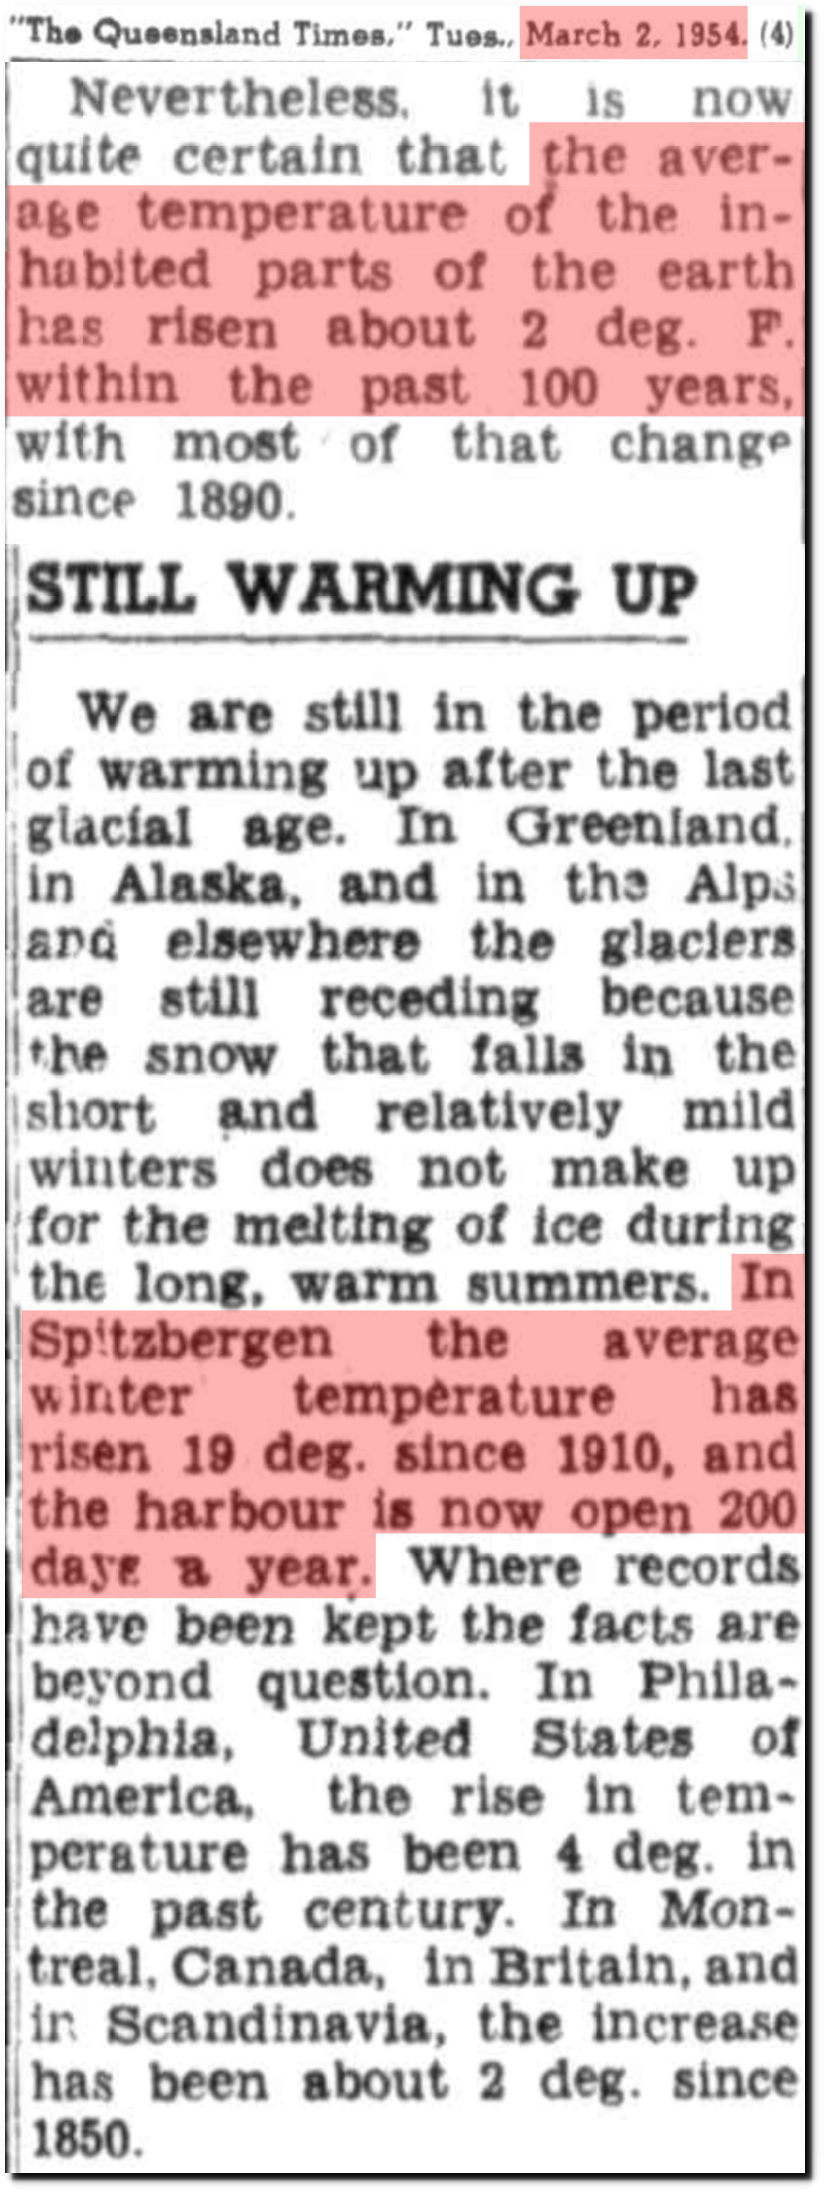
02 Mar 1954 – Canadians to Move Town Threatened by Thaw – Trove

10 Mar 1955, Page 3 – Democrat and Chronicle at Newspapers.com

The Changing Face of the Arctic; The Changing Face of the Arctic – The New York Times
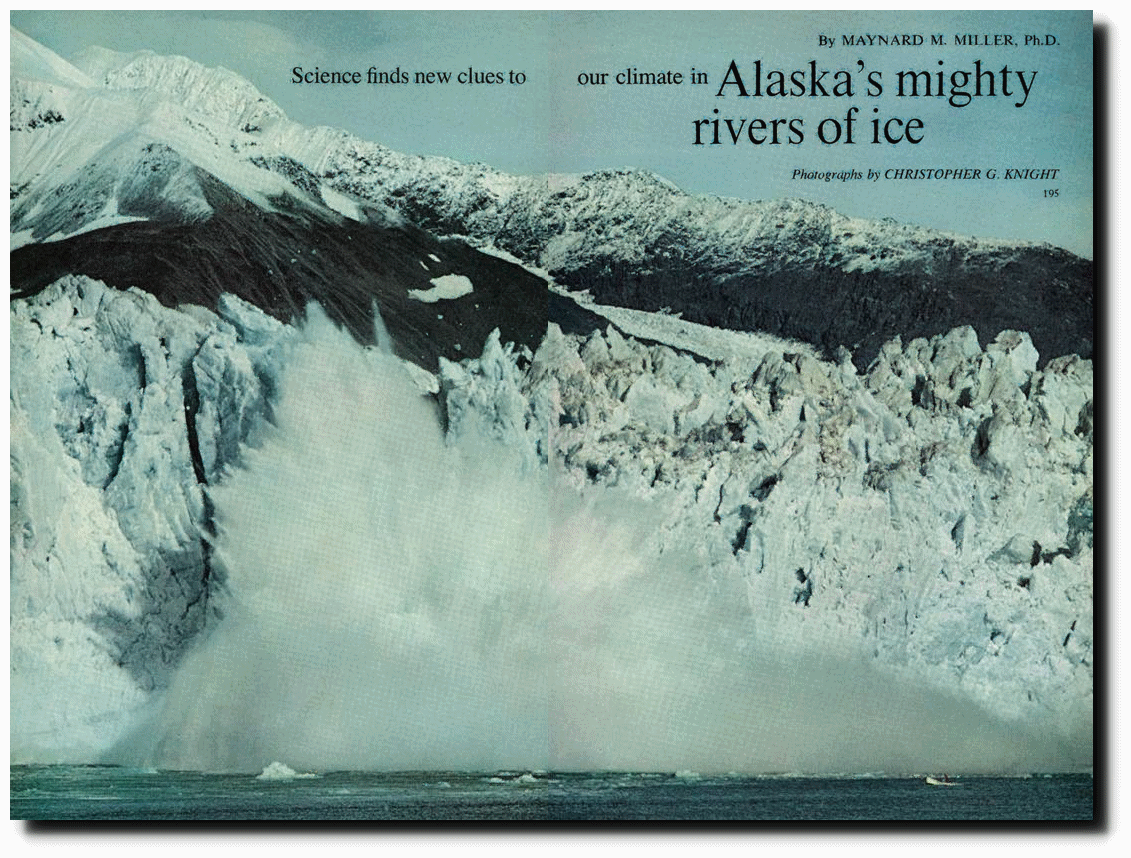
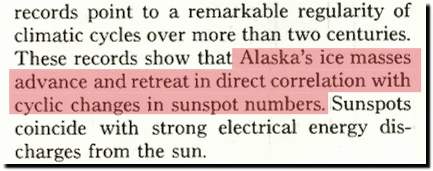
The National Geographic Archive | November 1976 | page 1
But a few years before 1960, things changed. Earth started cooling rapidly, and ice started expanding.
January 30, 1961 – NYTimes
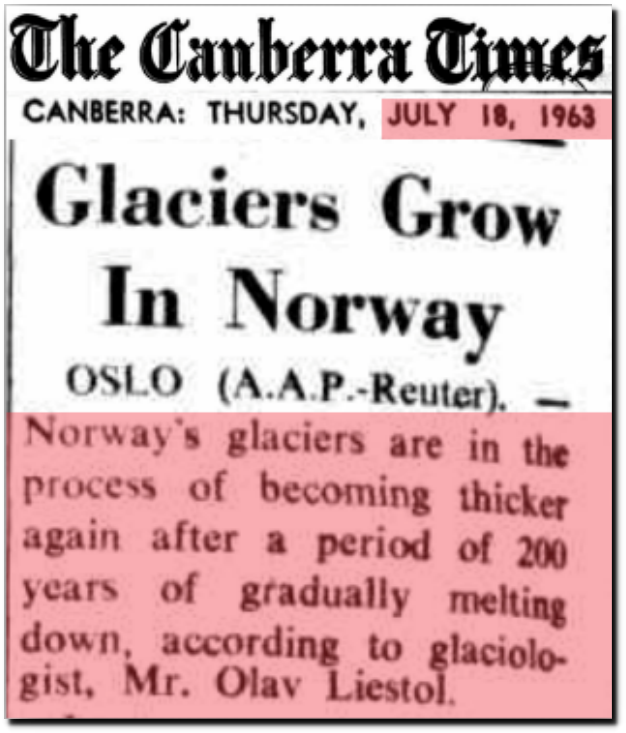
18 Jul 1963 – Glaciers Grow In Norway
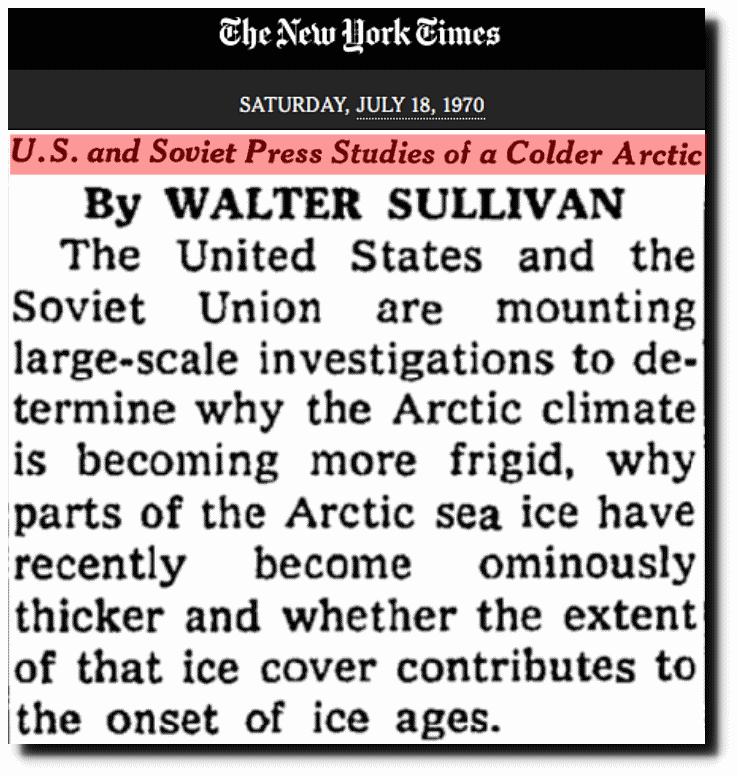
U.S. and Soviet Press Studies of a Colder Arctic – The New York Times
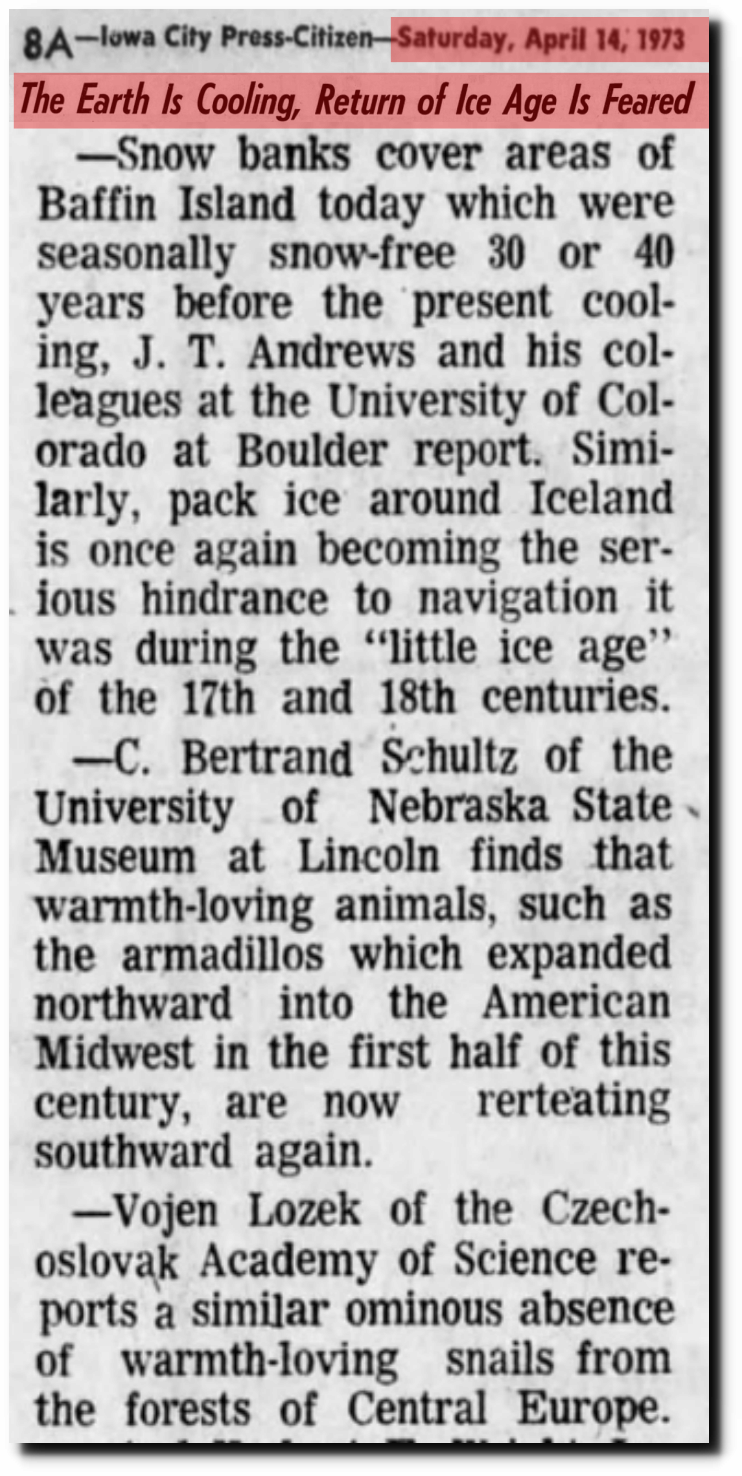
14 Apr 1973, Page 8 – Iowa City Press-Citizen
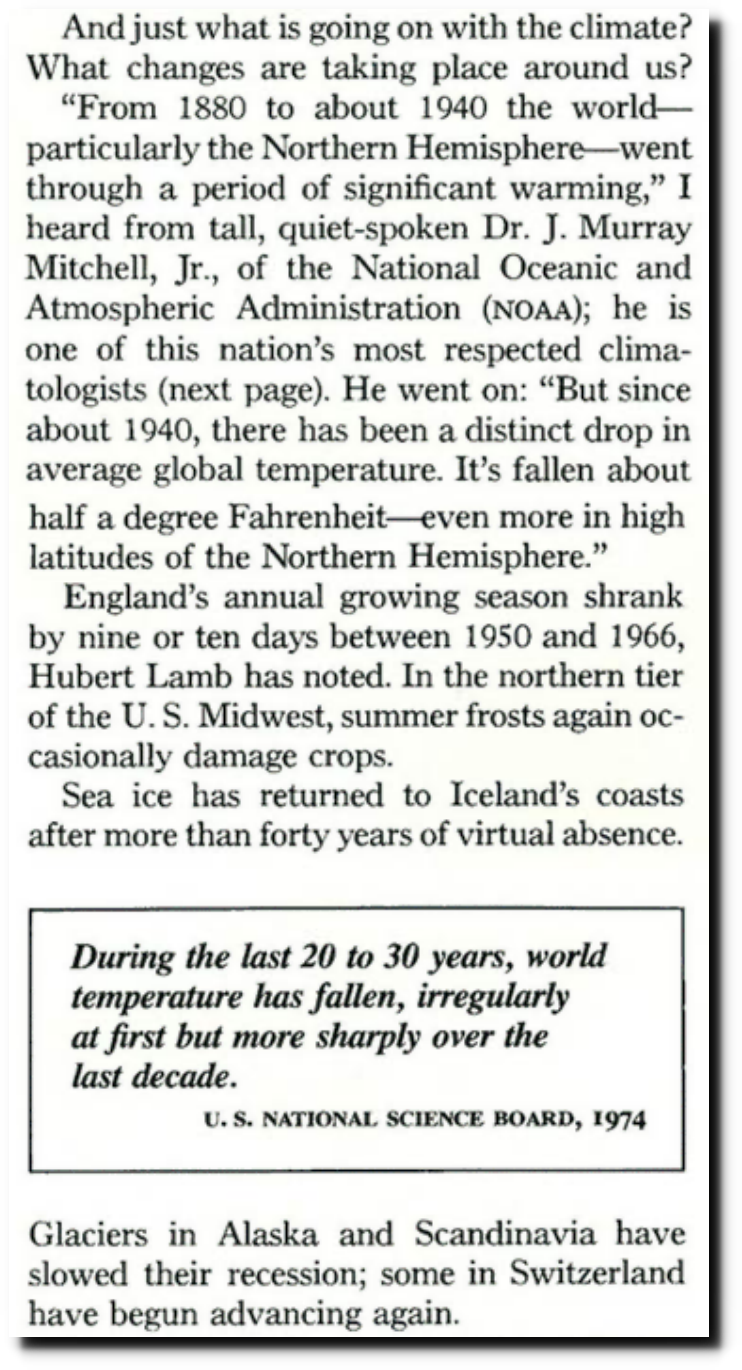
The National Geographic Archive | November 1976 | page 1
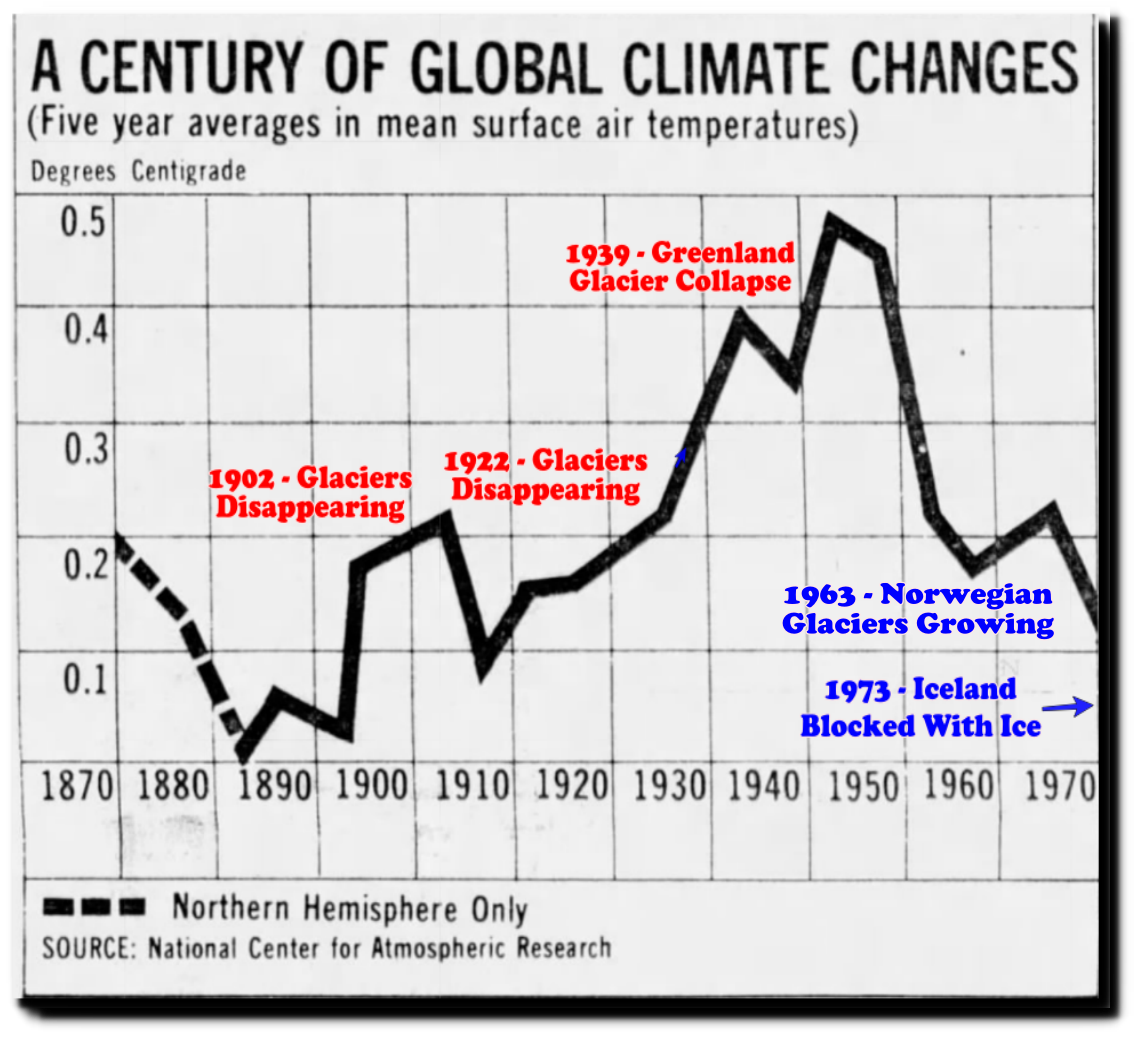
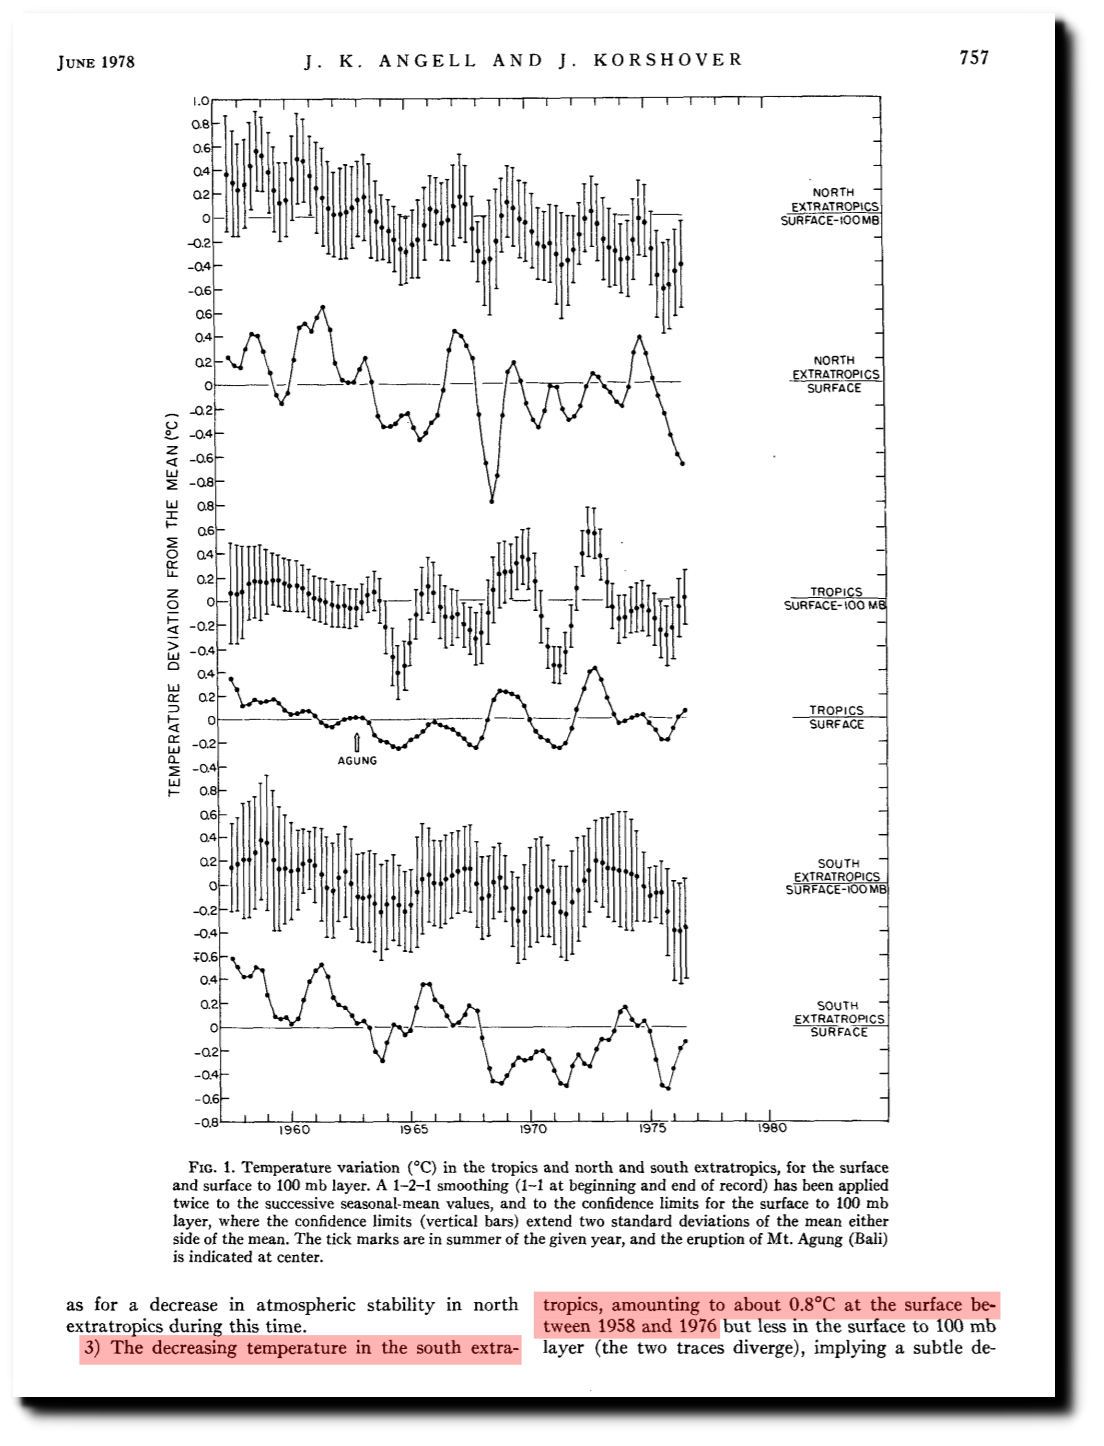
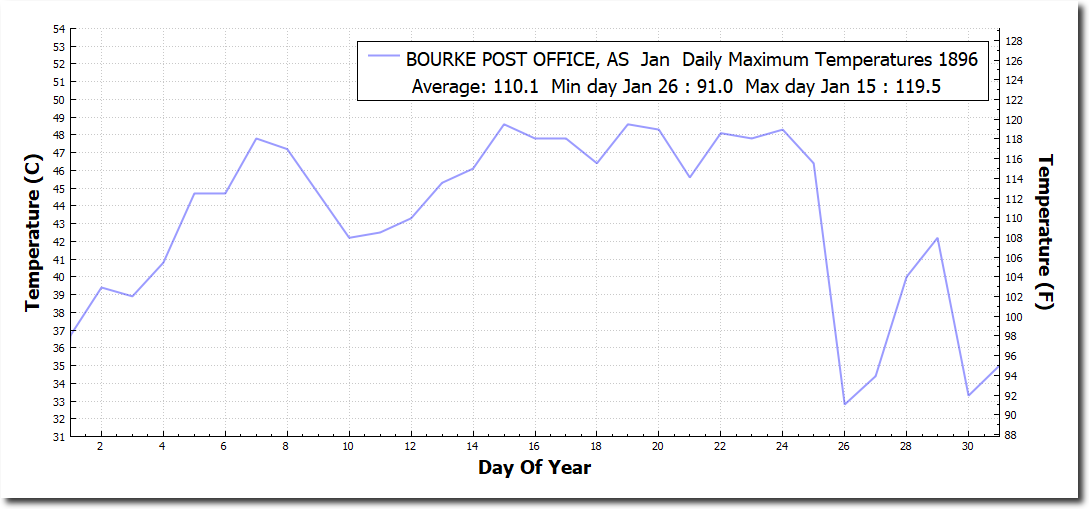
We have a number of historical data points. Let’s plot them on the different graphs and see which make sense. In the 1974 NCAR graph, ice melts at high temperatures, and forms at low temperatures.
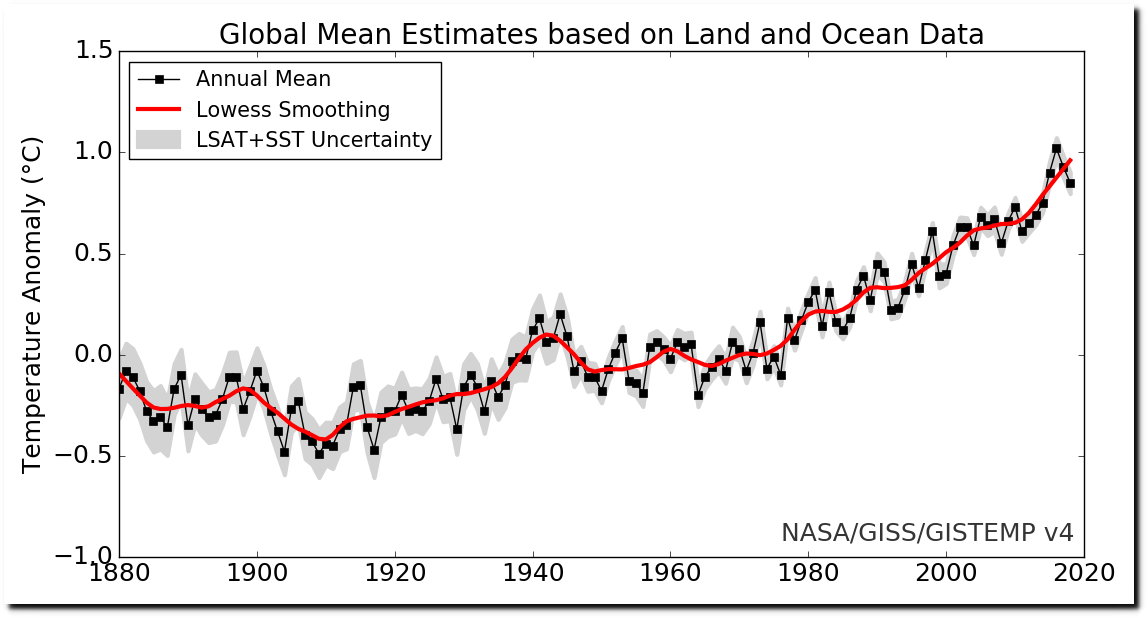
But in the current NASA graph, Ice melts at low temperatures, and forms at high temperatures. This makes no sense and shows us that the graph is bogus.

Climate scientists colluded to make these worthless graphs.

di2.nu/foia/1254108338.txt
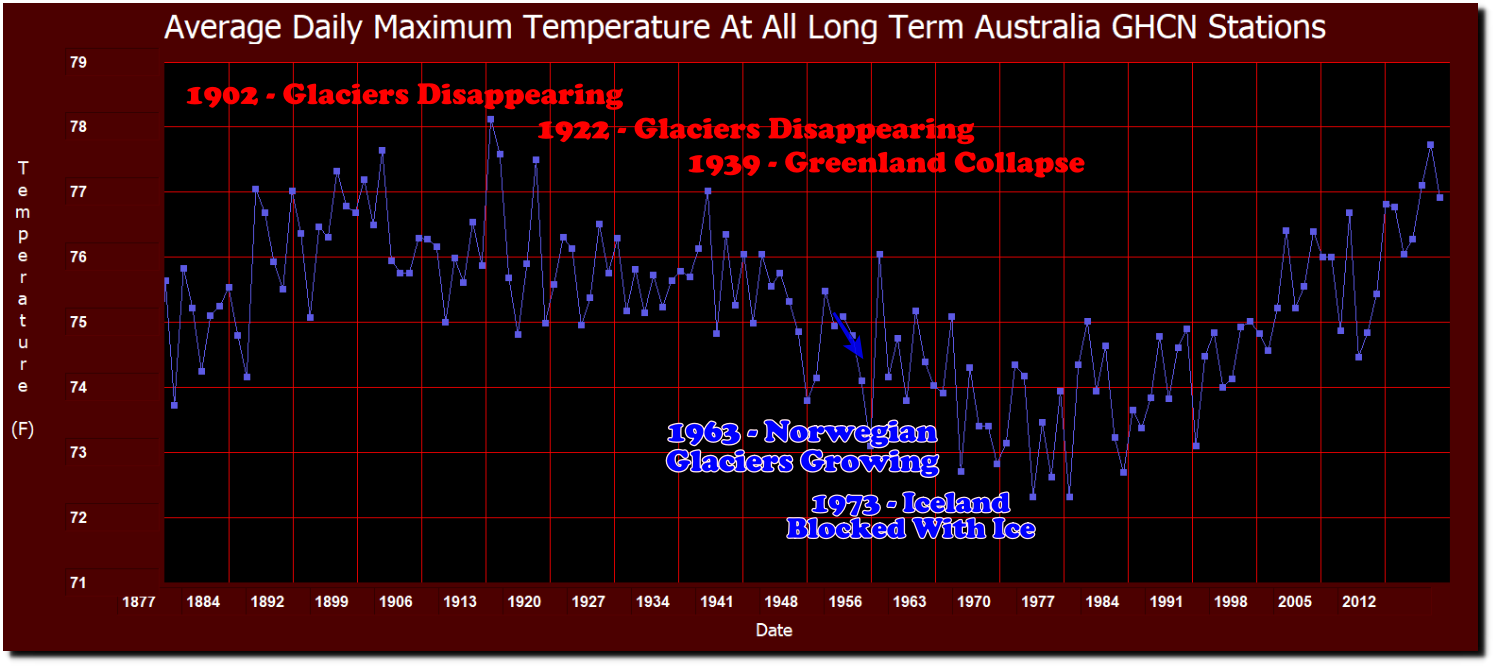
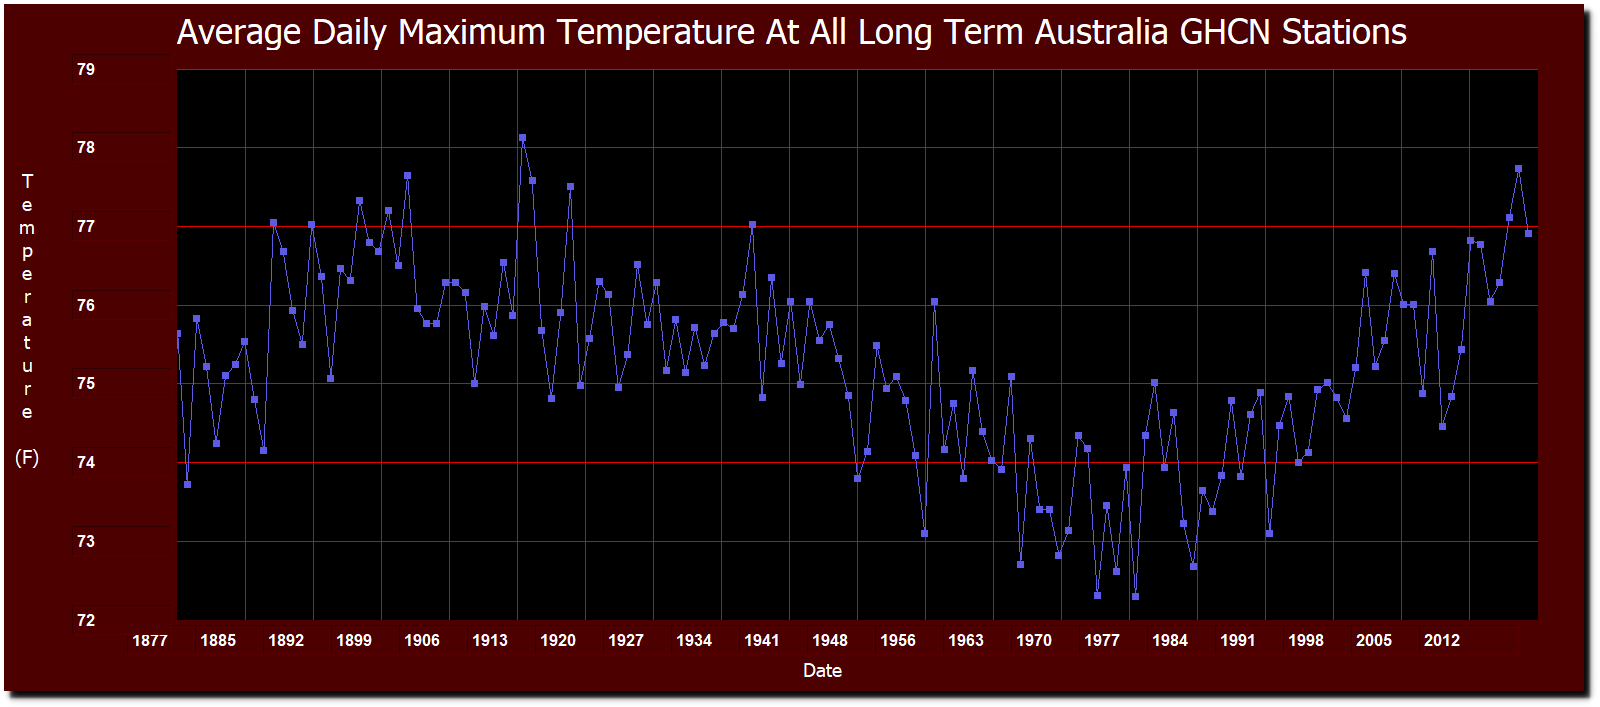
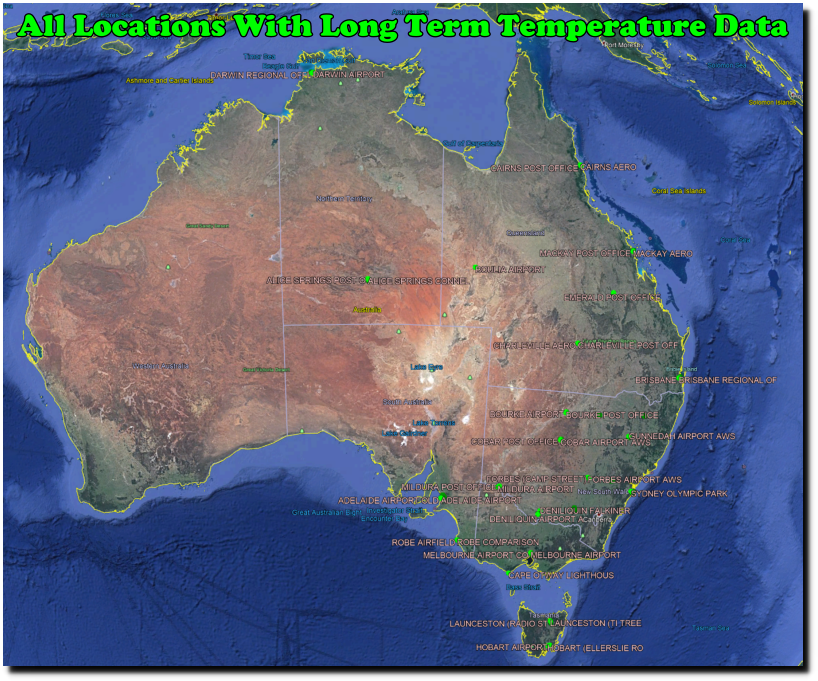
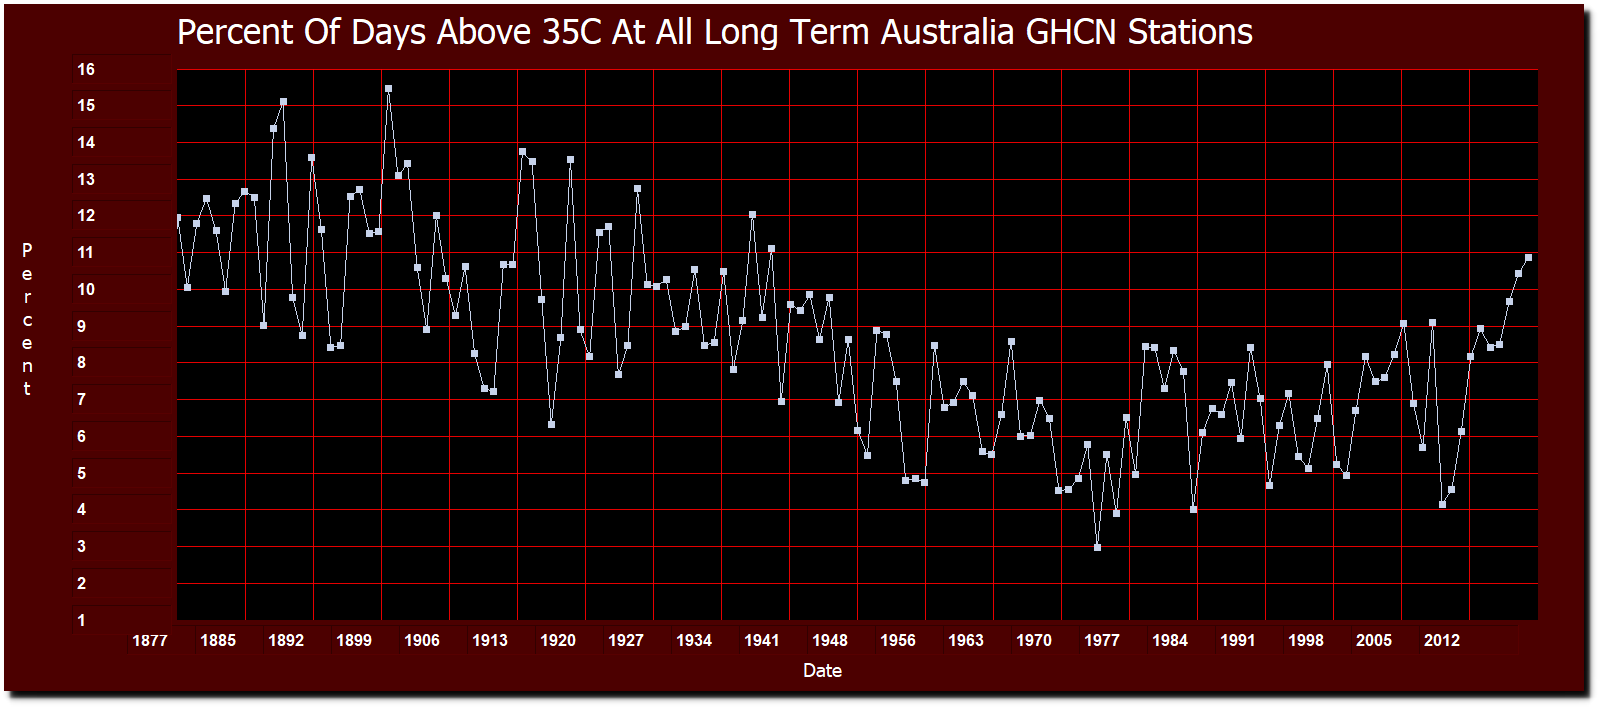
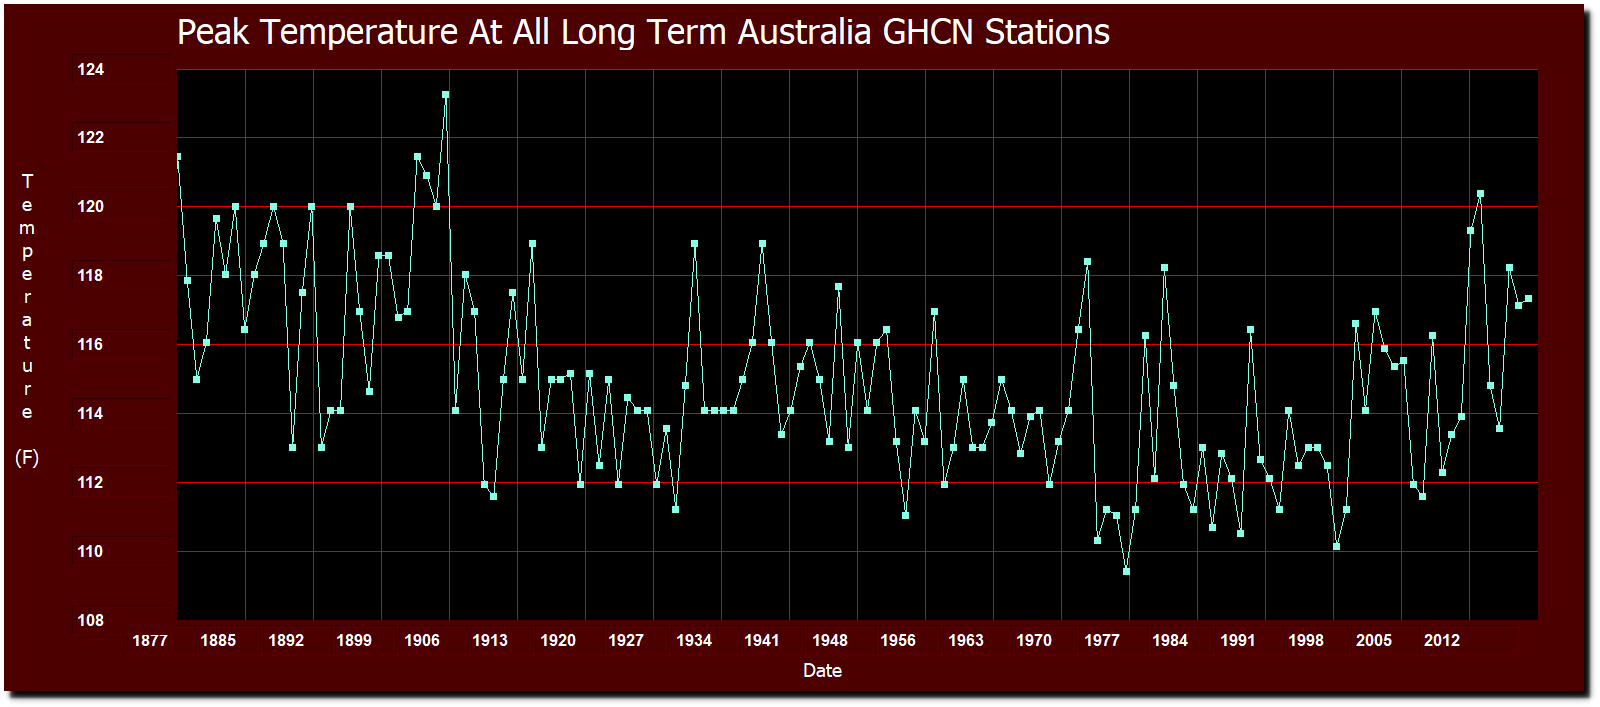
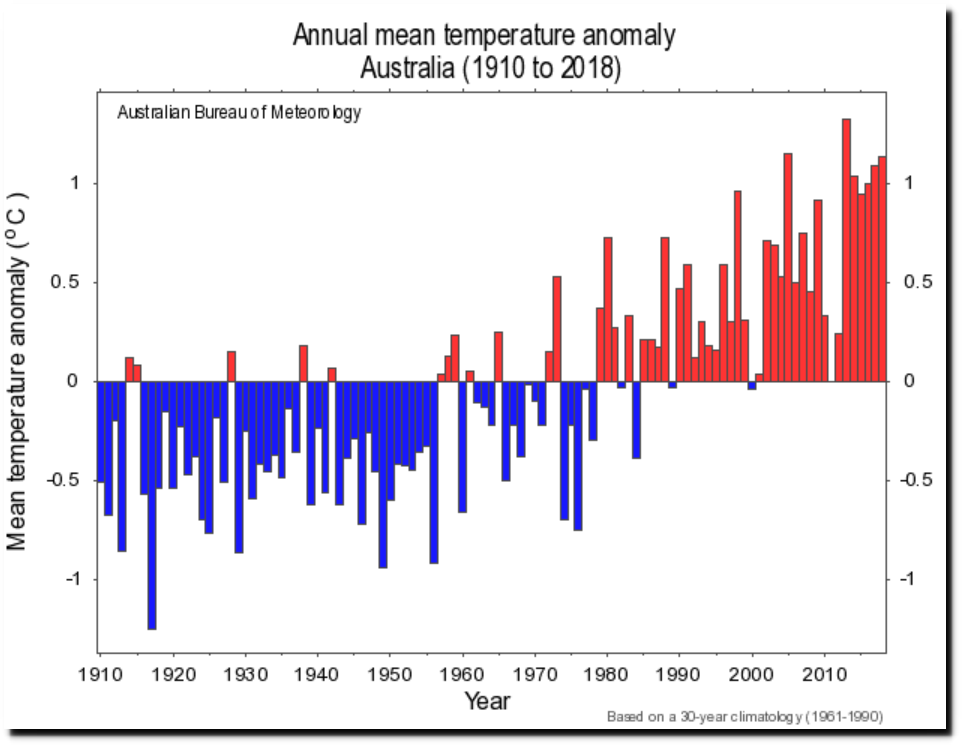
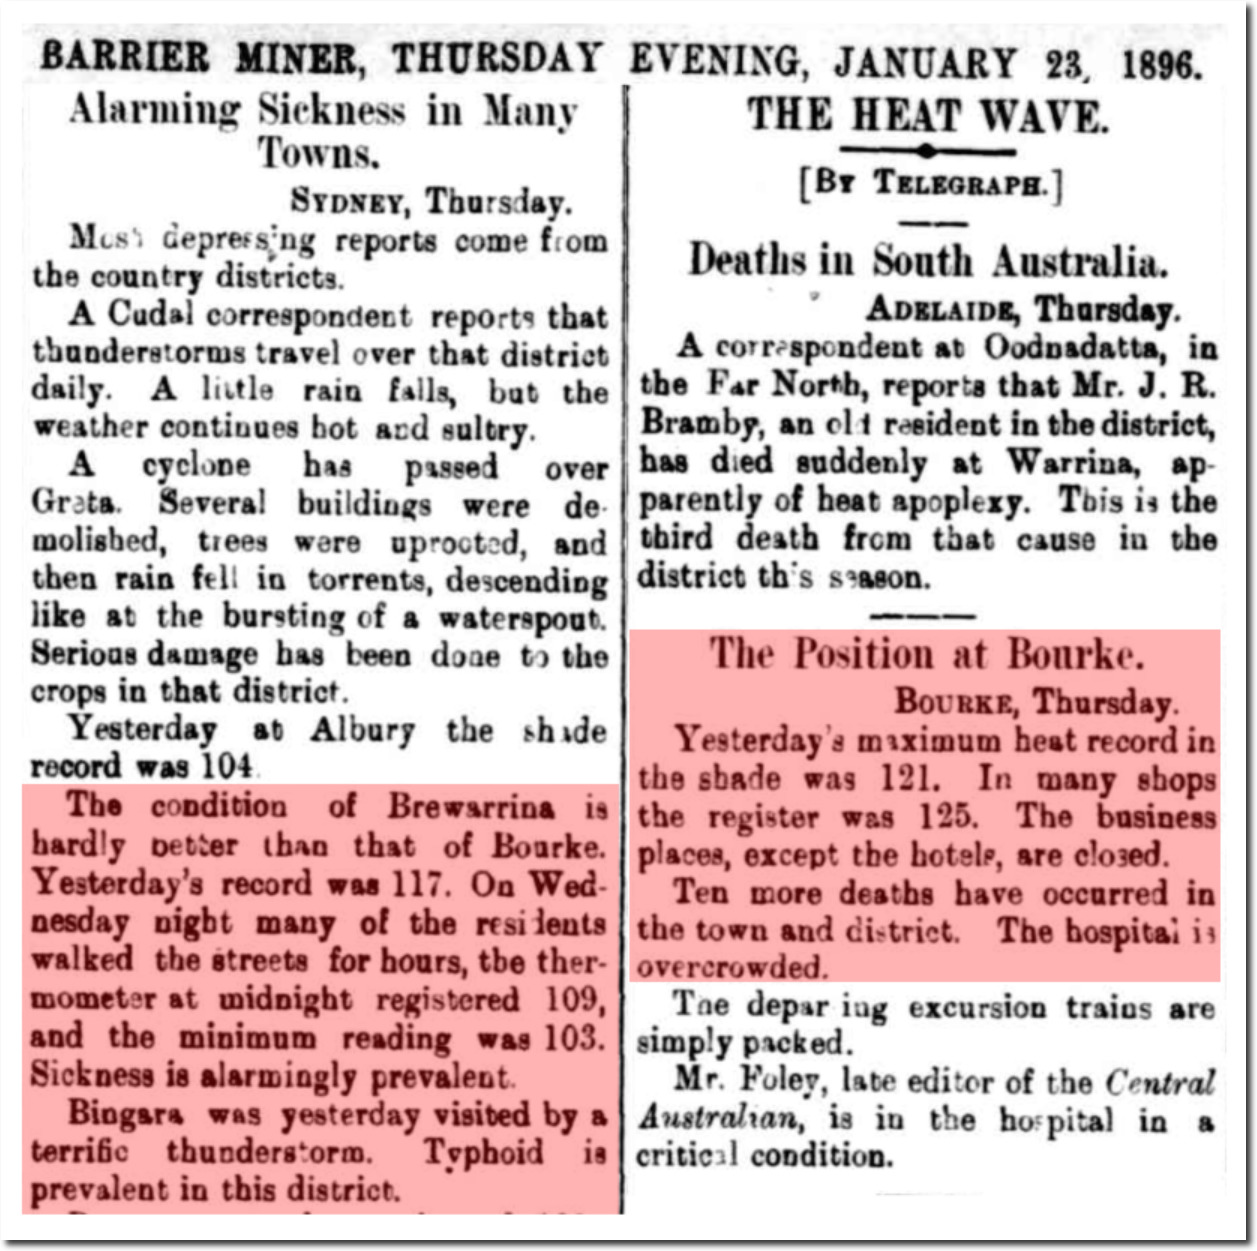
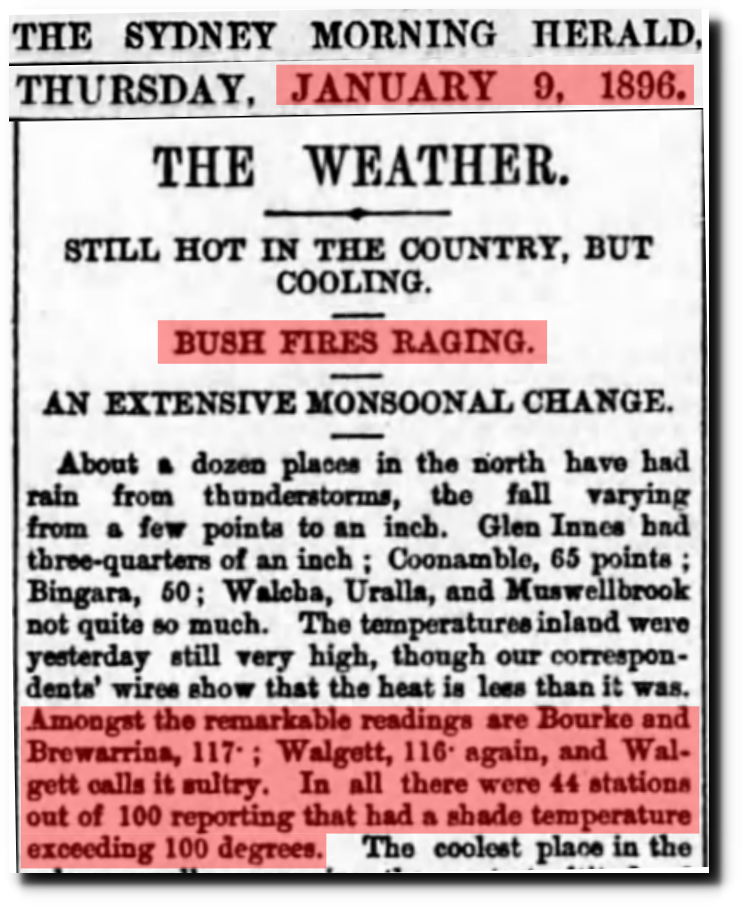
If we look at only high quality temperature data from Australia, the graph makes sense.
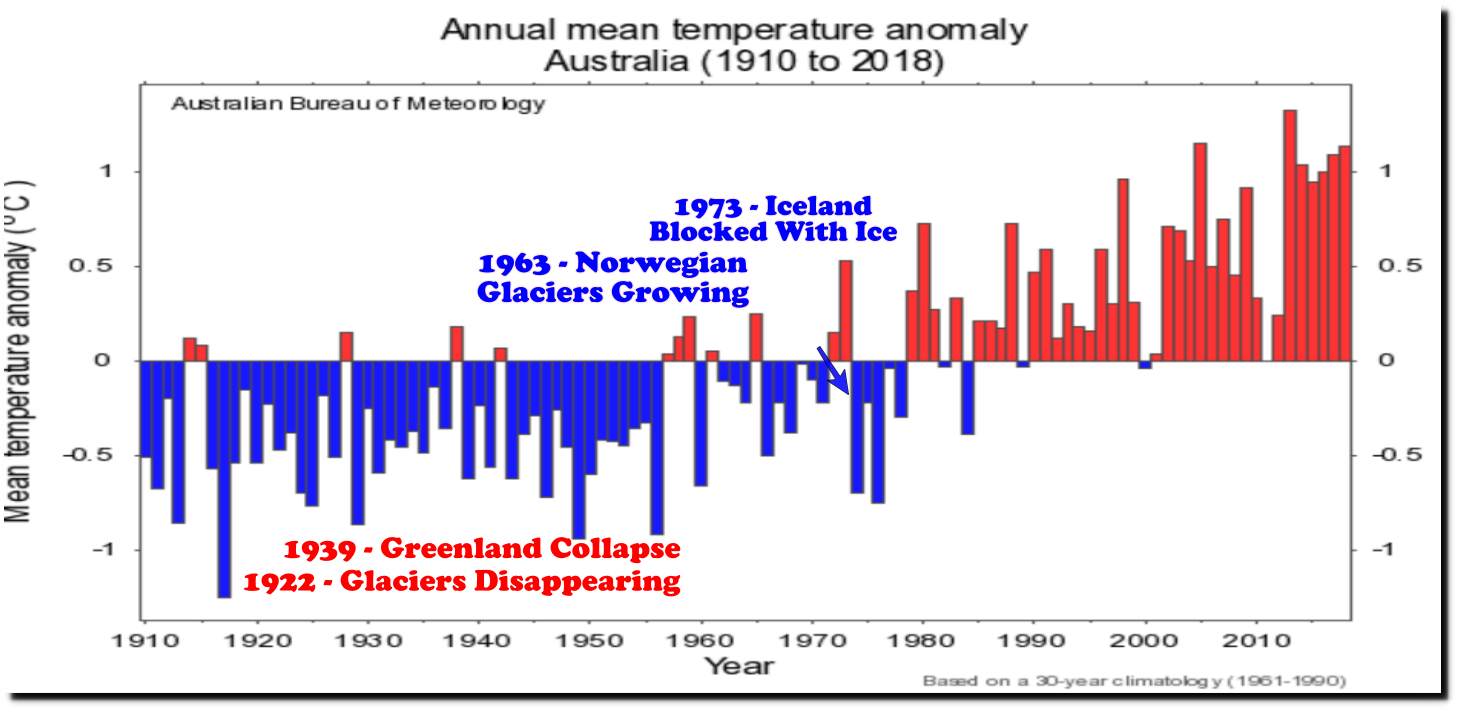
But the official BOM graph makes no sense.
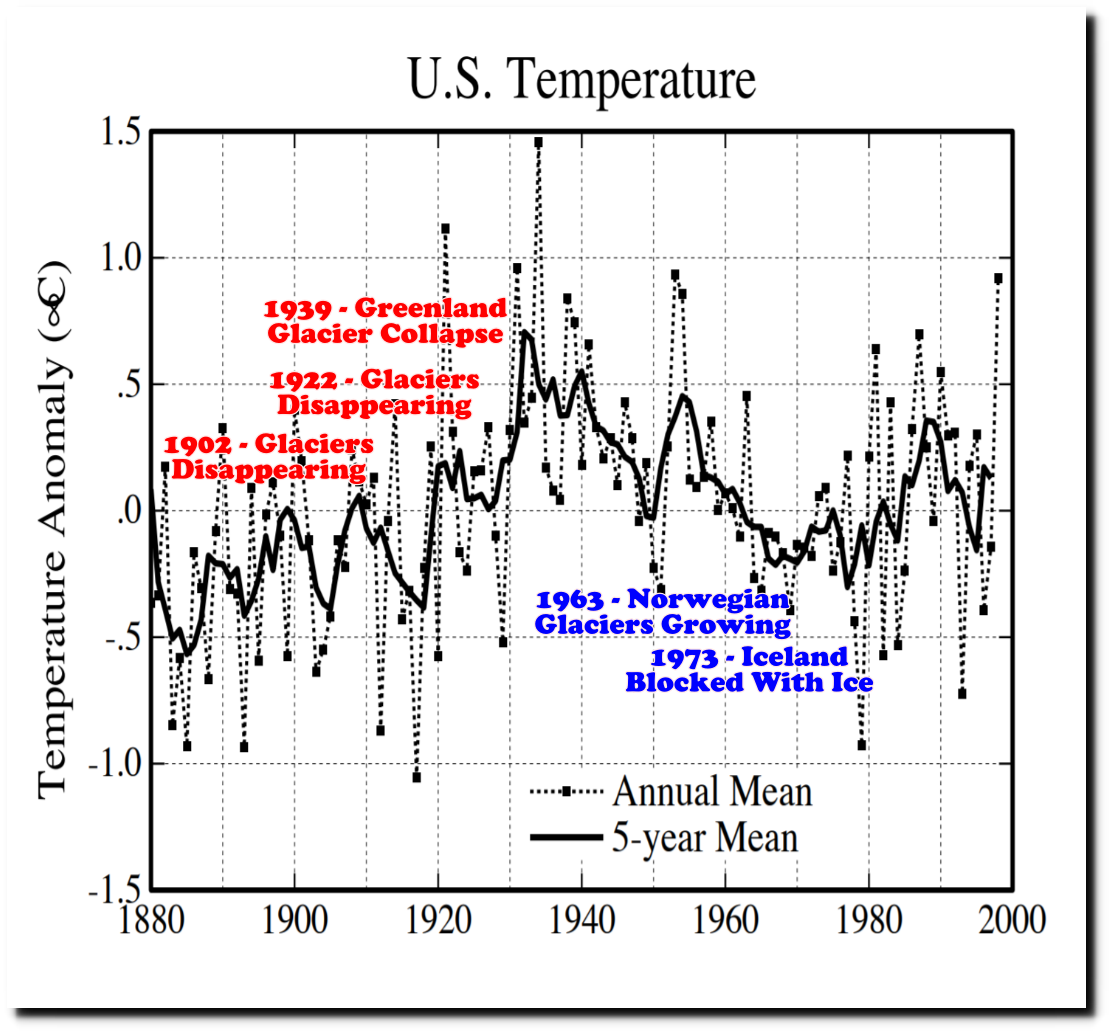
The 1979 US temperature graph from NASA made sense.
1999_Hansen_ha03200f.pdf
The current version makes no sense.

It is crystal clear that current official temperature graphs are nonsense.
“No government has the right to decide on the truth of scientific principles, nor to prescribe in any way the character of the questions investigated.”
– Richard Feynman
Government funded scientists say the Arctic is warming at an astonishing rate.
Scientists released this year’s Arctic Report Card on Tuesday, and it is a dismal one. Researchers say the Arctic continues to warm up at rates they call “astonishing.”
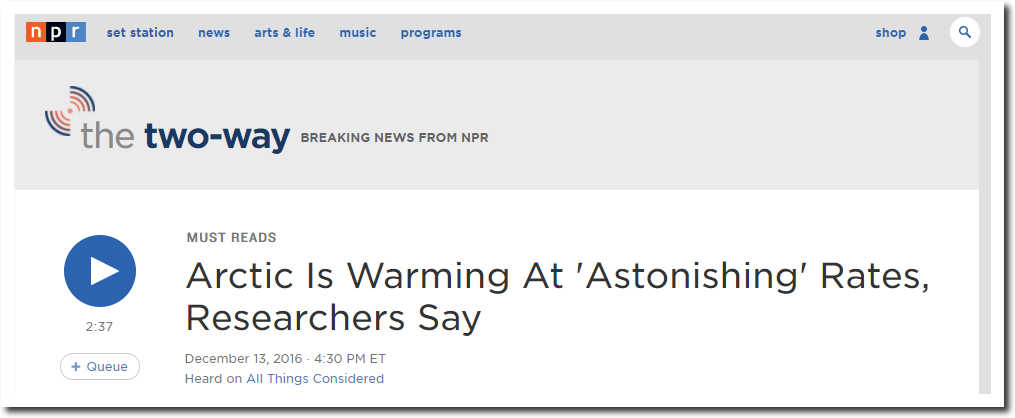
Arctic Is Warming At ‘Astonishing’ Rates, Researchers Say : The Two-Way : NPR
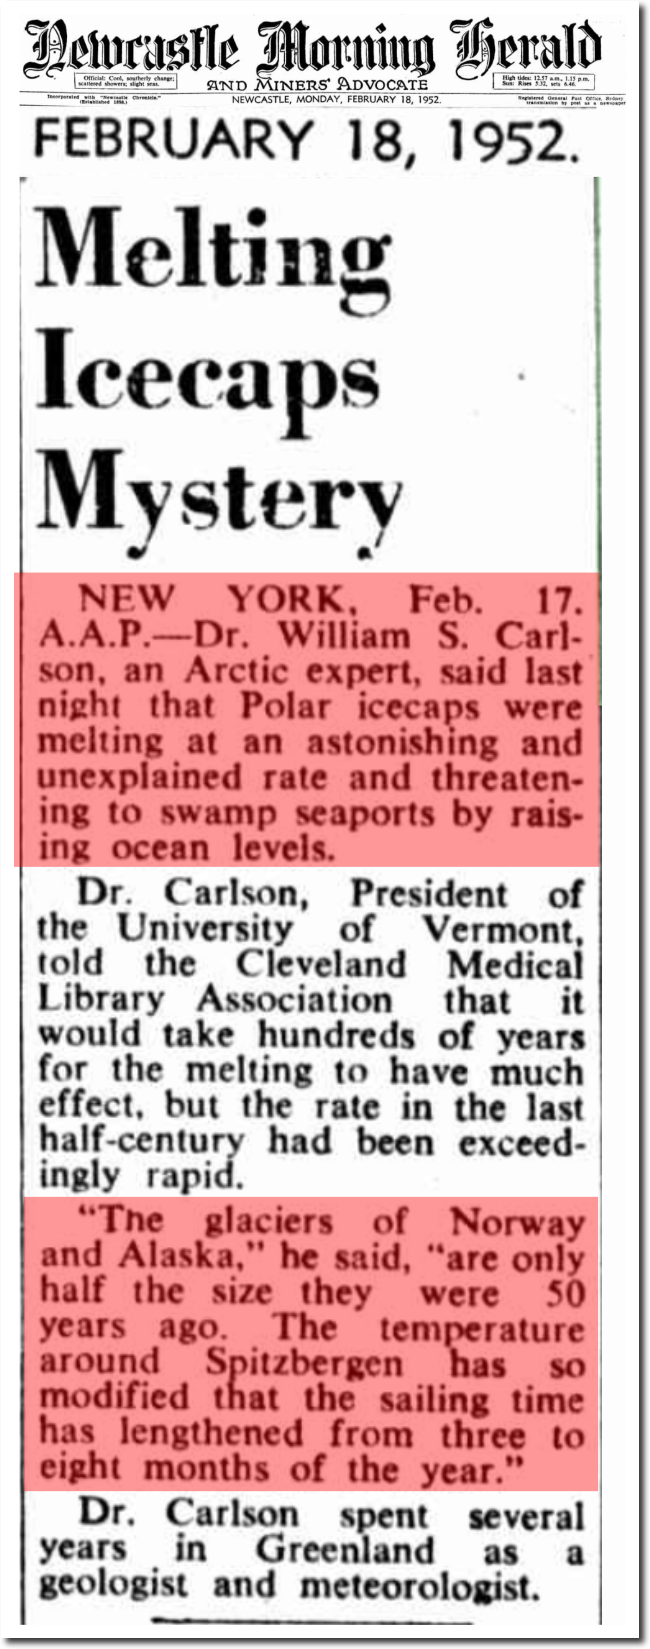
Almost 70 years ago, experts used the exact same words.
Dr. William S. Carlson, an Arctic expert, said last night that Polar icecaps were melting at an astonishing and unexplained rate and threatening to swamp seaports by raising ocean levels.
“The glaciers of Norway and Alaska,” he said, “are only half the size they were 50 years ago.”
18 Feb 1952 – Melting Icecaps Mystery – Trove
Zeke seems to think his poor data practices supersede the historical record.
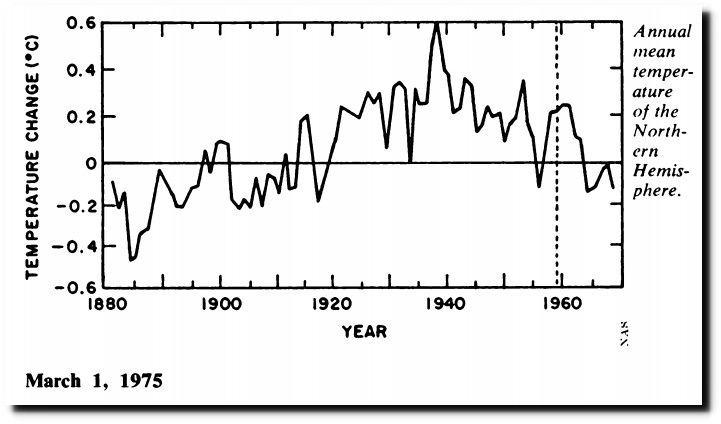
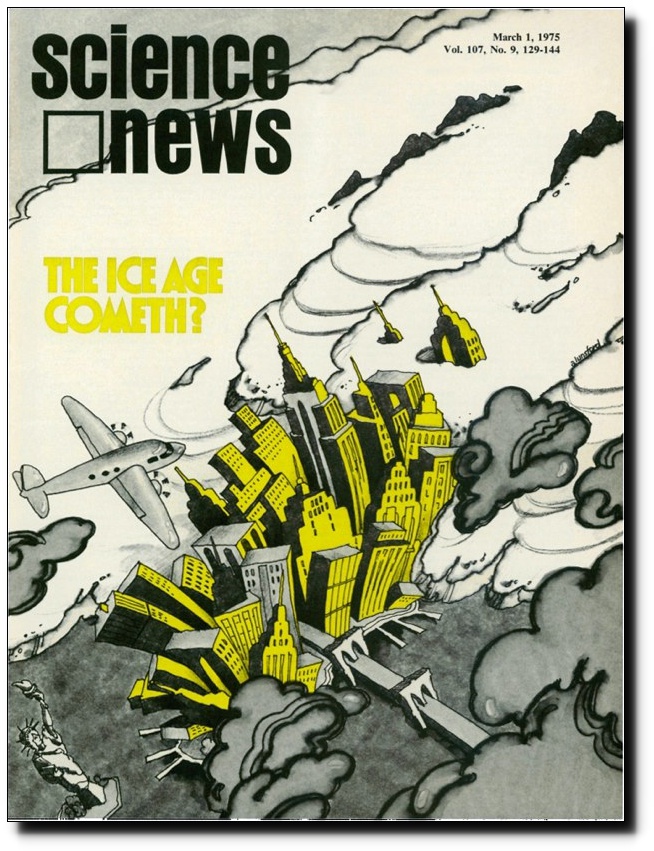 March 1, 1975 | Science News
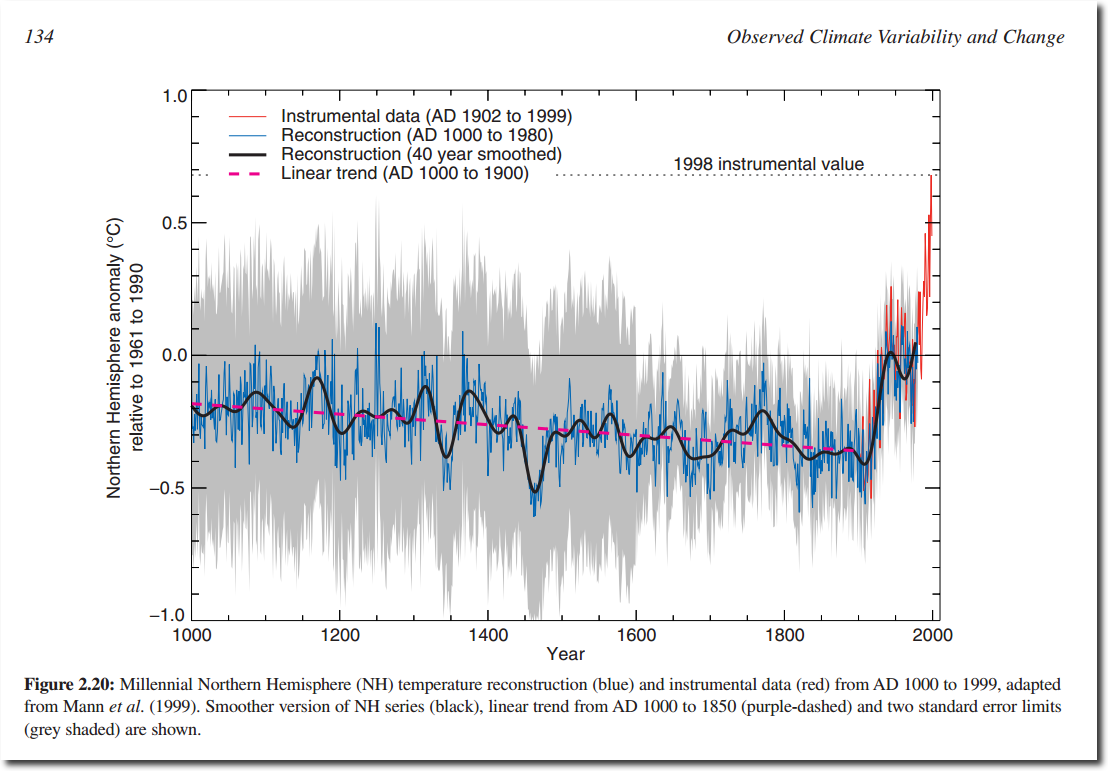
The exact same thing was done by Michael Mann to the Medieval Warm Period and Little Ice Age.

ipcc_far_wg_I_chapter_07.pdf
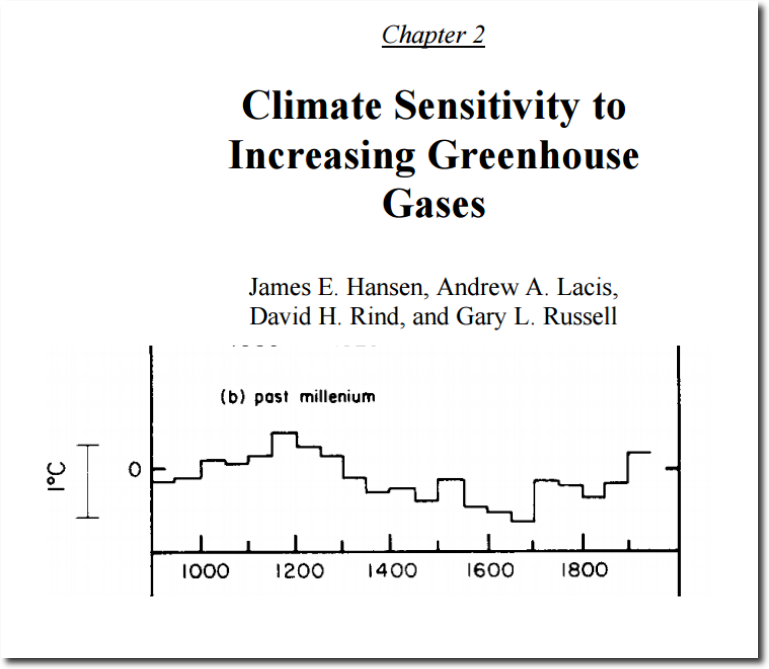
Challenge_chapter2.pdf
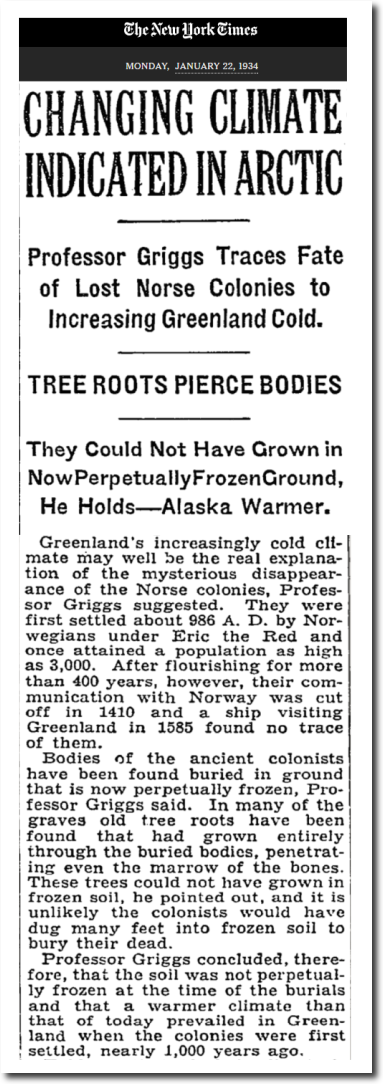
January 22, 1934 – NYTimes.com
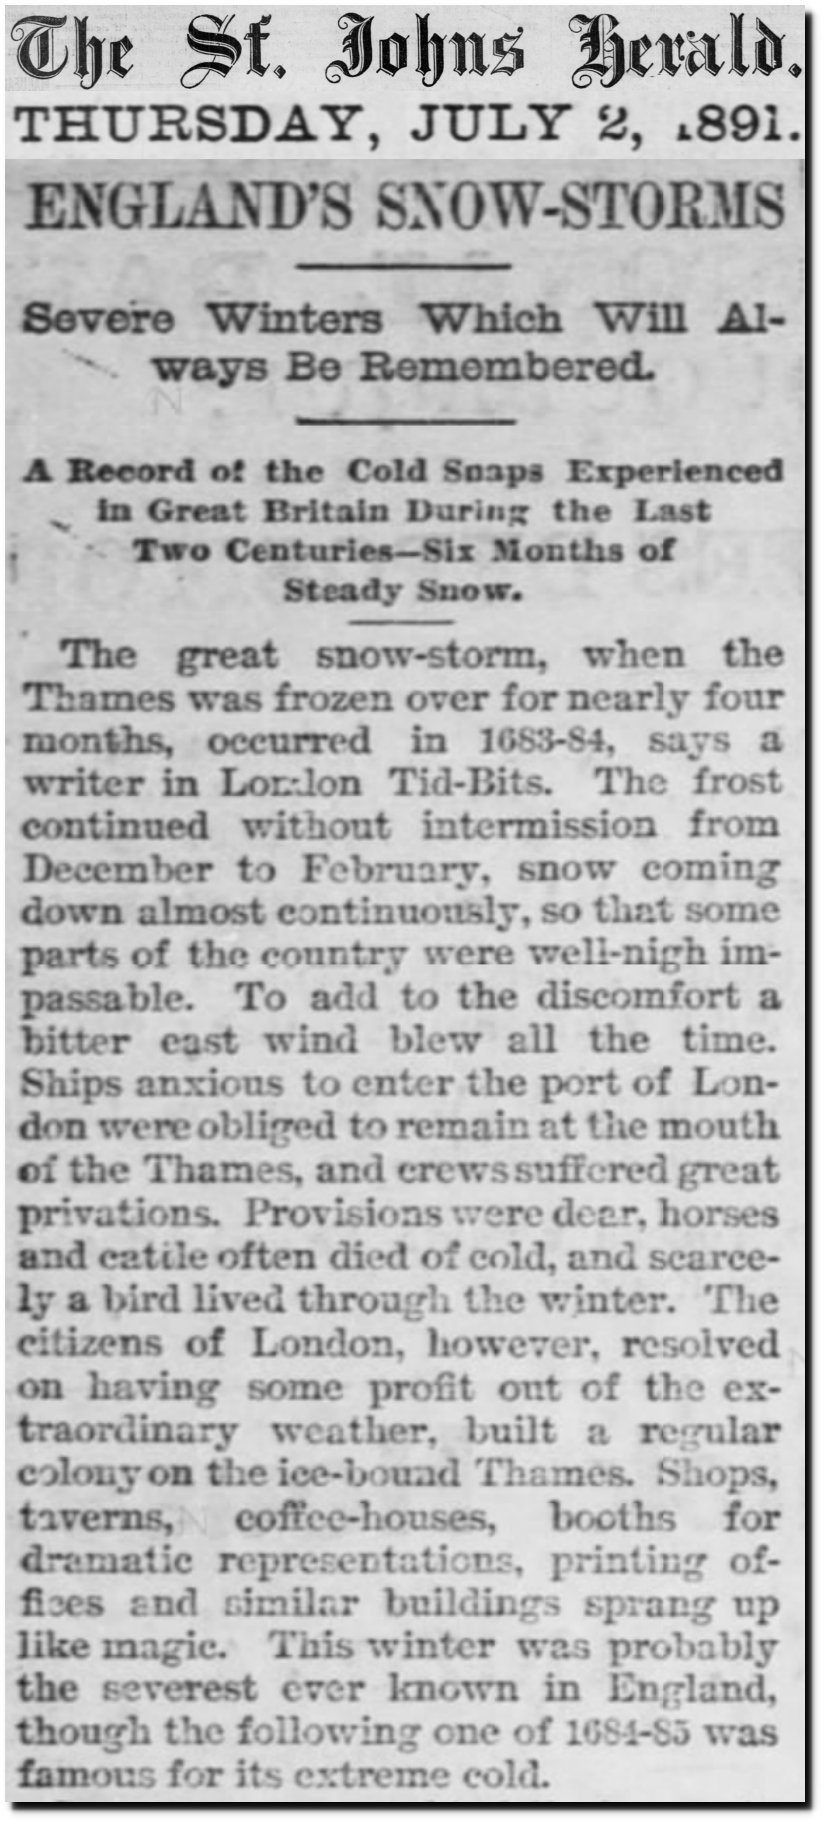
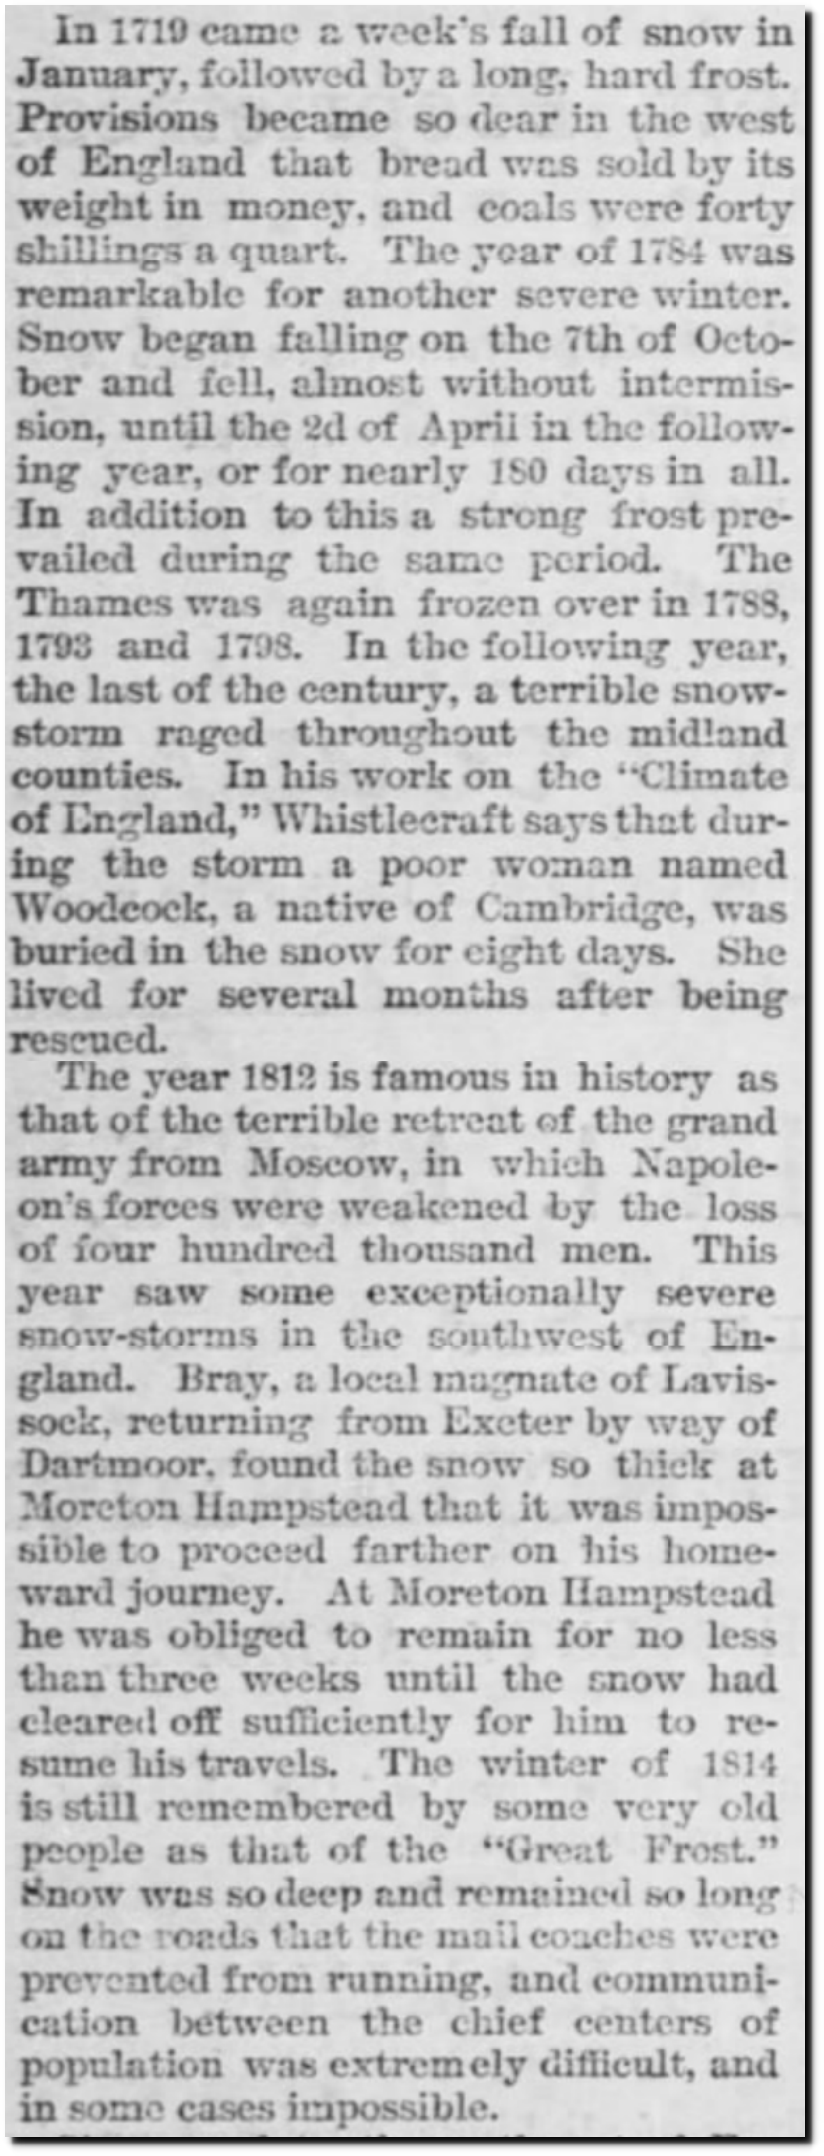
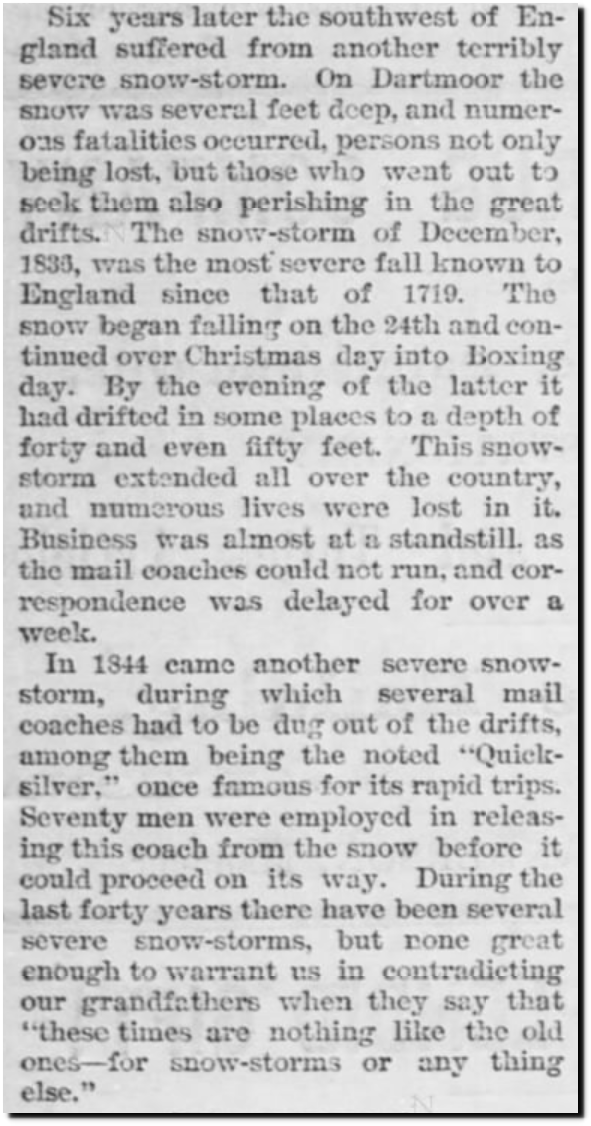
02 Jul 1891, Page 4 – The St Johns Herald at Newspapers.com
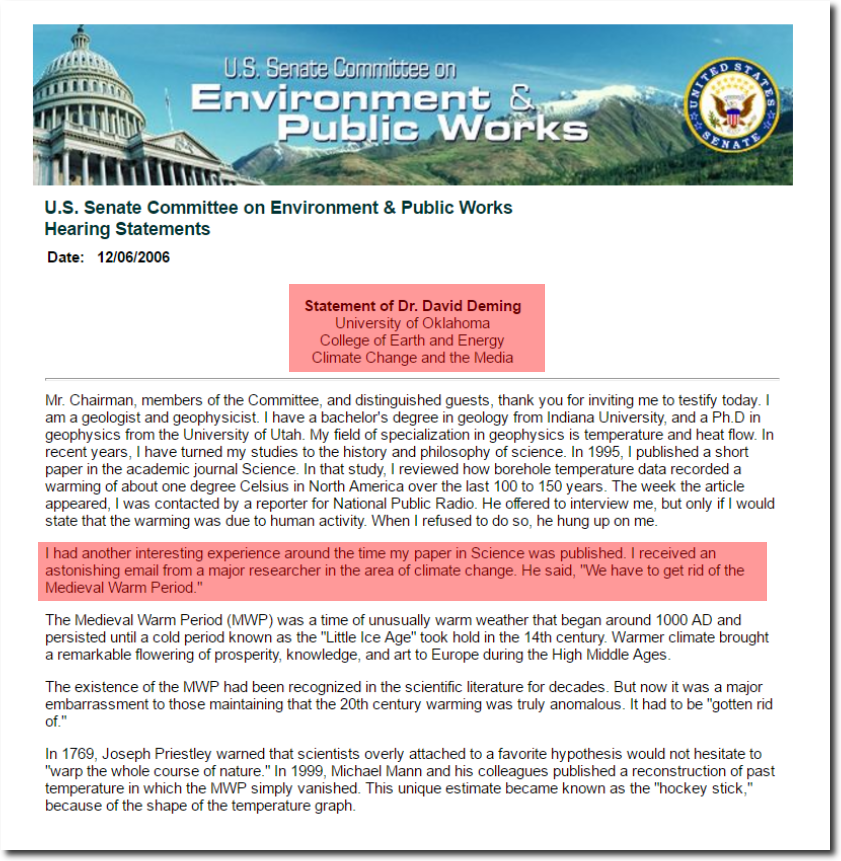
U.S. Senate Committee on Environment and Public Works
TAR-02
There was a time when climate scientists did actual science. We need to return to that.
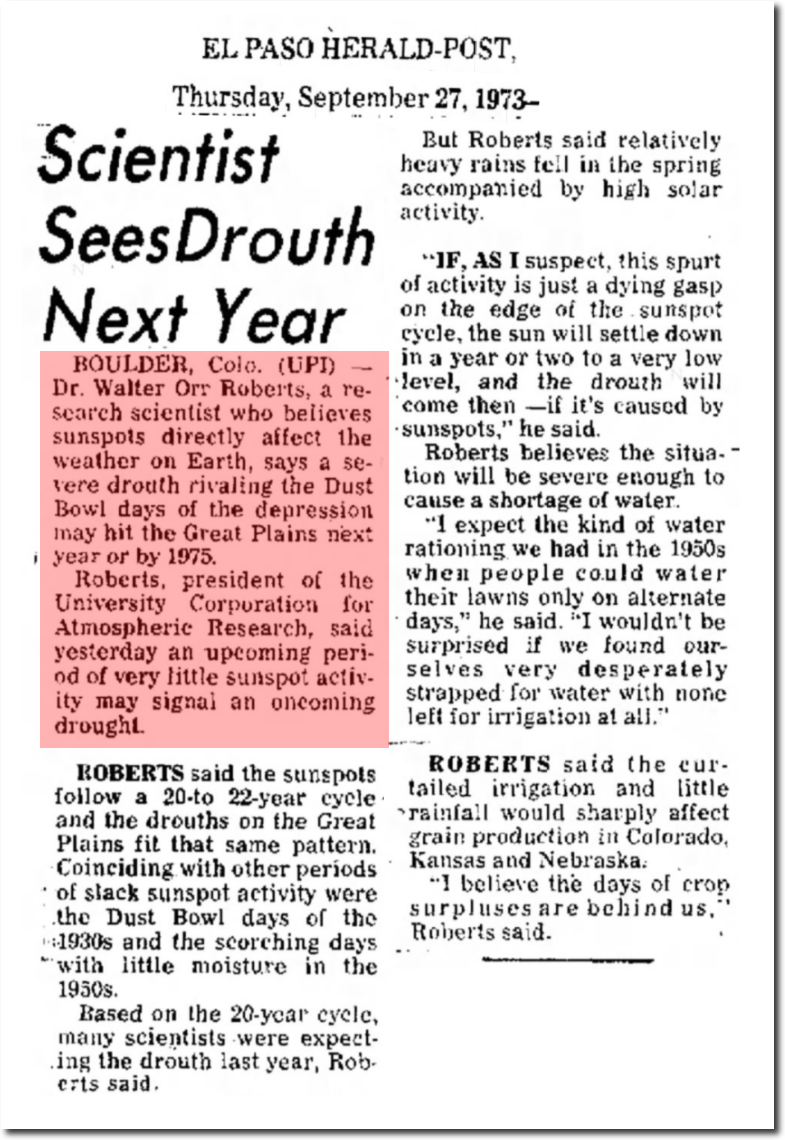
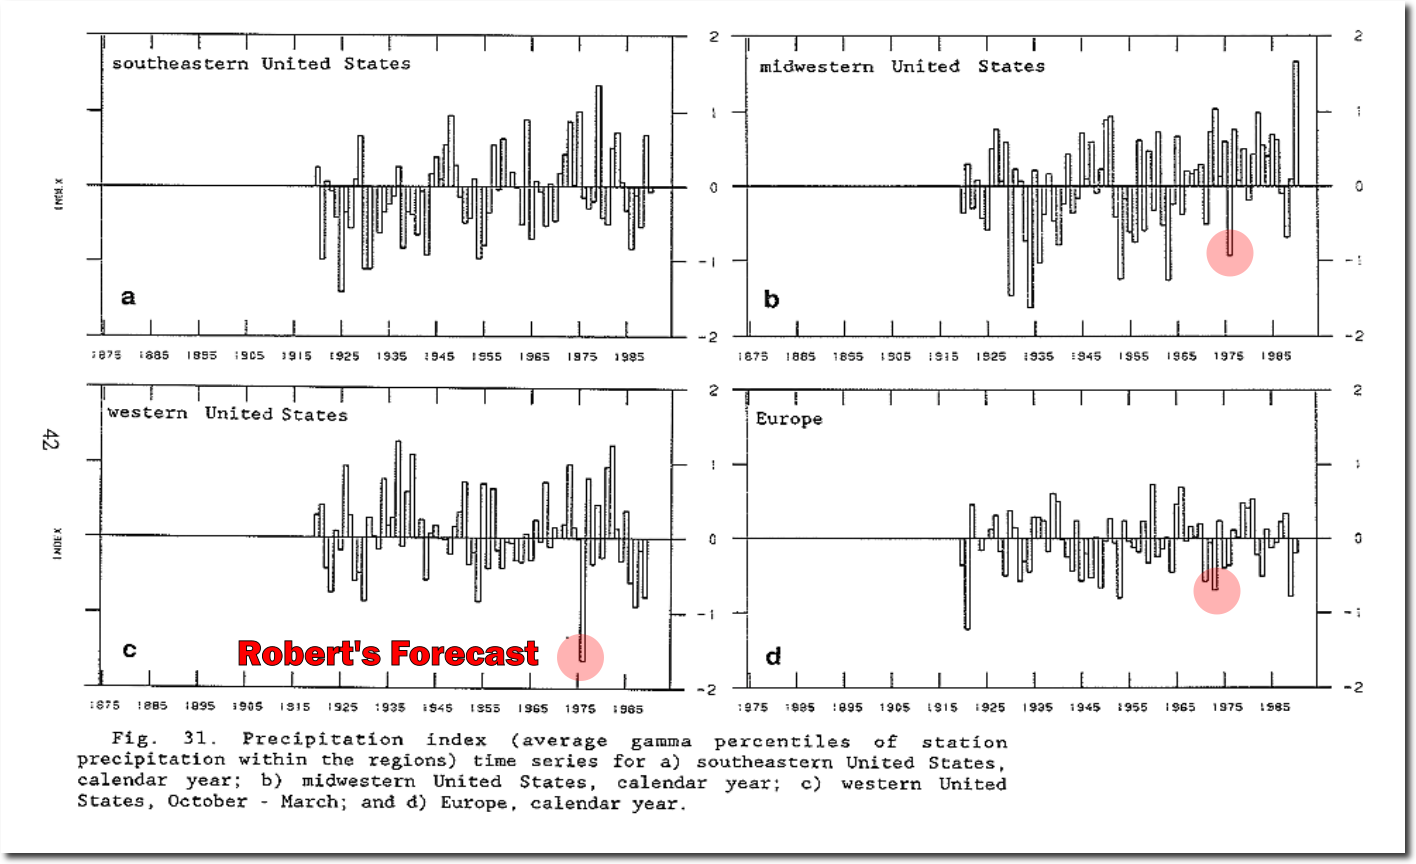
27 Sep 1973, Page 38 – El Paso Herald-Post at Newspapers.com
Dr. Roberts was spot on.
climate-assessment-1981-1990.pdf
The summer of 1976 was the warmest and driest on record in England.
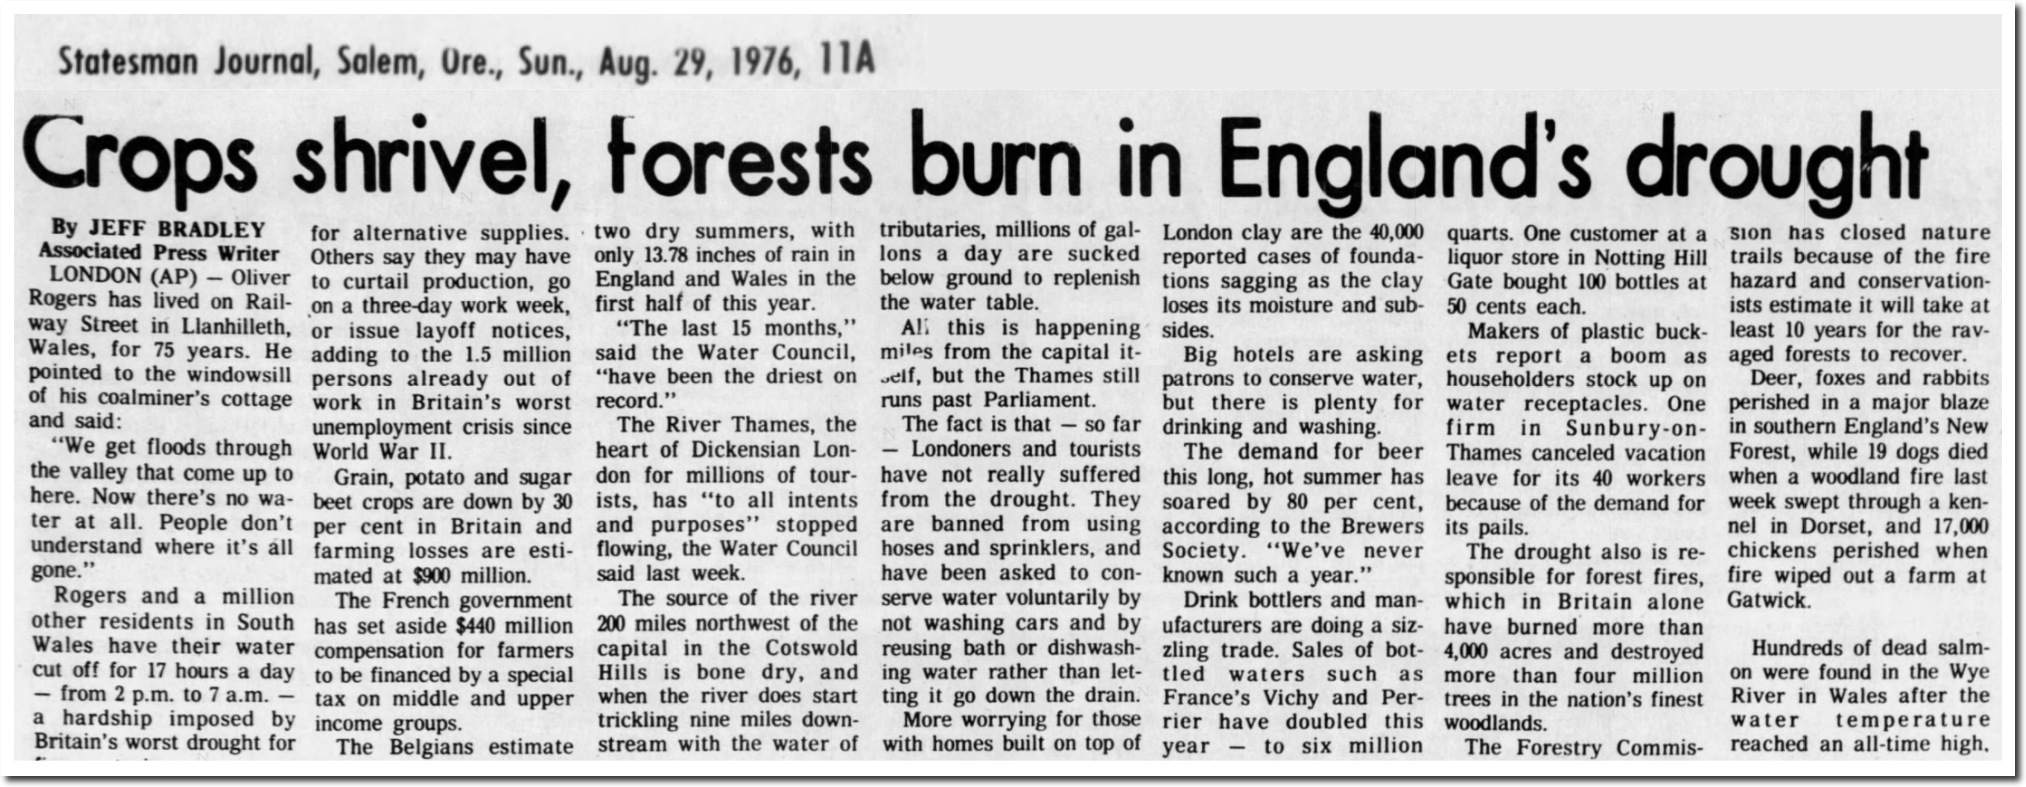
29 Aug 1976, Page 11 – Statesman Journal at Newspapers.com
By 1977, California was experiencing their worst drought on record.
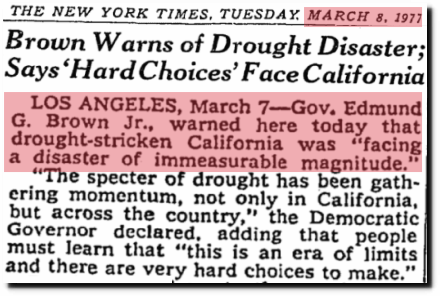
TimesMachine: March 8, 1977 – NYTimes.com

22 Sep 1951 – SUN’S EFFECT ON THE EARTH
National Geographic : 1967 Feb, Page 194
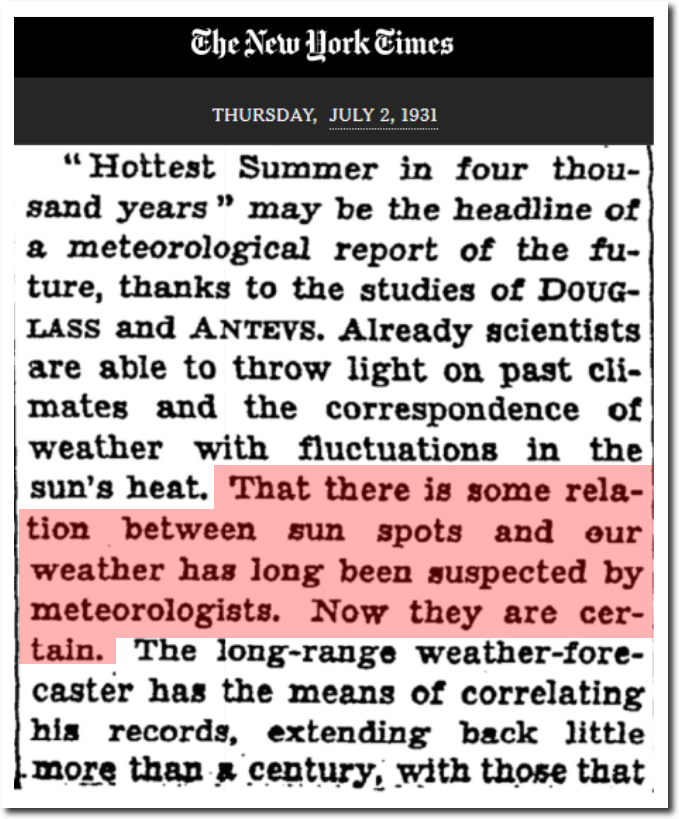
TimesMachine: July 2, 1931 – NYTimes.com
In 1936, the Australian Medical Congress was certain about the relationship between sunspots and natural disasters.
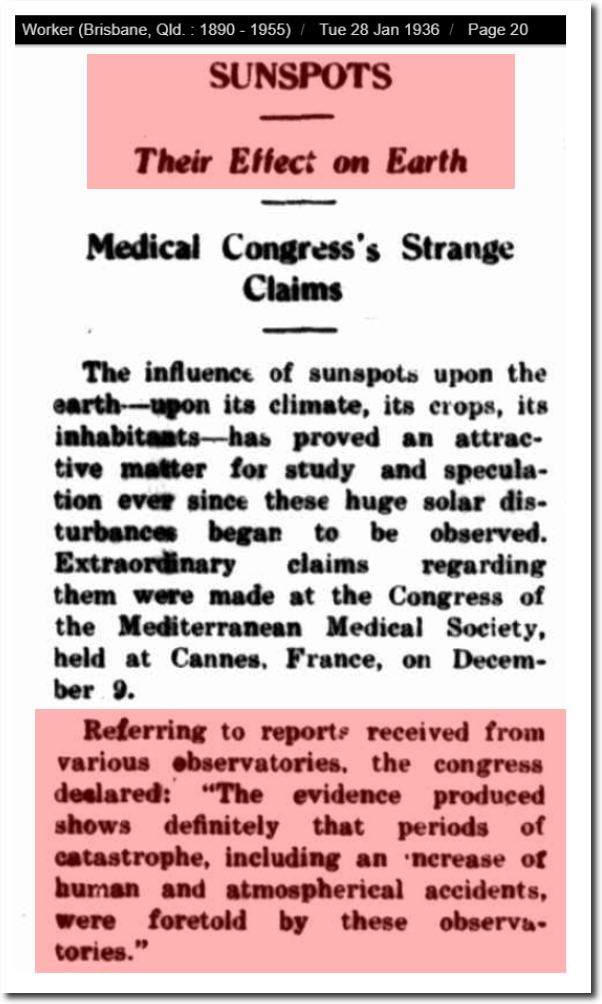
28 Jan 1936 – SUNSPOTS – Trove
In 1932, scientists showed a close correspondence between sunspot cycles and past climate.

12 Dec 1932, 12 – The Atlanta Constitution at Newspapers.com
In 1994, astronomers showed a correlation between the length of sunspot cycles and Earth’s temperature.
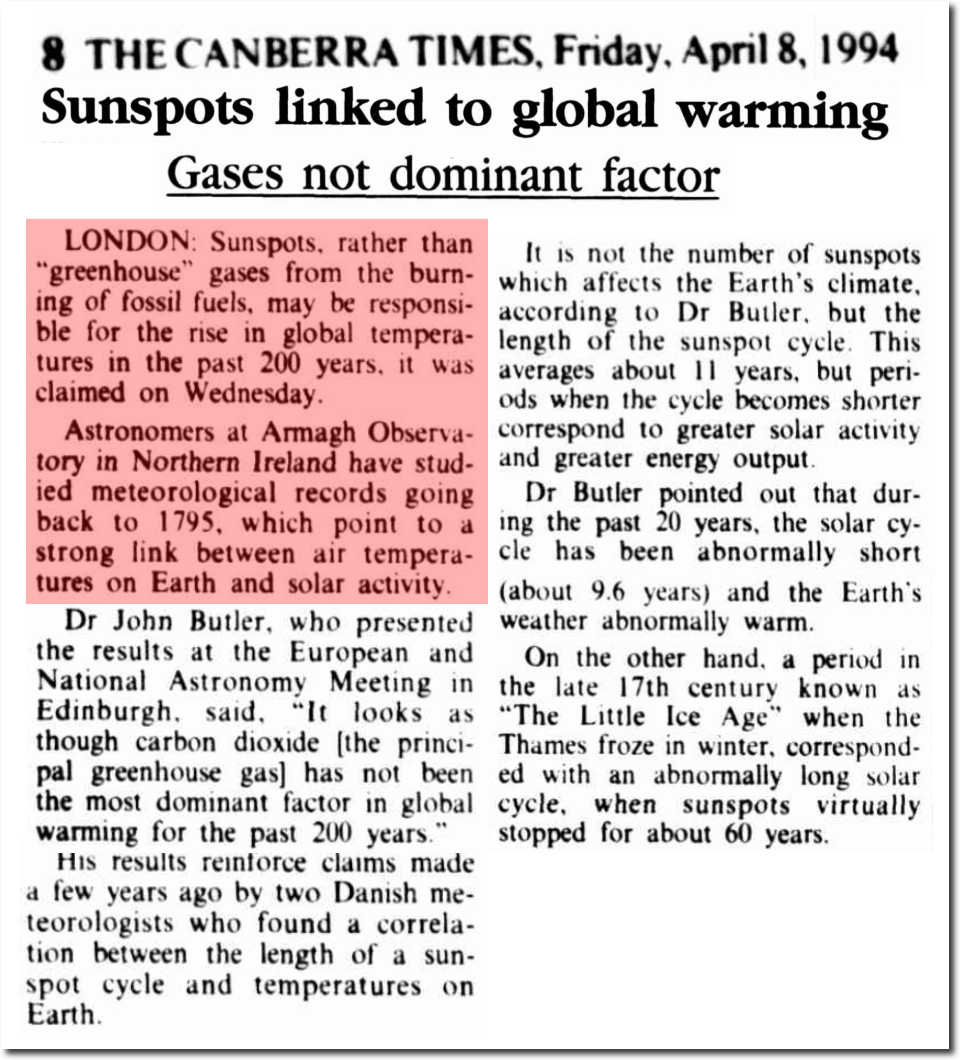
08 Apr 1994 – Sunspots linked to global warming – Trove
The relationship between sunspots and grain prices has long been known.

10 Aug 1886 – Sunspots and Grain Prices. – Trove
This idea was first proposed by British astronomer William Herschel in 1801, and confirmed 200 years later.
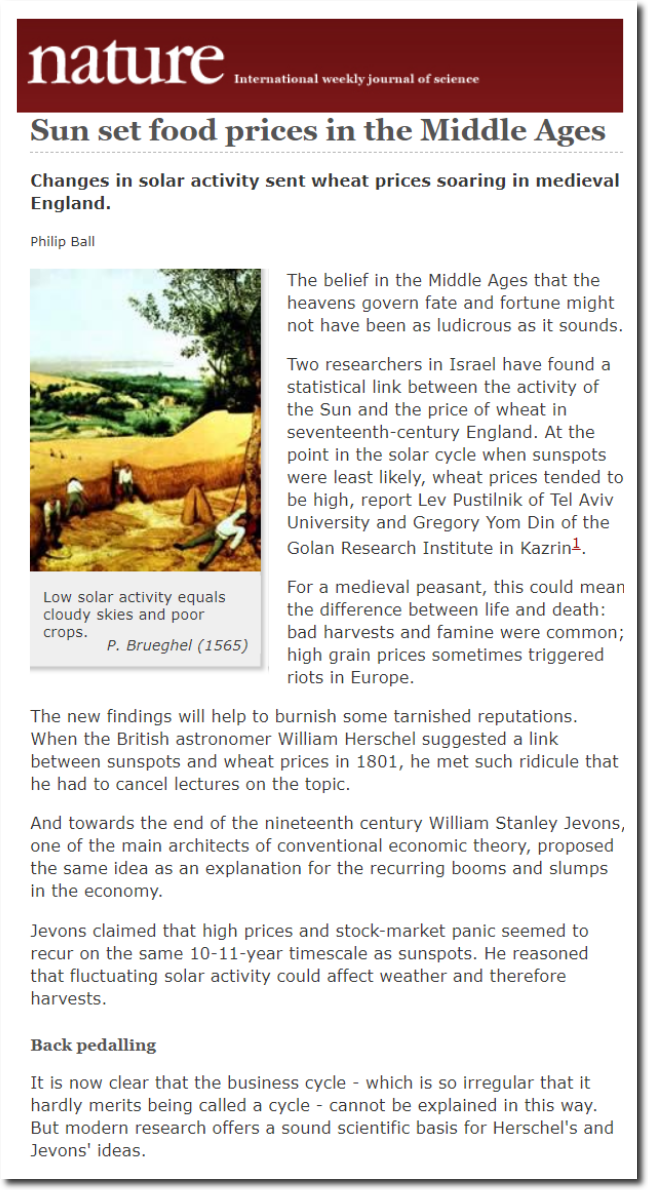
Sun set food prices in the Middle Ages : Nature News
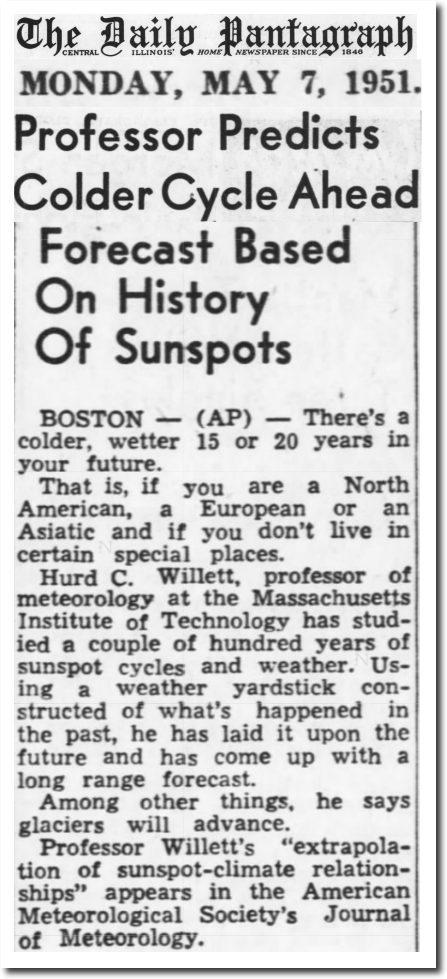
07 May 1951, Page 9 – The Pantagraph at Newspapers.com
Dr. Willett was spot on. We need real scientists like Willet and Walter Orr Roberts – not arrogant hacks like Mann and Hausfather.
21 Jul 1974, 13 – The Des Moines Register at Newspapers.com
Scientists now claim that a 0.0001 mole fraction increase in CO2 over the past century controls the climate. This is because the Sun can’t be controlled, scientists can’t pretend they know how to prevent bad weather, and politicians can’t use sunspots as an excuse to raise taxes and control energy policy.
The 1:10,000 increase in atmospheric CO2 over the past century is equivalent to packing an extra two people into Madison Square Garden

People like Hausfather have been using bad data to promote imaginary climate change for over 150 years. Time to bring this episode to an end.
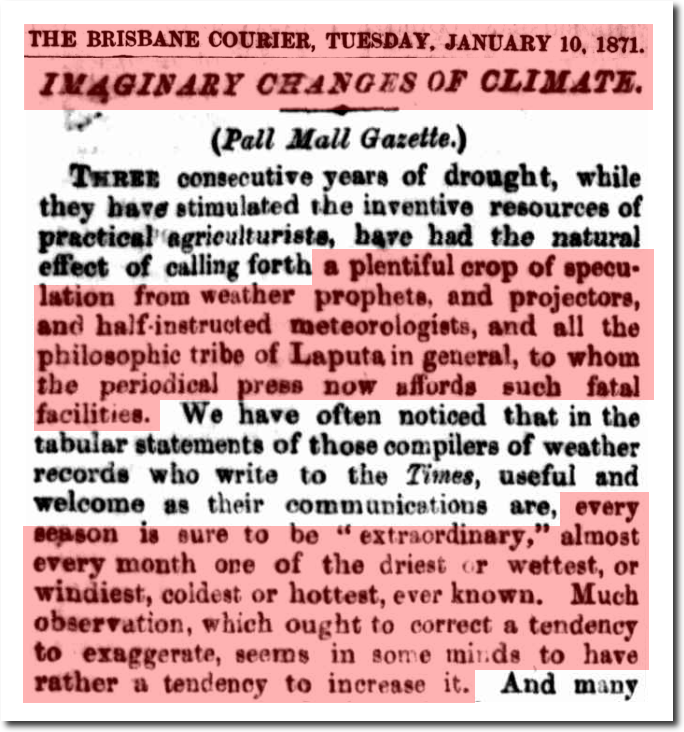
10 Jan 1871 – IMAGINARY CHANGES OF CLIMATE


