

Disrupting the Borg is expensive and time consuming!

Google Search
-
Recent Posts
- One Atomic Bomb Per Hour
- New Video : Analyzing Oil And Gas
- Is Antarctica Melting?
- High Speed Analysis And Visualization
- El Nino To The Rescue?
- Fake News Update
- Growth Of Antarctic Sea Ice
- 65 Years Of Progress!
- El Nino To The Rescue?
- Worst March Drought On Record
- ChartGL Process Control Demo
- The Biggest Money Laundering Scam
- Drought In The Headwaters Of Lake Powell
- Unrealistic Expectations Of Water Availability
- Did Bill Gates Do This?
- Worst March Drought On Record In The US
- The Real Hockey Stick Graph
- Analyzing The Western Water Crisis
- Gaslighting 1924
- “Why Do You Resist?”
- Climate Attribution Model
- Fact Checking NASA
- Fact Checking Grok
- Fact Checking The New York Times
- New Visitech Features
Recent Comments
- Bob G on One Atomic Bomb Per Hour
- Robertvd on One Atomic Bomb Per Hour
- czechlist on One Atomic Bomb Per Hour
- conrad ziefle on One Atomic Bomb Per Hour
- conrad ziefle on One Atomic Bomb Per Hour
- D. Boss on One Atomic Bomb Per Hour
- D. Boss on One Atomic Bomb Per Hour
- Gordon Vigurs on One Atomic Bomb Per Hour
- Gordon Vigurs on One Atomic Bomb Per Hour
- Gordon Vigurs on One Atomic Bomb Per Hour
The Heatwave Of October 1963
October afternoon temperatures have been declining in the Midwest since the 19th century, and tended to be much hotter prior to 50 years ago. But one year really stood out – 1963. That year averaged about ten degrees above the long term average.
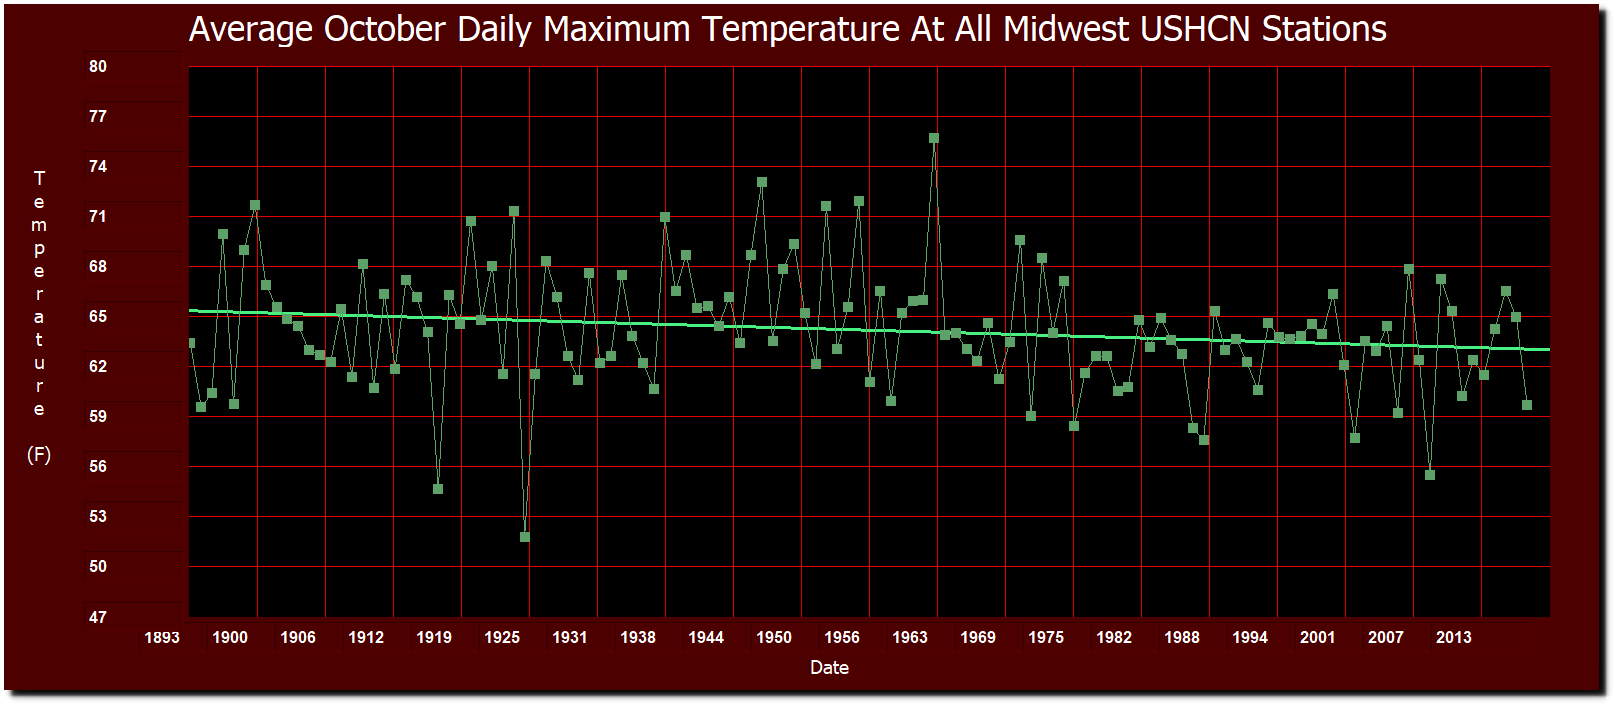
The average afternoon temperature in the Midwest that month was 76 degrees.
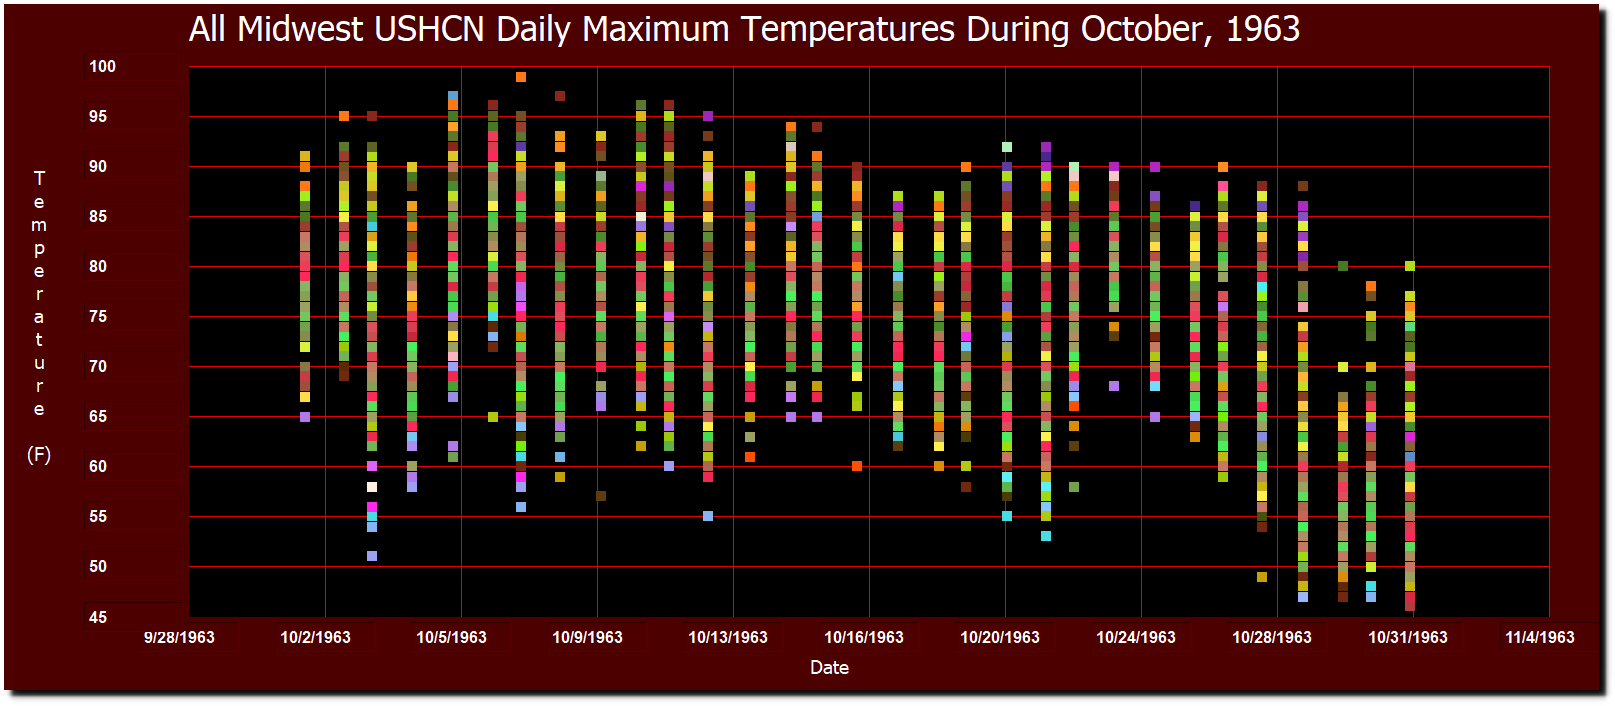
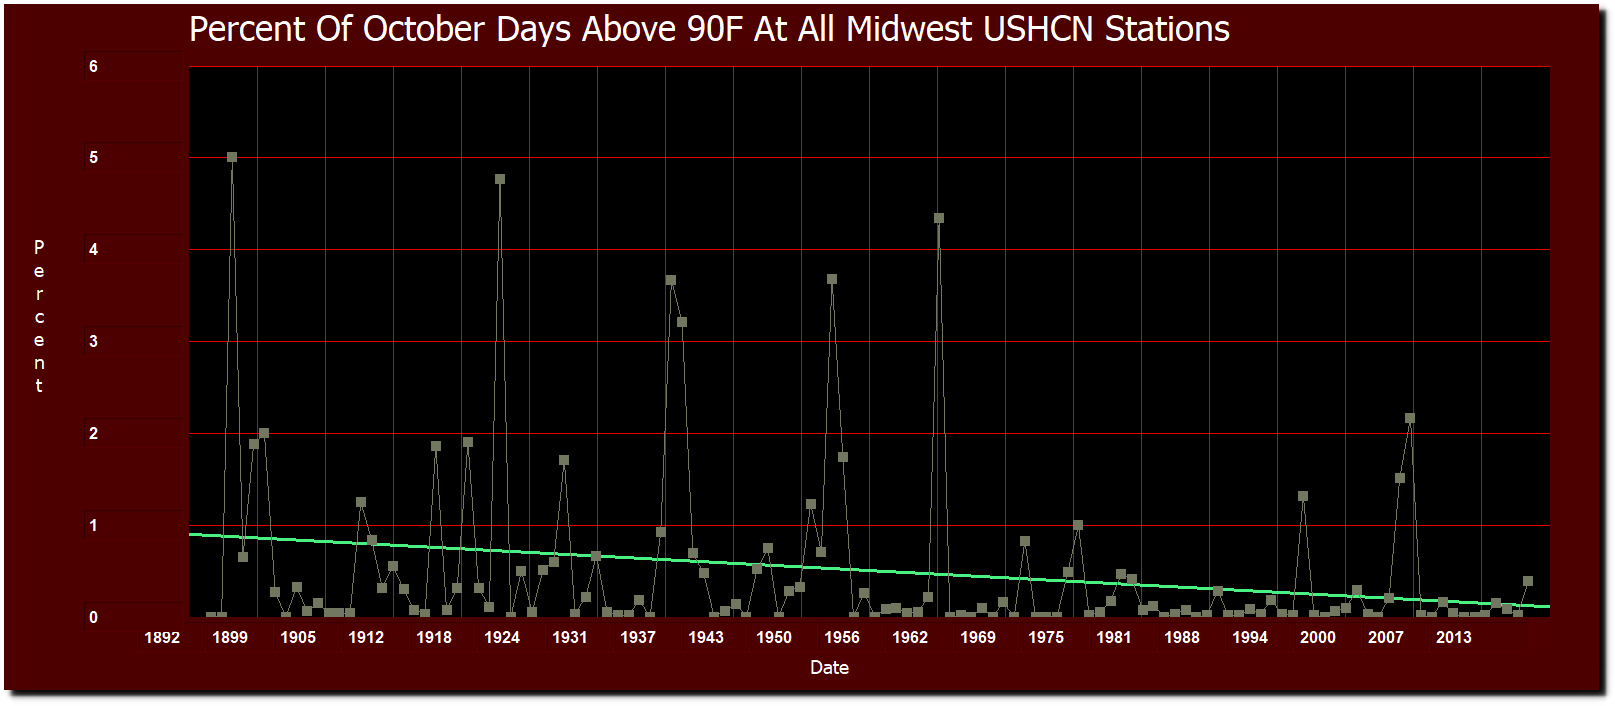
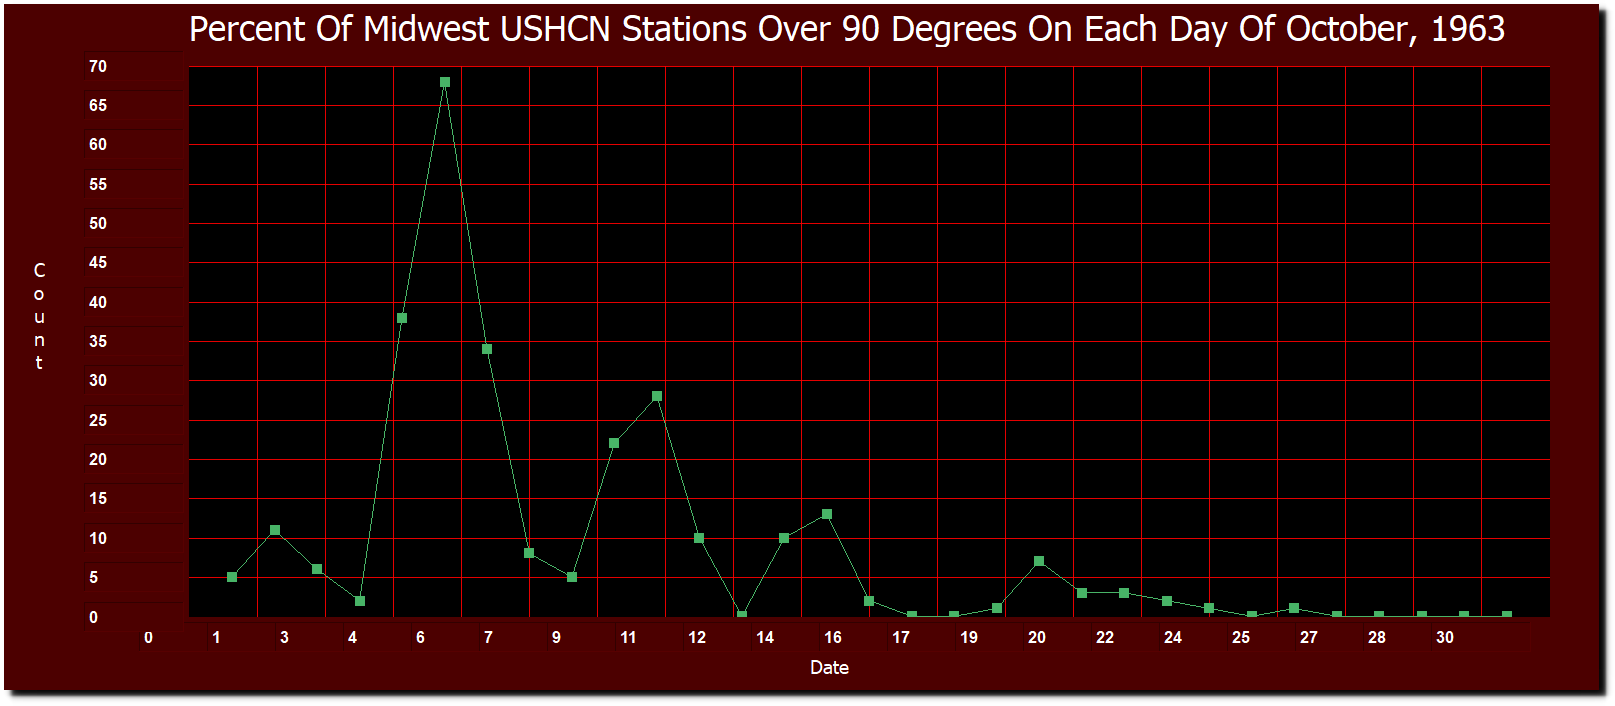
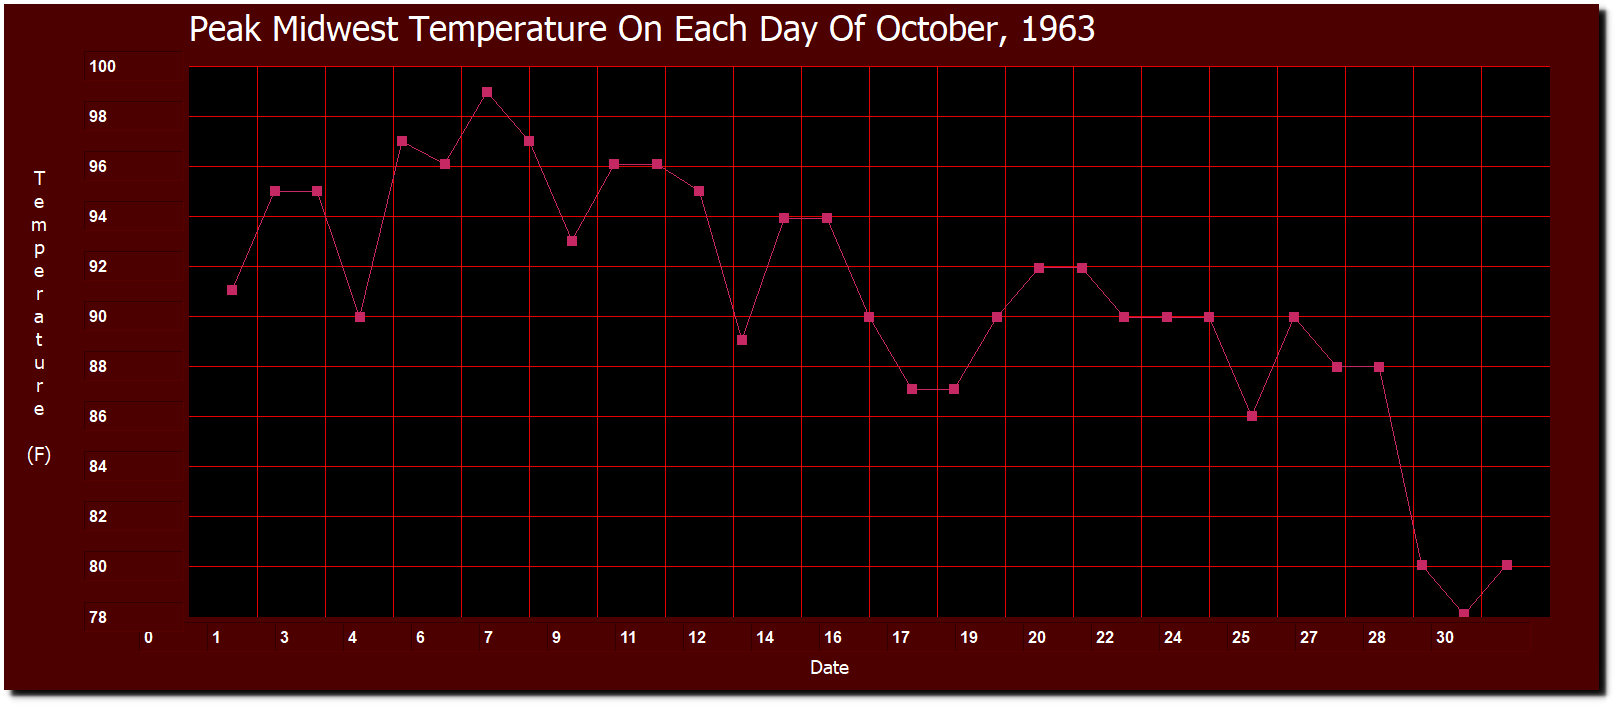
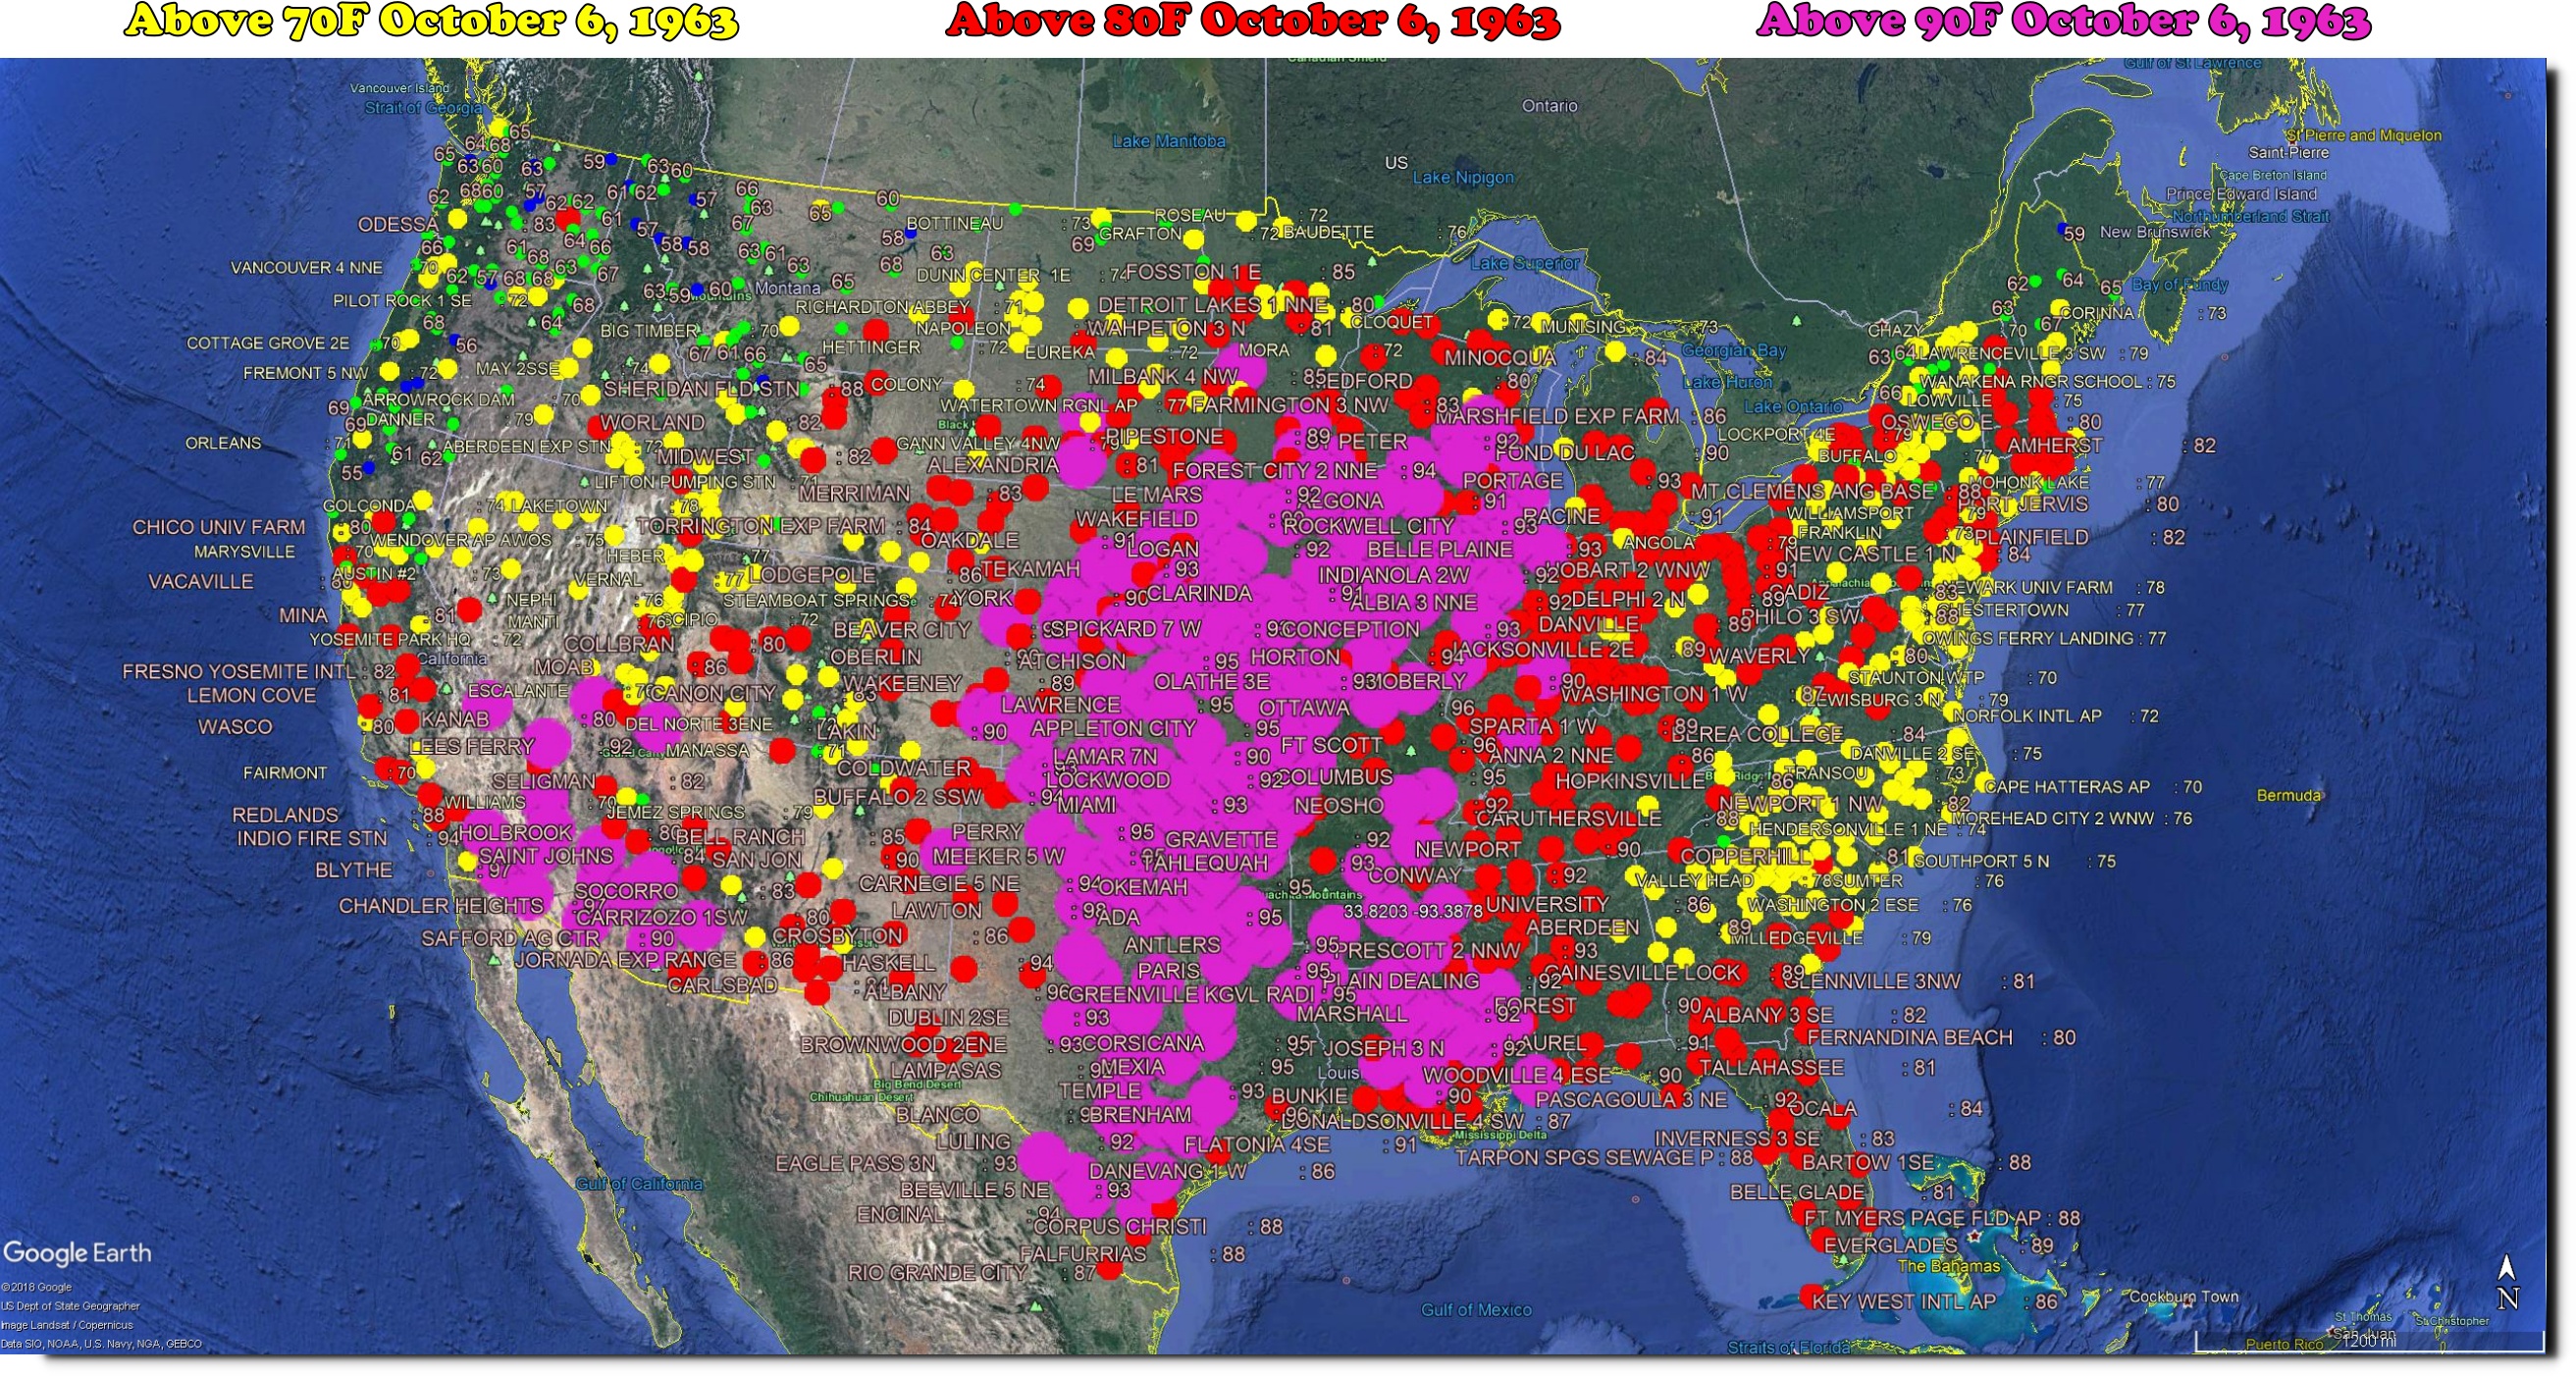
The hottest day was October 6. when more than two-thirds of the Midwest was over 90 degrees. On October 7, Appleton City, Missouri was 99 degrees.
People (like NOAA) who claim the US is getting hotter, have no clue what they are talking about.
Posted in Uncategorized
Leave a comment
Changed My Twitter Handle
From @SteveSGoddard to @Tony__Heller
Posted in Uncategorized
Leave a comment
Hiding The Hottest Month Ever
In NASA’s 2001 version of global temperatures, March 1878 was the hottest month on record. They have since erased this data set from their web site, but I found the data on the web archive.
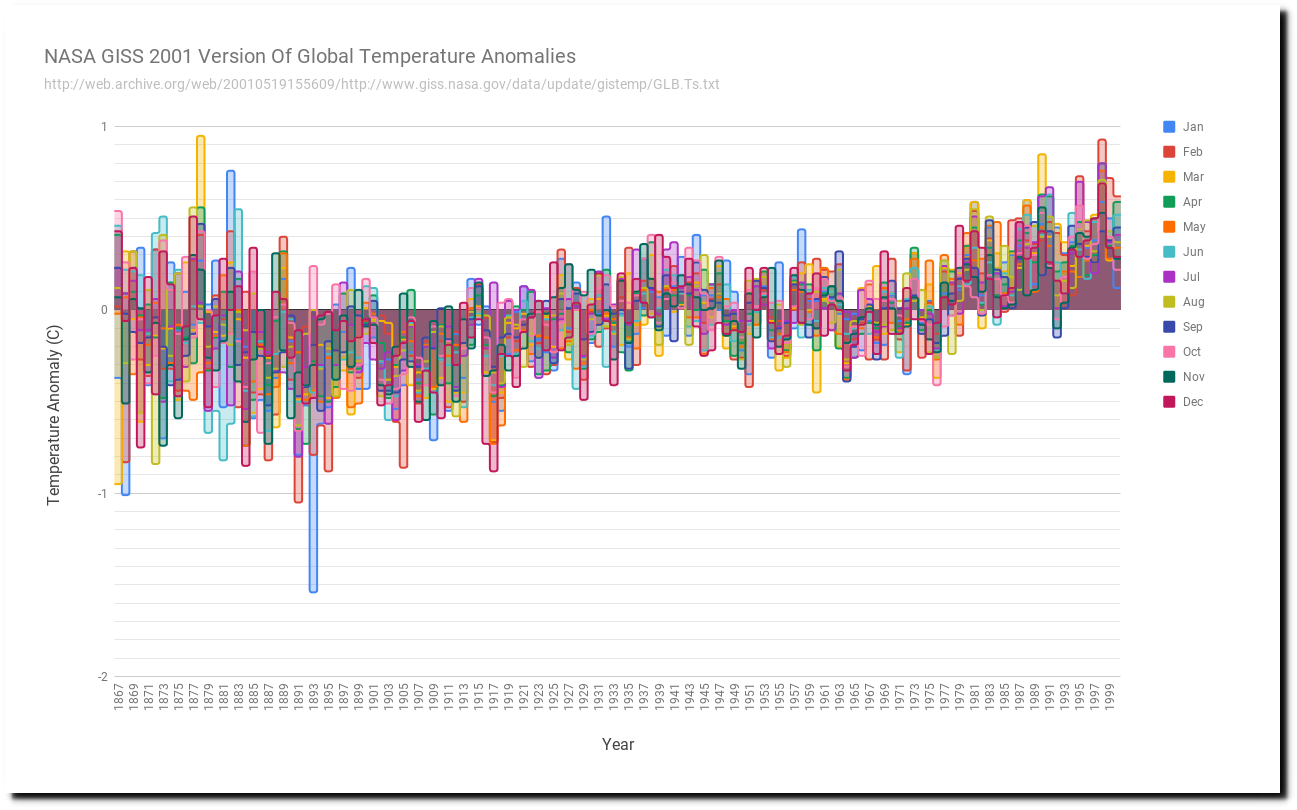
http://www.giss.nasa.gov/data/update/gistemp/GLB.Ts.txt
For the whole year, 1878 was the hottest year prior to 1980.

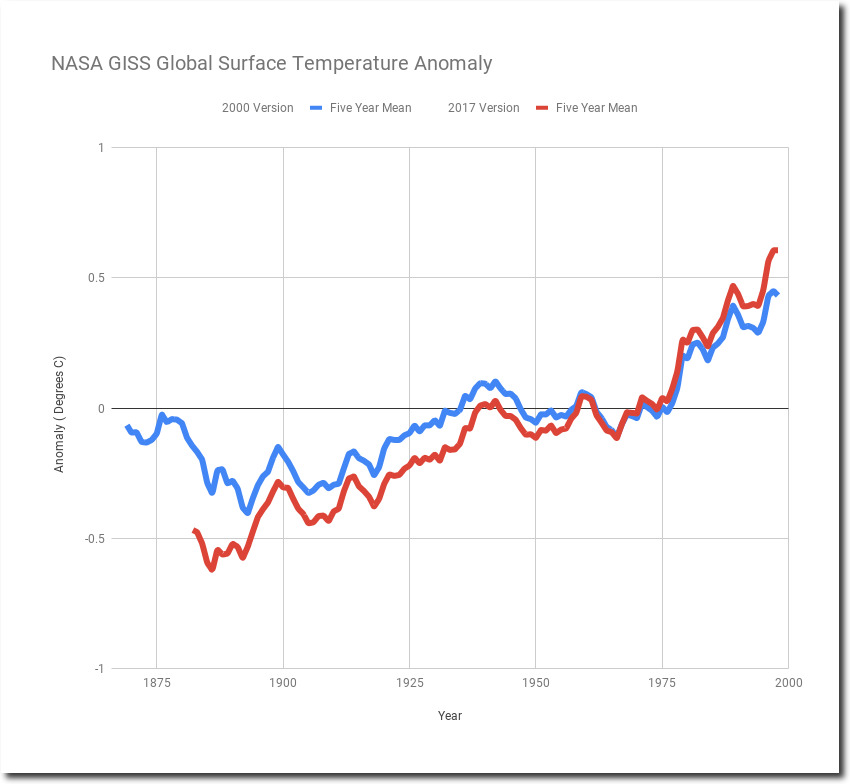
NASA used to show about 0.5C warming prior to the year 2000, but they erased the pre-1880 data, and altered the post-1880 data to create 1.2C warming prior to the year 2000. They more than doubled warming via data tampering.
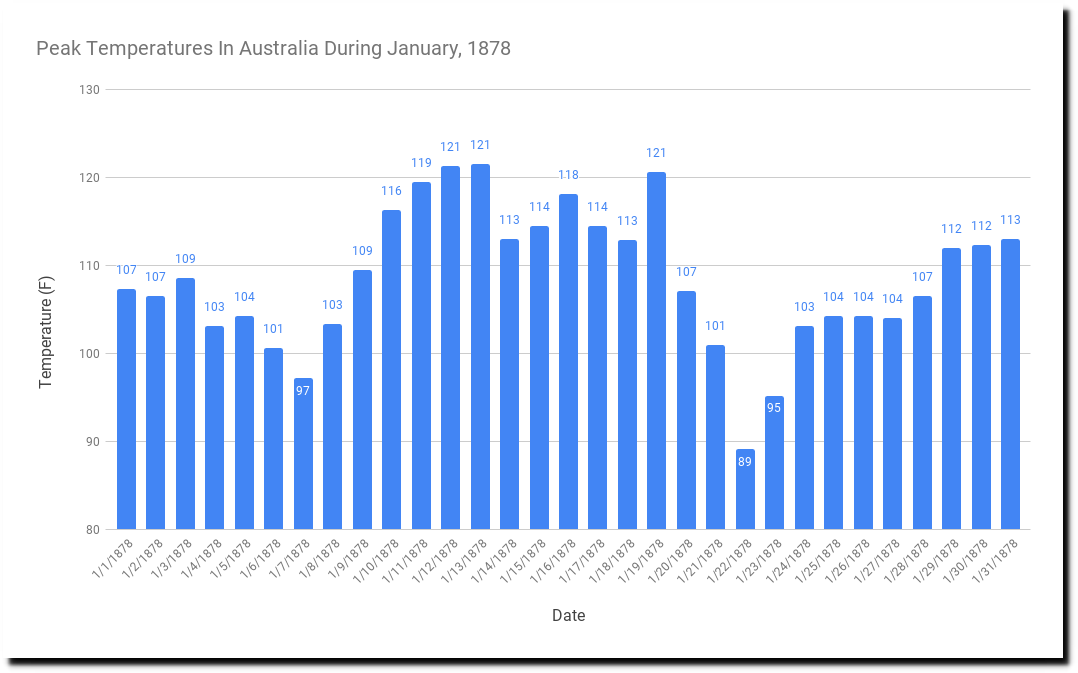
Let’s look at why NASA is hiding the pre-1880 data. January 1878 was one of the hottest months on record in Australia.
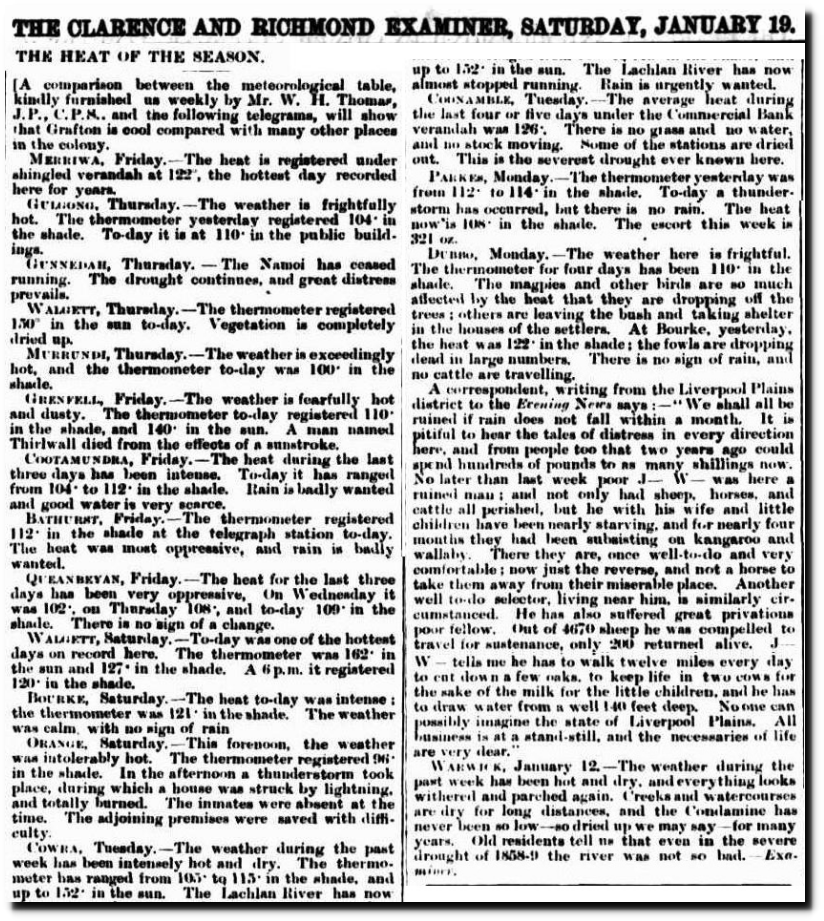
DUBBO, Monday.—The weather here is frightful. The thermometer for four days has been 110° in the shade. The magpies and other birds are so much affected by the heat that they are dropping off the trees ; others are leaving the bush and taking shelter in the houses of the settlers.
At Bourke, yesterday, the heat was 122° in the shade; the fowls are dropping dead in large numbers. There is no sign of rain, and no cattle are travelling.
THE HEAT OF THE SEASON.
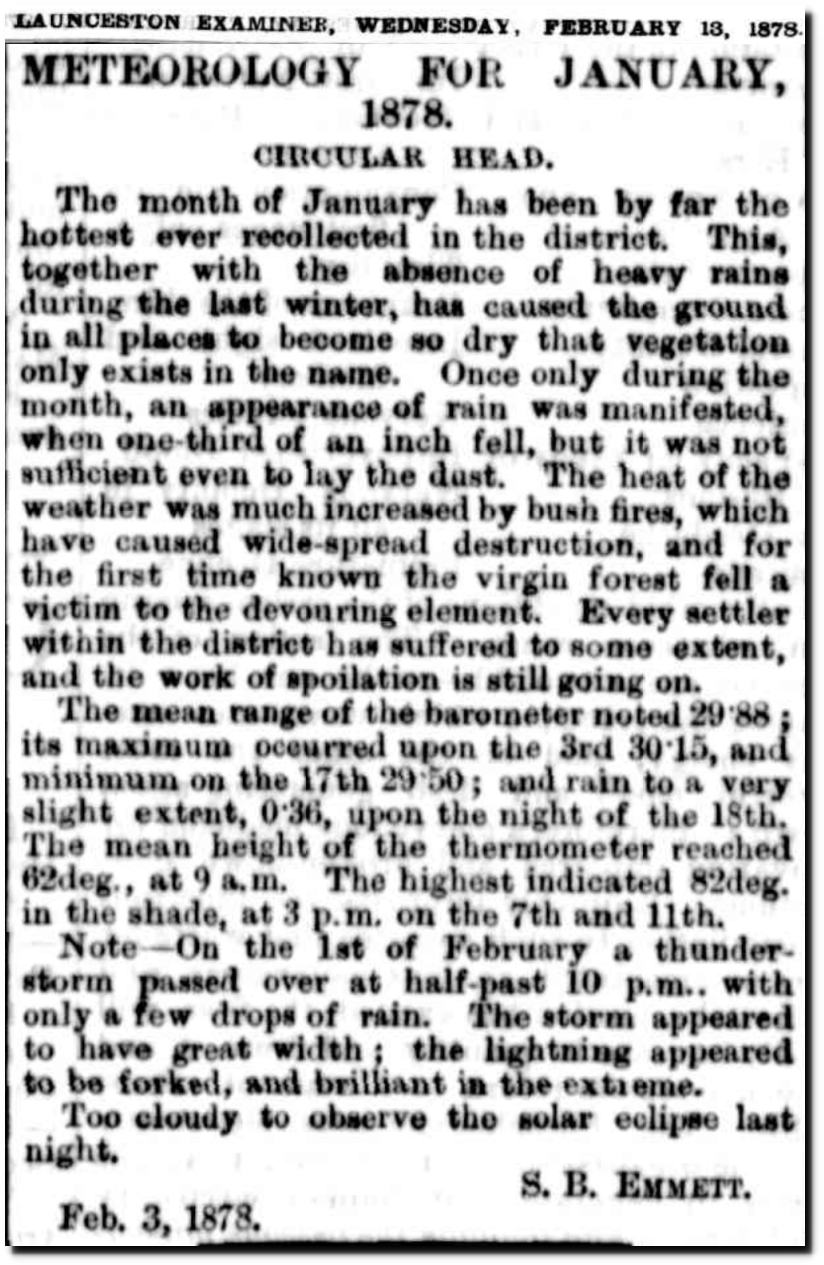
METEOROLOGY FOR JANUARY, 1878.
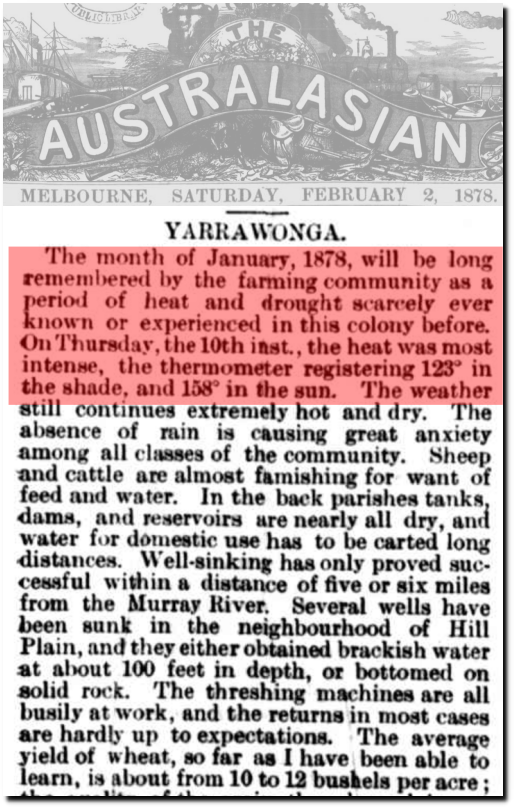
02 Feb 1878 – YARRAWONGA. – Trove
The heat continued into February.
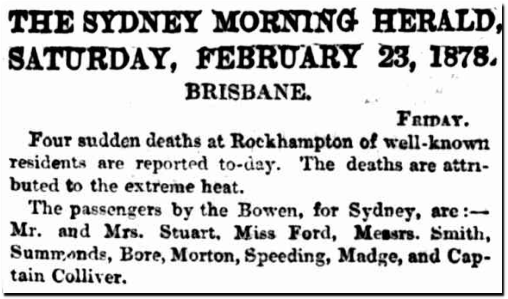
23 Feb 1878 – BRISBANE. – Trove
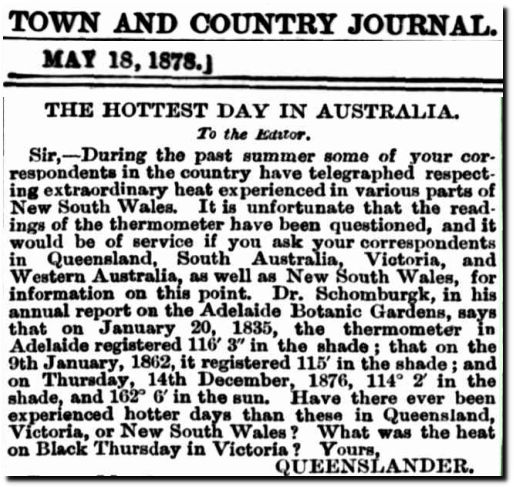
18 May 1878 – THE HOTTEST DAY IN AUSTRALIA. – Trove
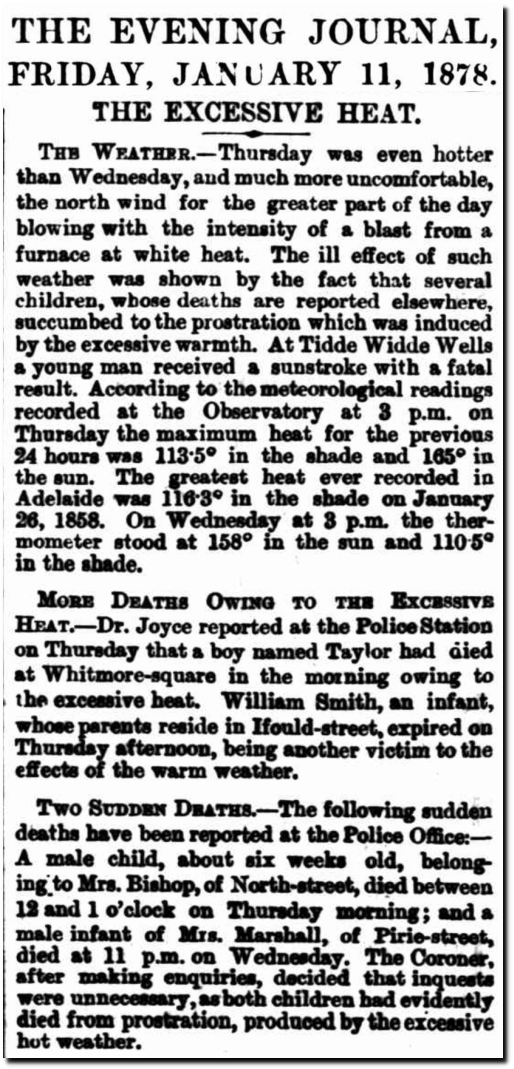
11 Jan 1878 – THE EXCESSIVE HEAT. – Trove
Meanwhile, the US had no winter that year.
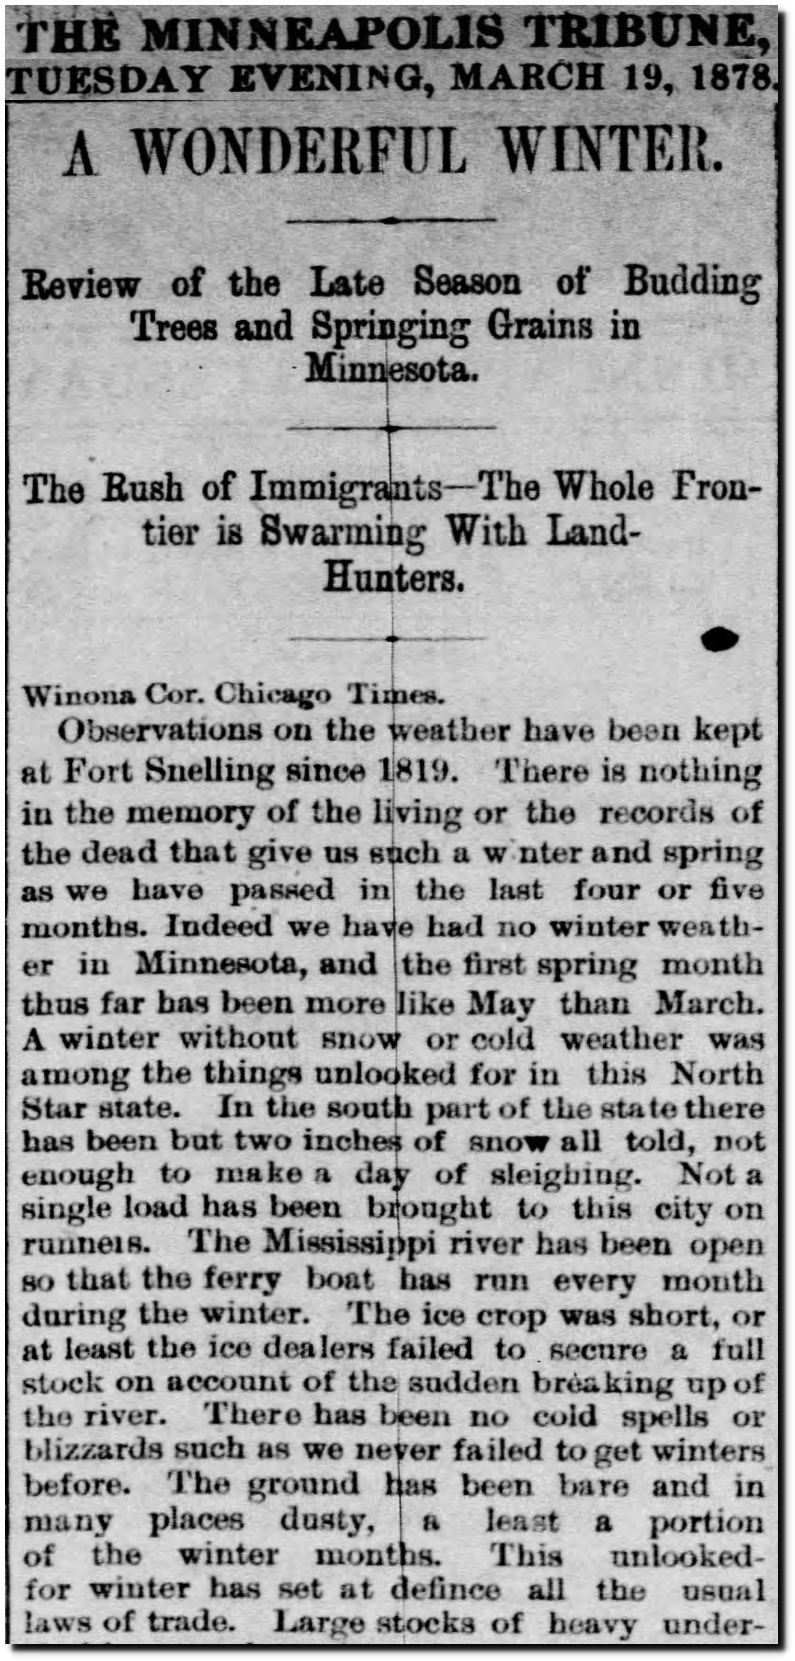
19 Mar 1878, Page 2 – Star Tribune at Newspapers.com
Experts believed that European cannons perturbed the flow of Arctic air.
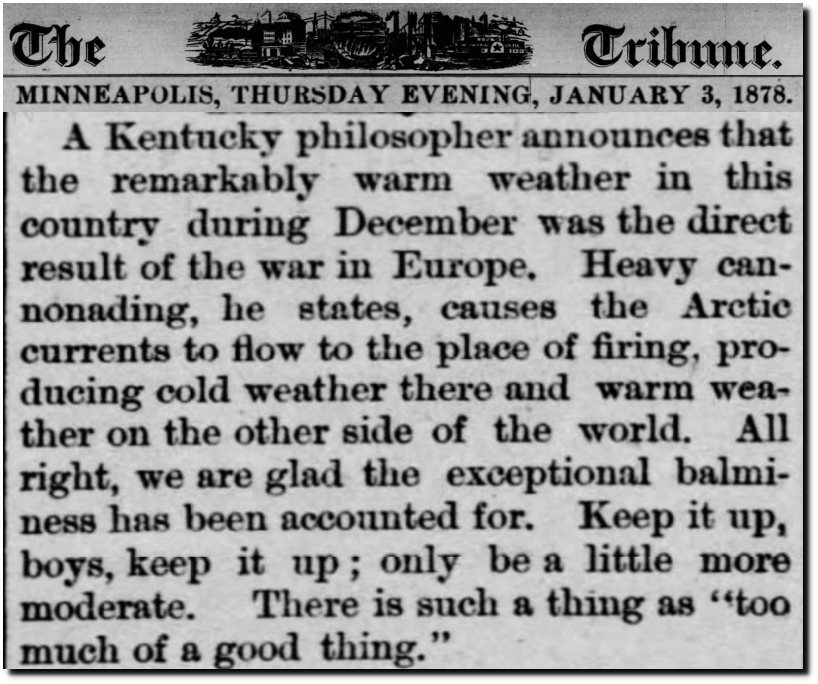
03 Jan 1878, Page 1 – Star Tribune at Newspapers.com
Grasshoppers hatched in Vermont by early March.
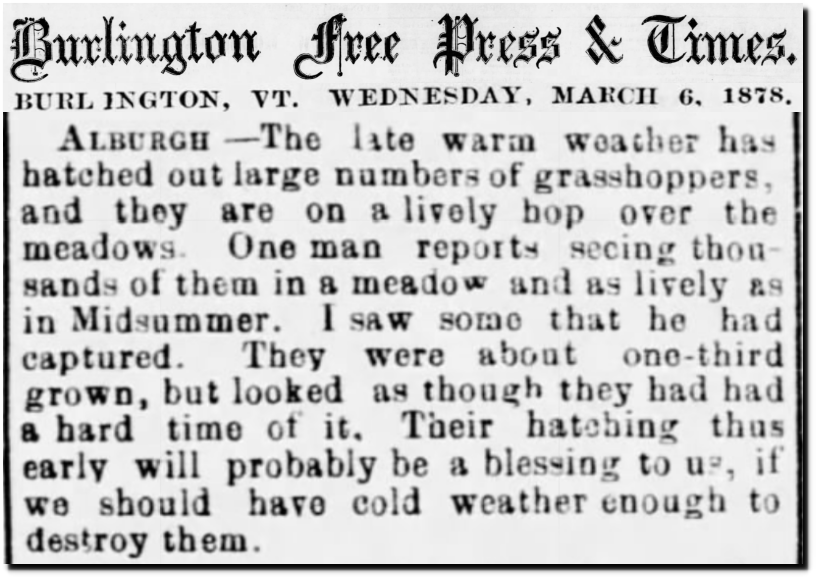
06 Mar 1878, Page 3 – The Burlington Free Press at Newspapers.com
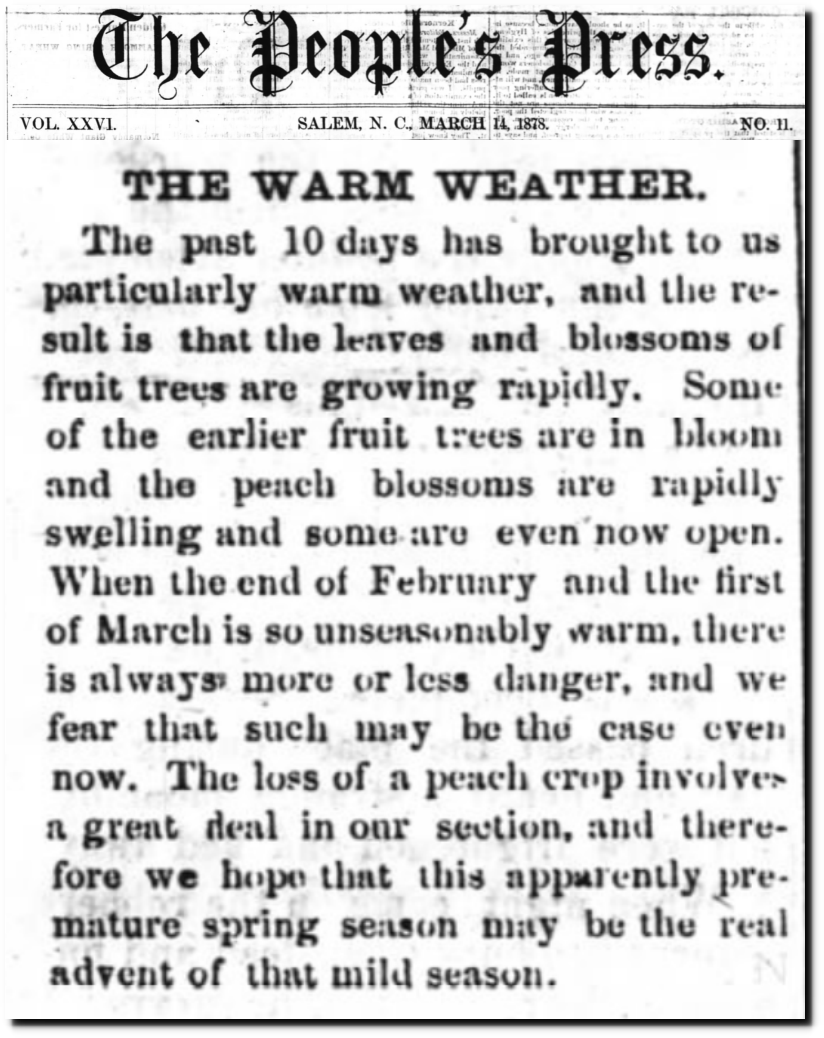
14 Mar 1878, Page 2 – The People’s Press at Newspapers.com
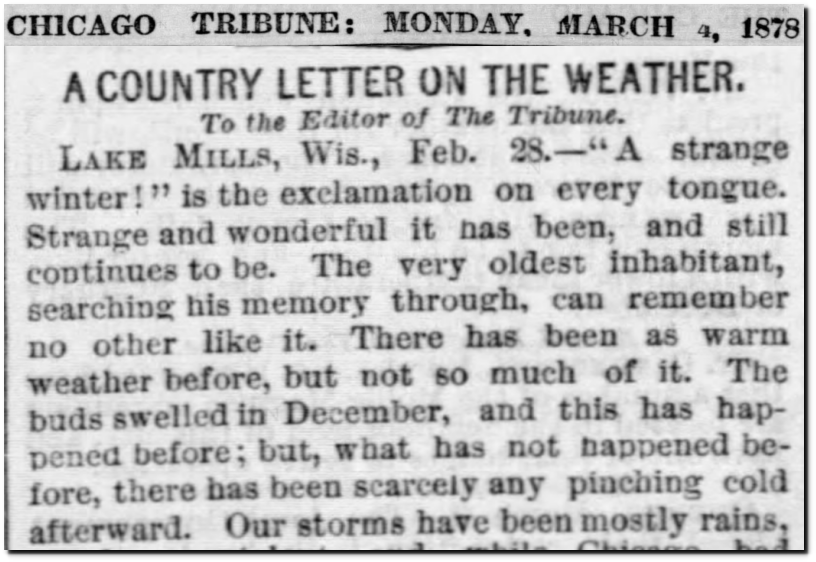
04 Mar 1878, 7 – Chicago Tribune at Newspapers.com
And the summer of 1878 brought record heat to the US.
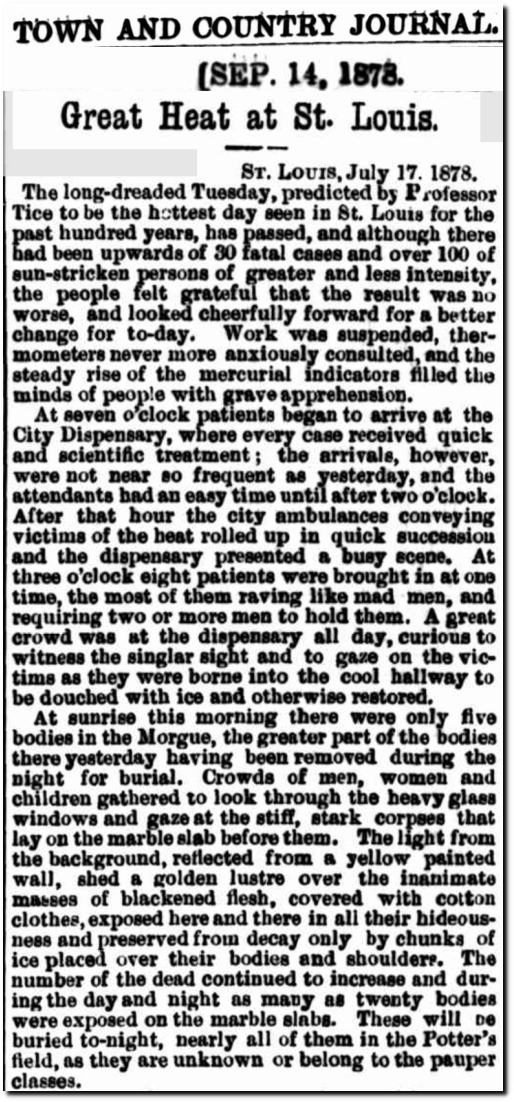
14 Sep 1878 – Great Heat at St. Louis. – Trove
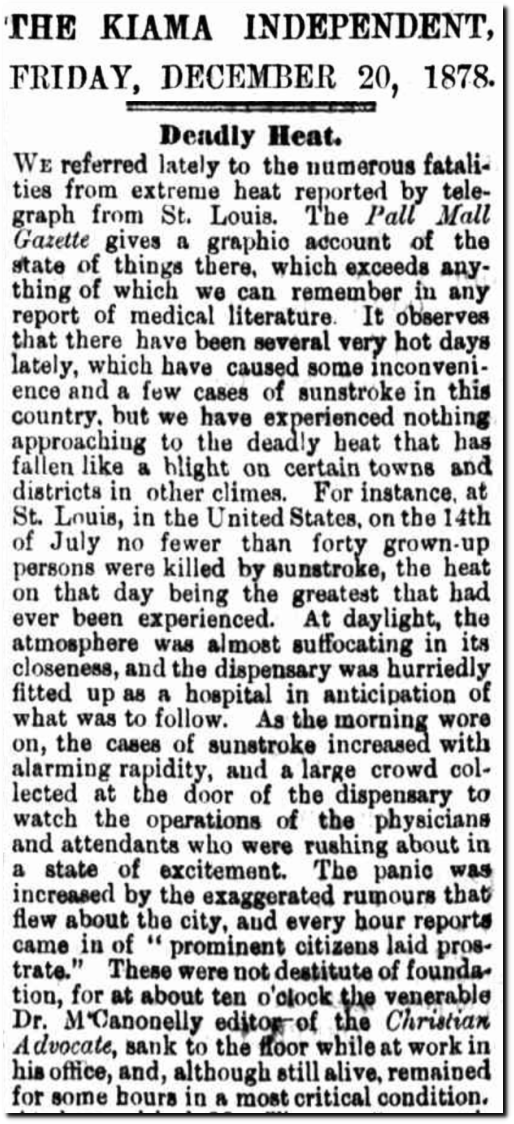
20 Dec 1878 – Deadly Heat. – Trove

18 Jul 1878, 3 – Richwood Gazette at Newspapers.com
This was part of a global drought and famine, which arose from natural variability.
Climatic conditions that caused the Great Drought and Global Famine arose from natural variability
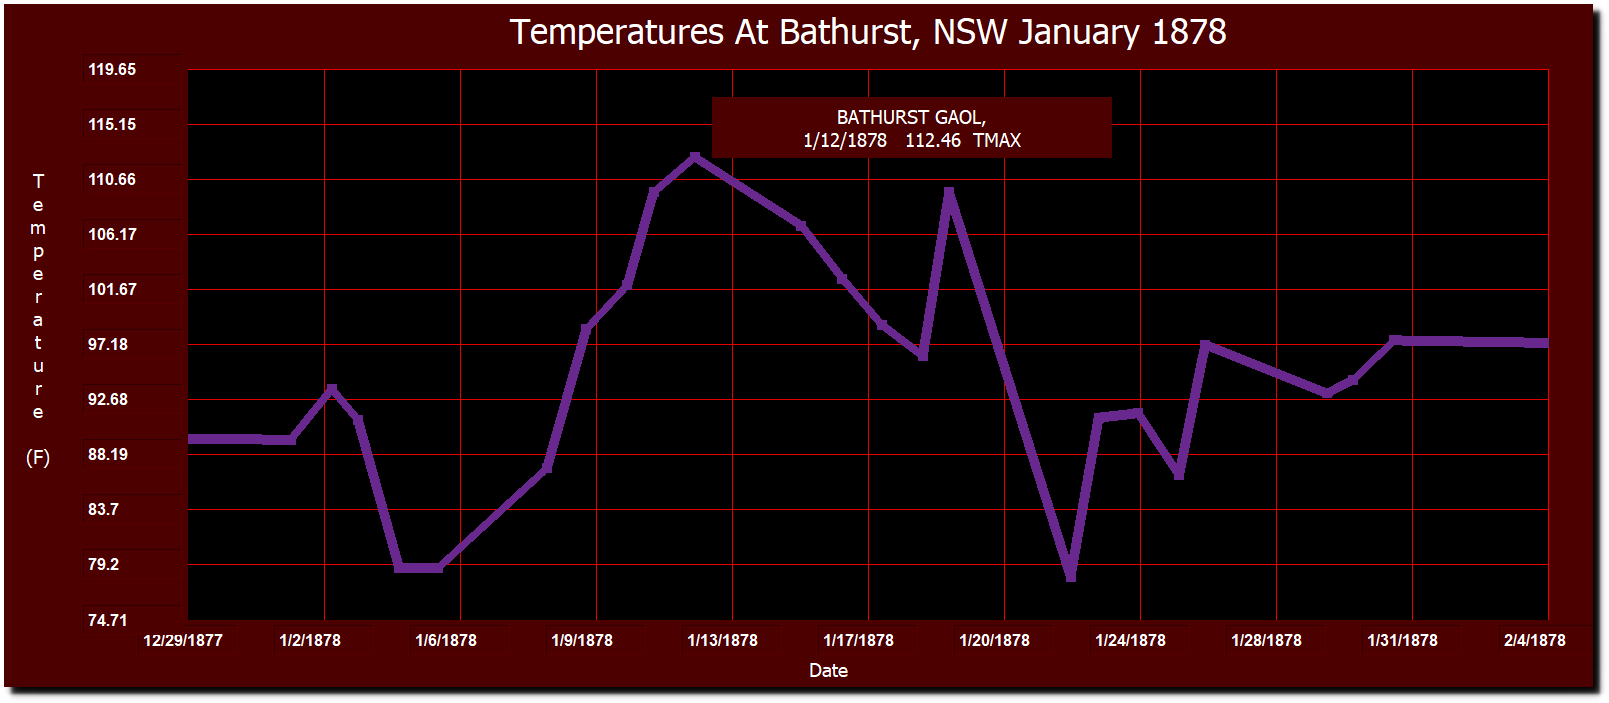
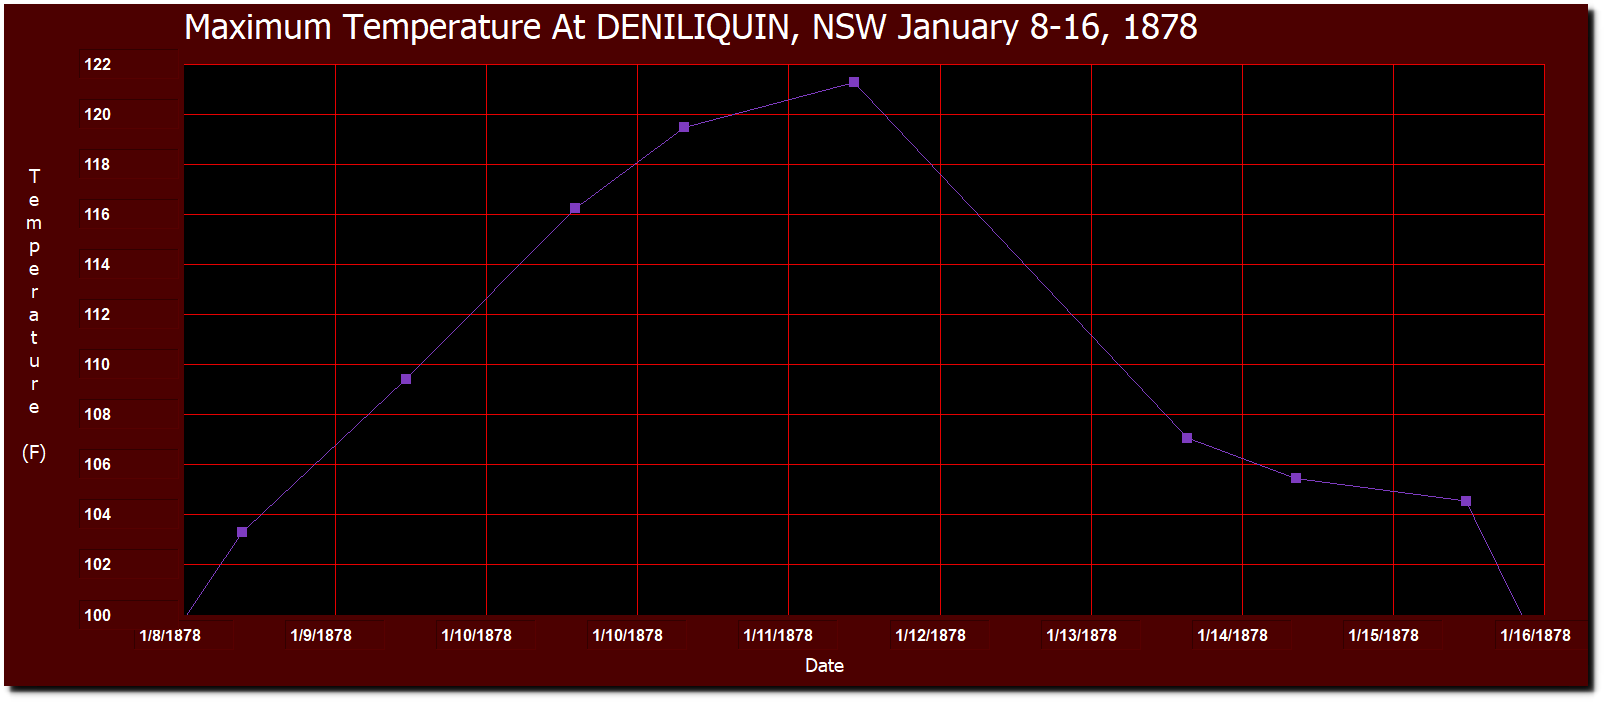
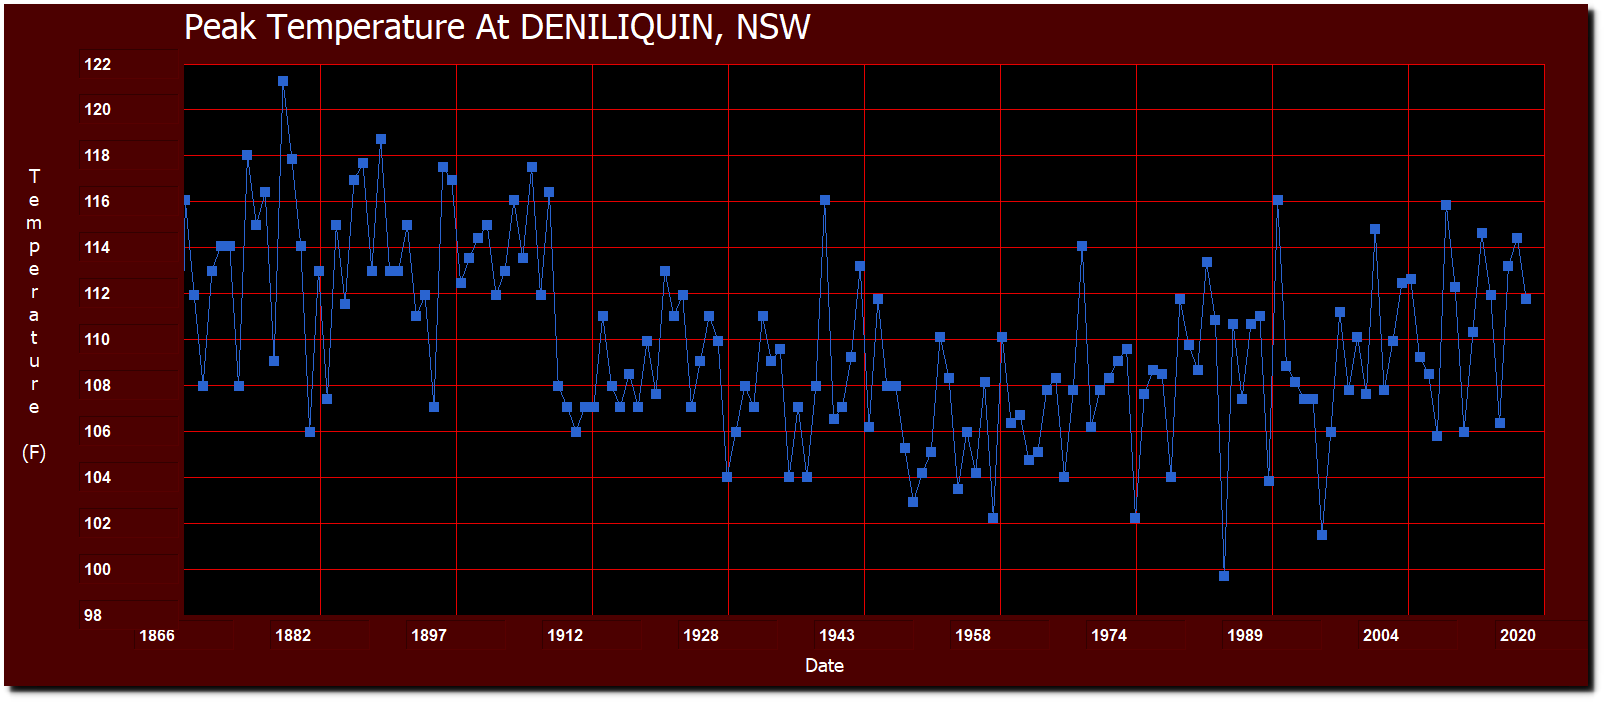
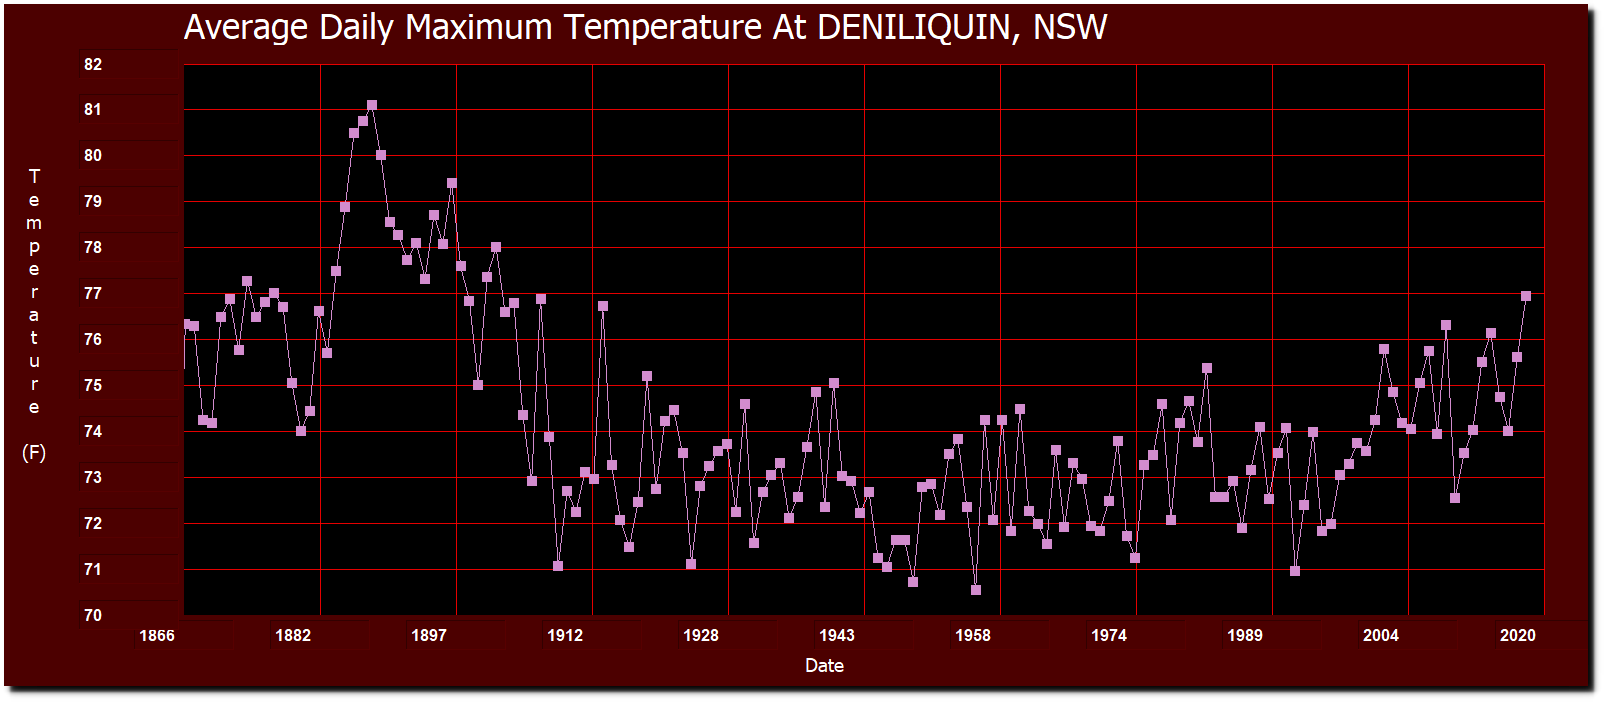
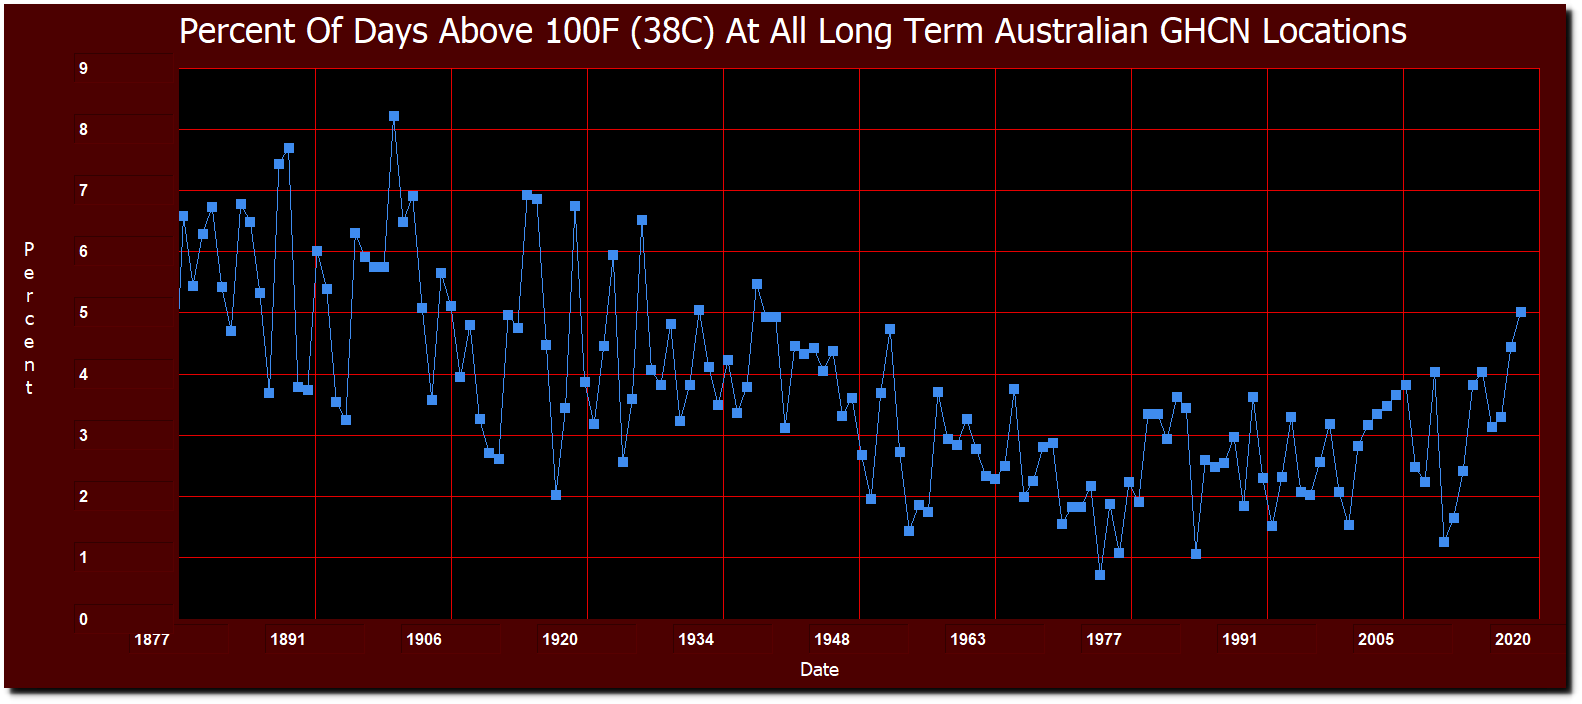
NASA is pushing the idea that CO2 is the control knob, so they hide hot weather from the past – as does the Bureau of Meteorology in Australia. Deniliquin, NSW had their hottest day of 121F on January 12, 1878 – during a nine day stretch in which they averaged 111F.
Australia used to have a lot more hot weather than they do now, so BOM hides all data before 1910 in their Australian temperature graphs.
The people who went to the moon want NASA climate fraud stopped. We can help them out by spreading awareness of what is happening – and getting the public to purge climate scamsters from government.
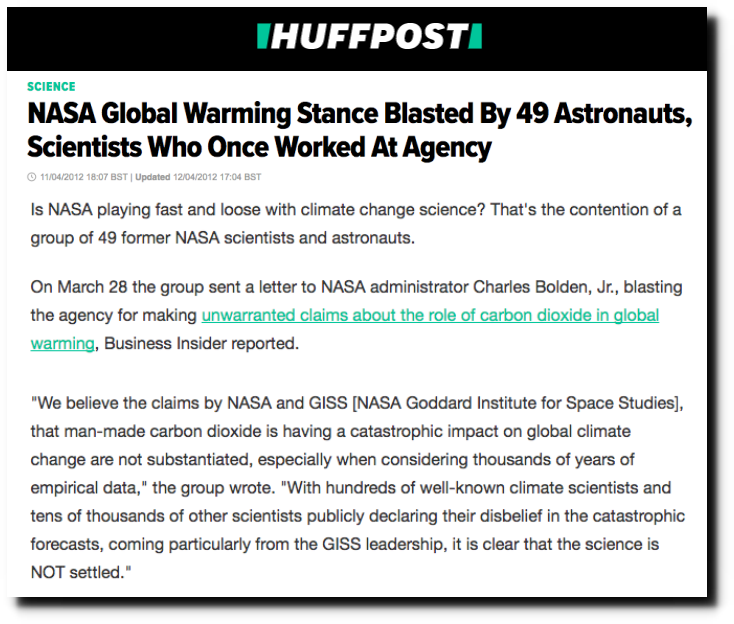
NASA Global Warming Stance Blasted By 49 Astronauts, Scientists Who Once Worked At Agency
Posted in Uncategorized
Leave a comment