
Disrupting the Borg is expensive and time consuming!

Google Search
-
Recent Posts
- One Atomic Bomb Per Hour
- New Video : Analyzing Oil And Gas
- Is Antarctica Melting?
- High Speed Analysis And Visualization
- El Nino To The Rescue?
- Fake News Update
- Growth Of Antarctic Sea Ice
- 65 Years Of Progress!
- El Nino To The Rescue?
- Worst March Drought On Record
- ChartGL Process Control Demo
- The Biggest Money Laundering Scam
- Drought In The Headwaters Of Lake Powell
- Unrealistic Expectations Of Water Availability
- Did Bill Gates Do This?
- Worst March Drought On Record In The US
- The Real Hockey Stick Graph
- Analyzing The Western Water Crisis
- Gaslighting 1924
- “Why Do You Resist?”
- Climate Attribution Model
- Fact Checking NASA
- Fact Checking Grok
- Fact Checking The New York Times
- New Visitech Features
Recent Comments
- Gordon Vigurs on One Atomic Bomb Per Hour
- Gordon Vigurs on One Atomic Bomb Per Hour
- Gordon Vigurs on One Atomic Bomb Per Hour
- Bob G on One Atomic Bomb Per Hour
- Robertvd on One Atomic Bomb Per Hour
- czechlist on One Atomic Bomb Per Hour
- conrad ziefle on One Atomic Bomb Per Hour
- conrad ziefle on One Atomic Bomb Per Hour
- D. Boss on One Atomic Bomb Per Hour
- D. Boss on One Atomic Bomb Per Hour
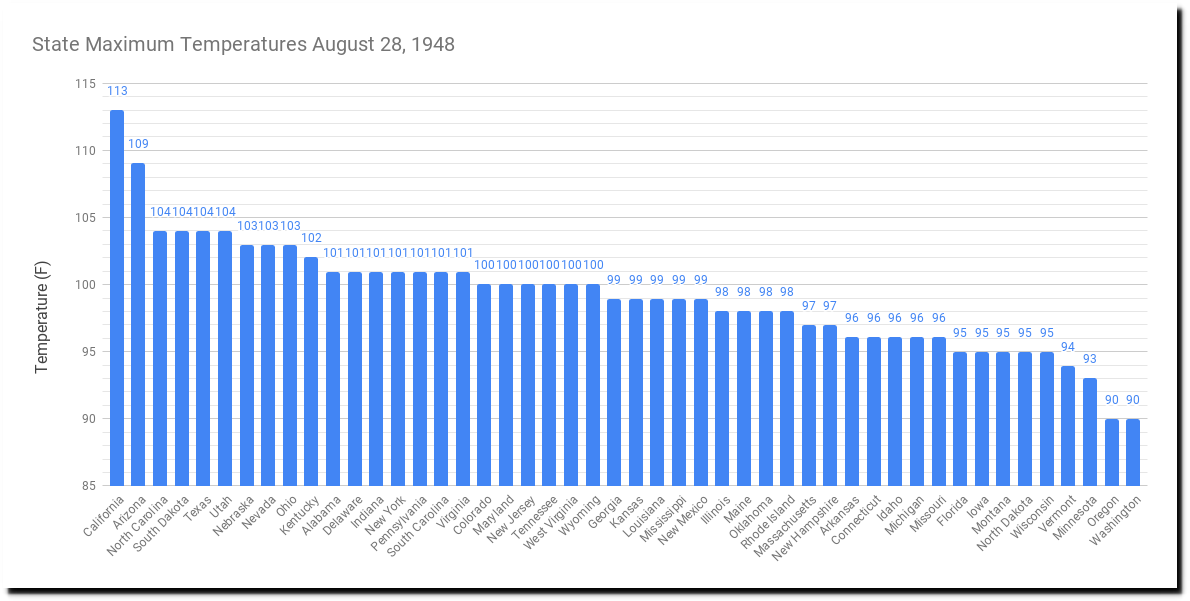
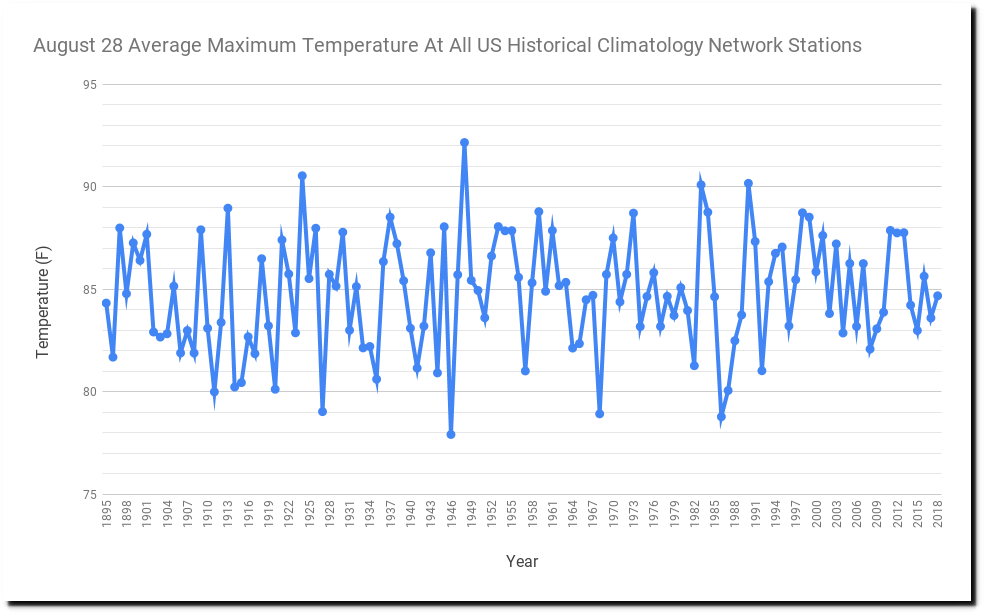
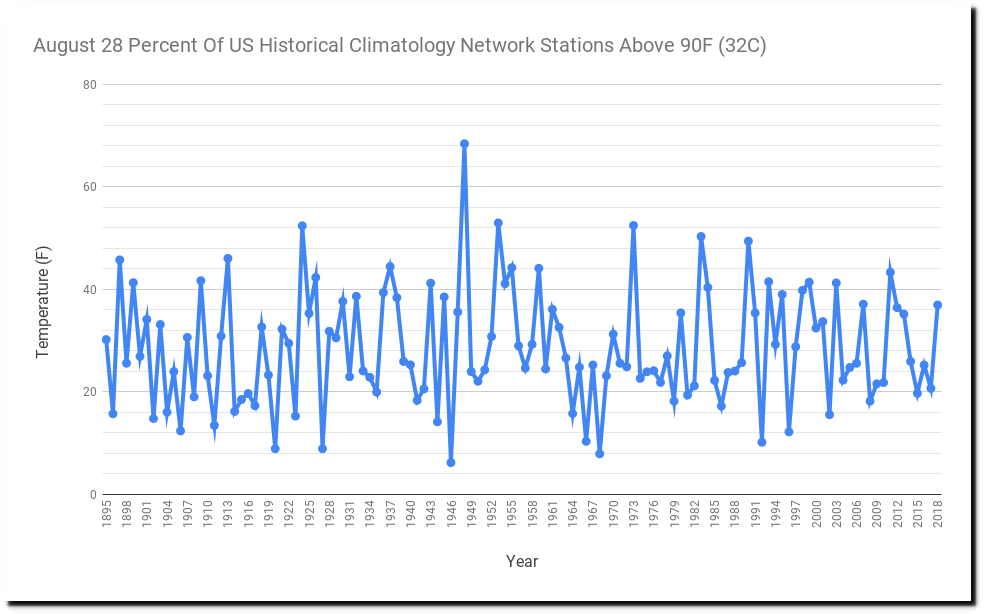
August 28, 1948 – Every State Above 90F
On August 28, 1948, every state was over 90 degrees, and 68% of USHCN stations were over 90 degrees. Twenty-three states were over 100 degrees. Heat like that is incomprehensible now, and if it did happen – climate experts would declare 97% certainly that it couldn’t have happened at the low CO2 levels of 1948.
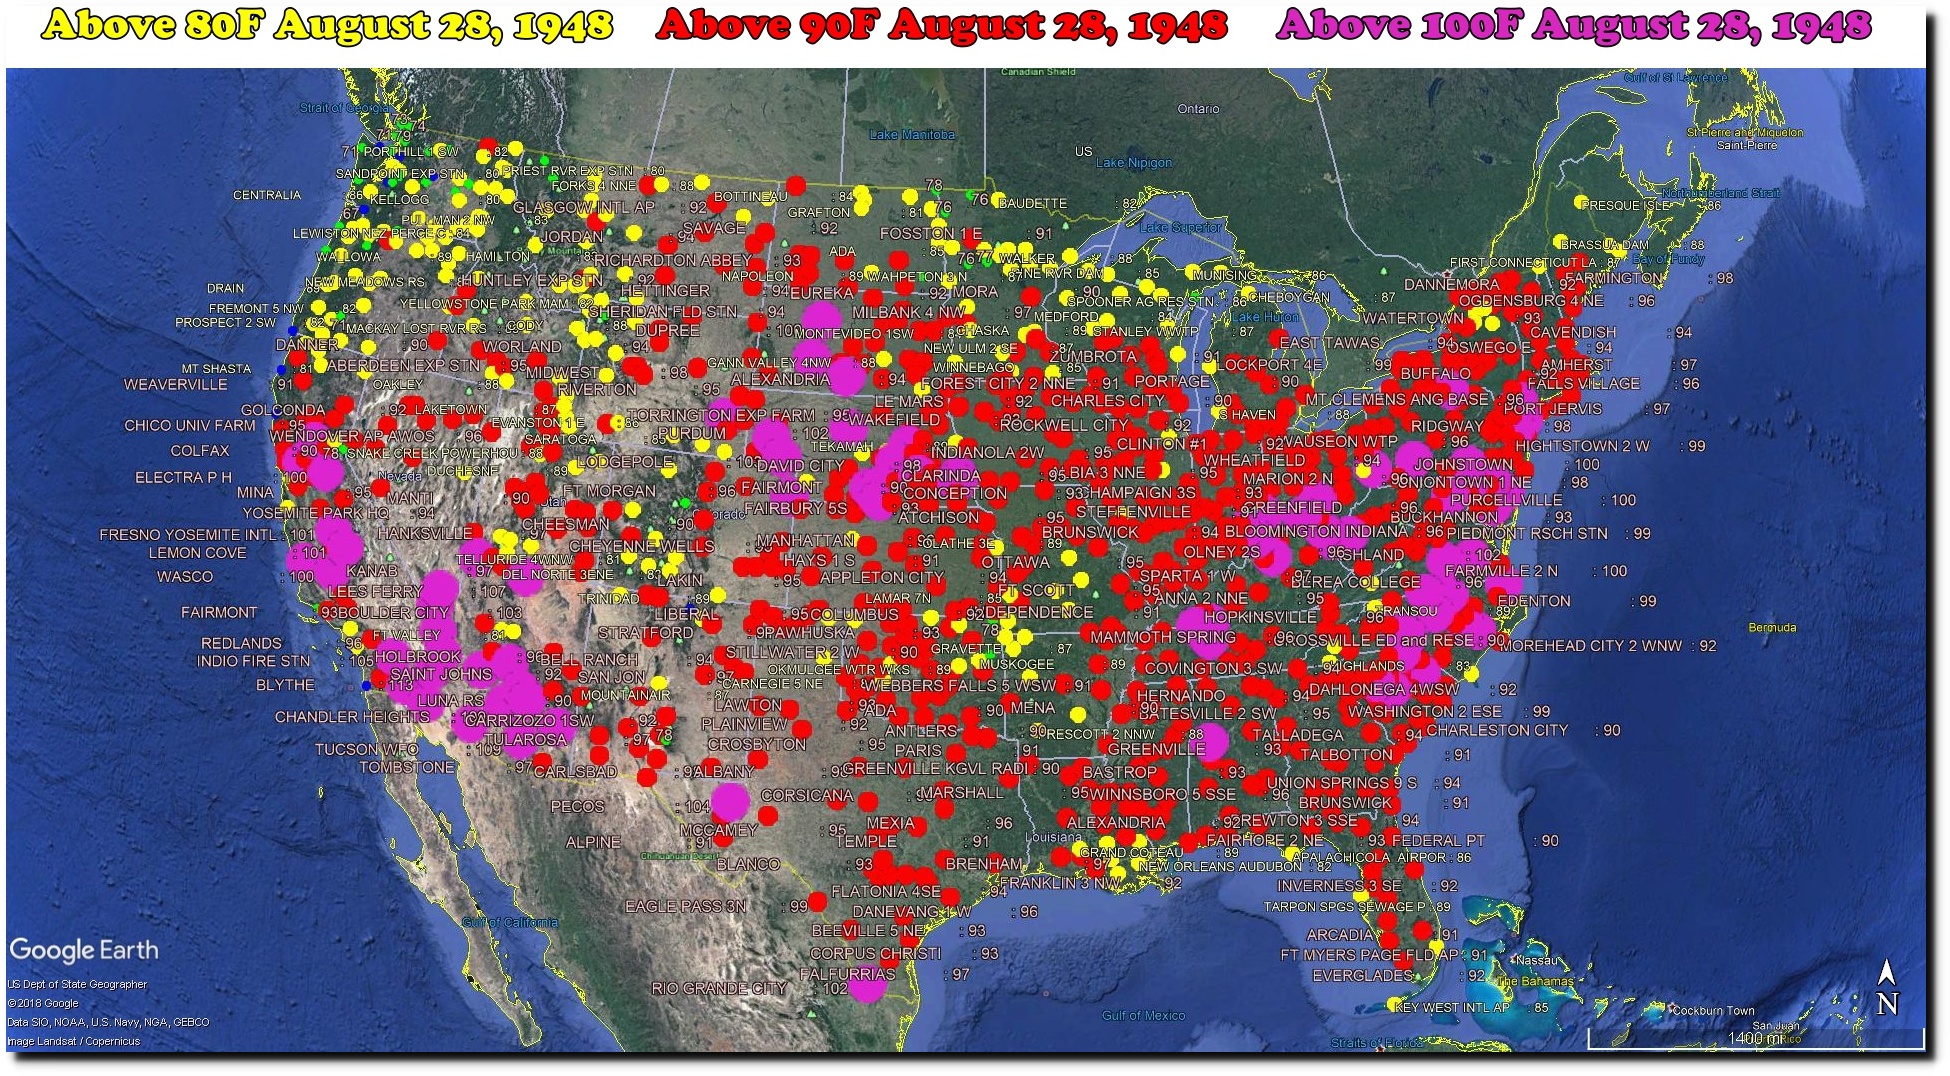

28 Aug 1948, 1 – The Lincoln Star at Newspapers.com
Posted in Uncategorized
Leave a comment
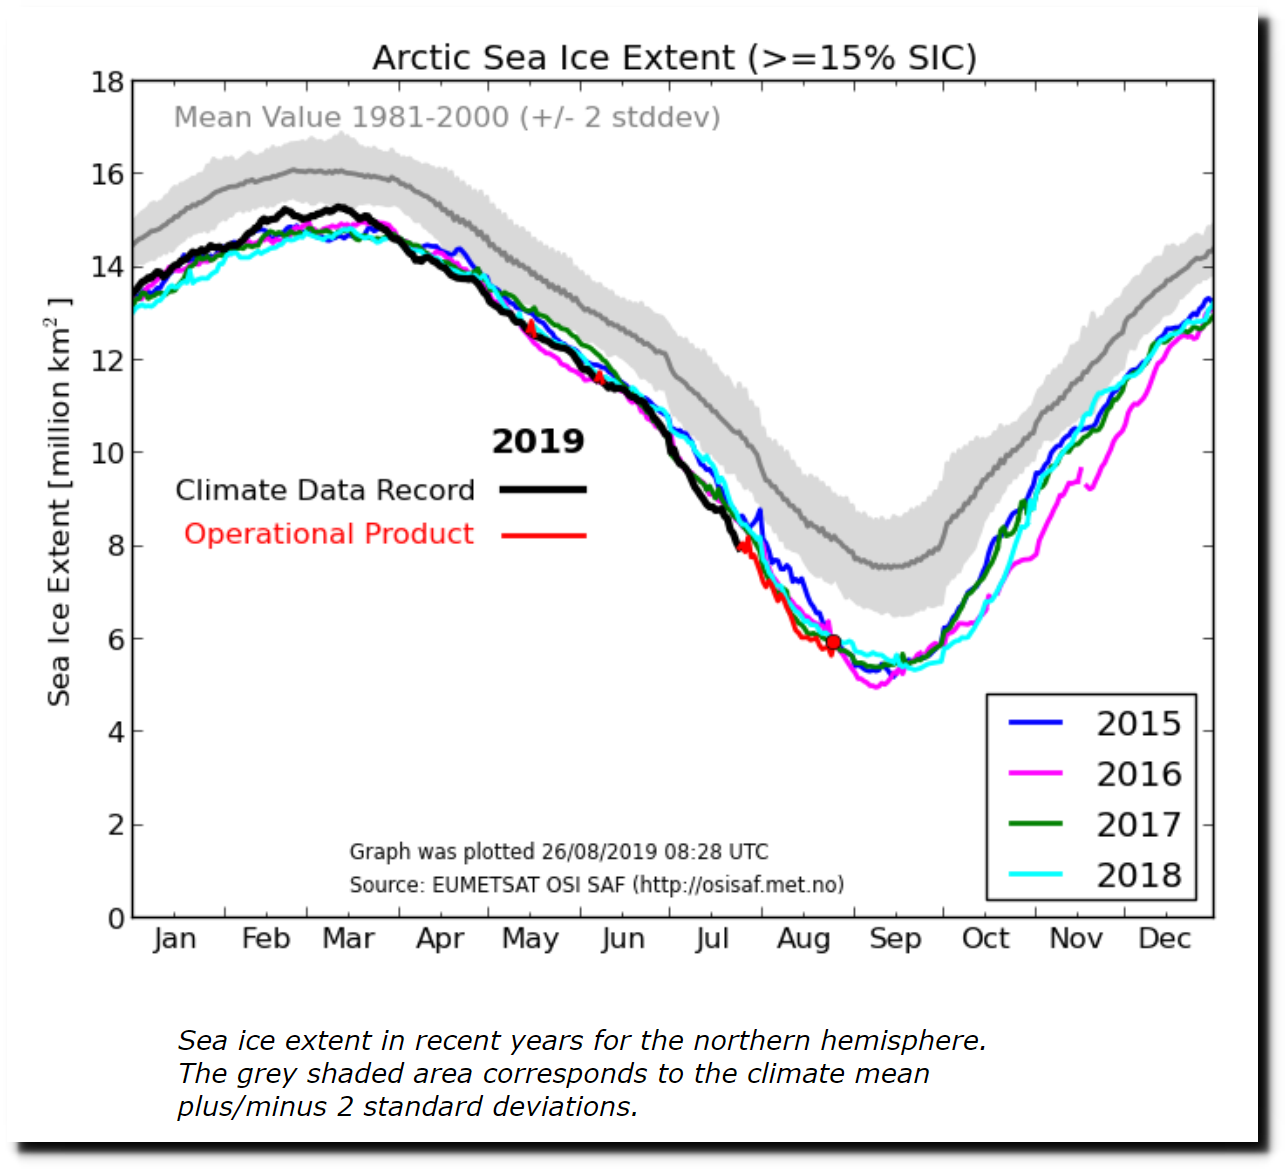
No Change In Arctic Ice Extent Over The Past Week
This may turn out to be the shortest melt season on record.
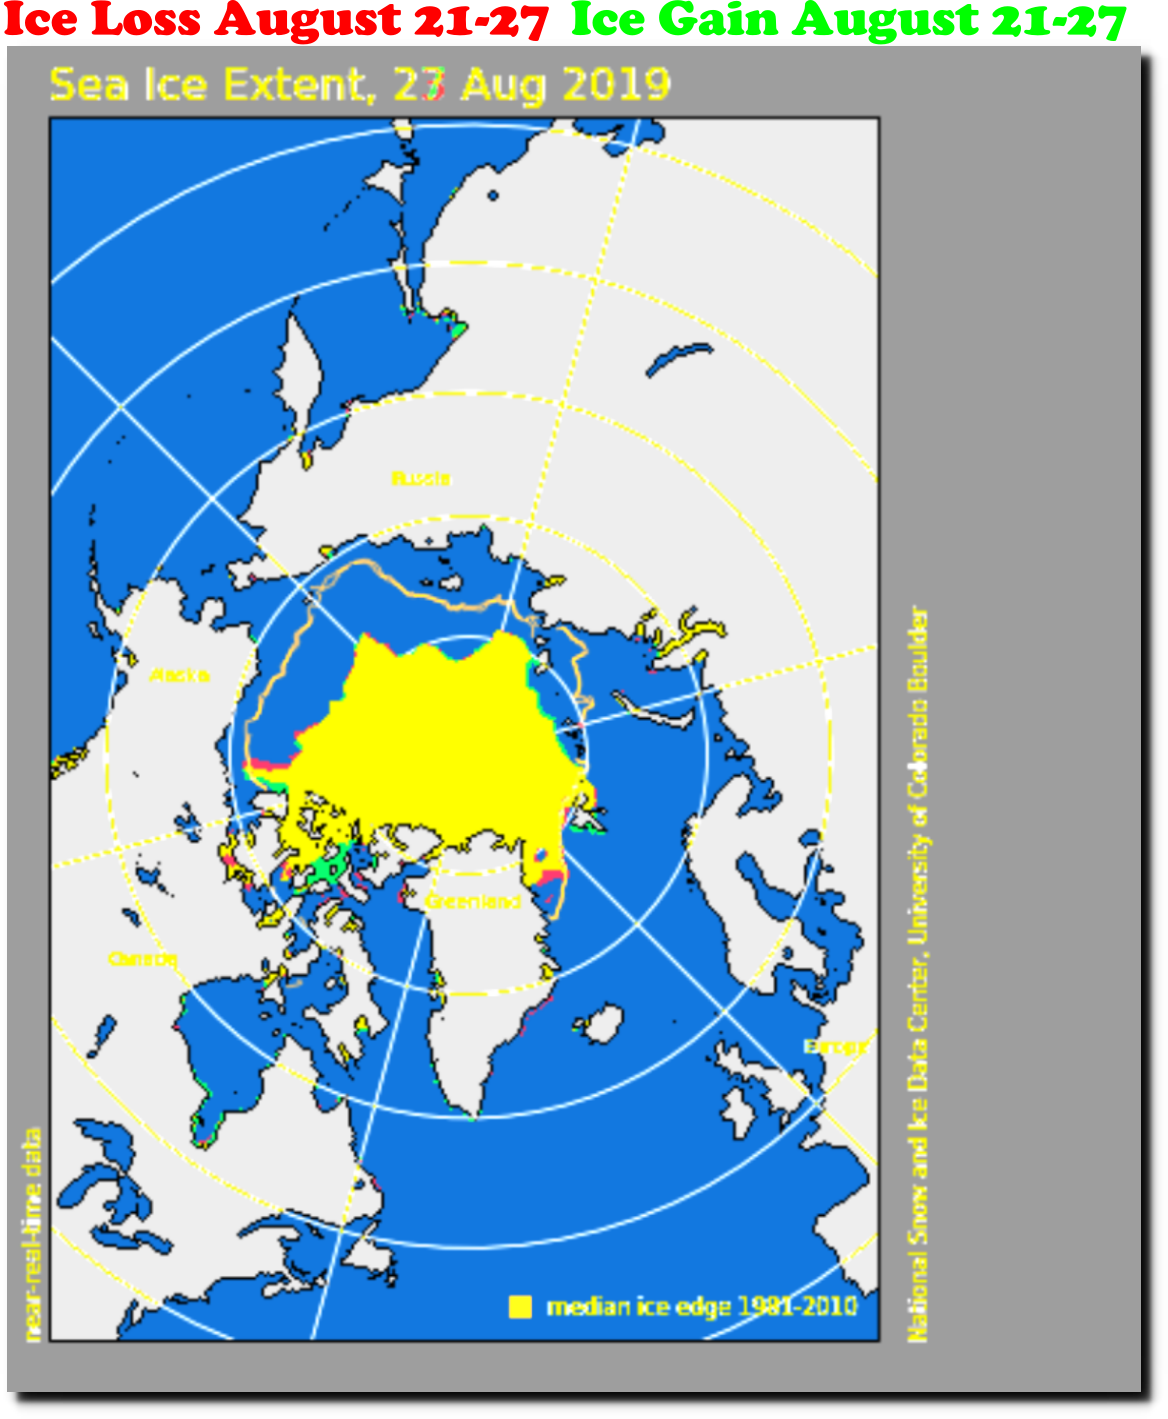
Index of /DATASETS/NOAA/G02135/north/daily/images/2019/08_Aug/
Ocean and Ice Services | Danmarks Meteorologiske Institut
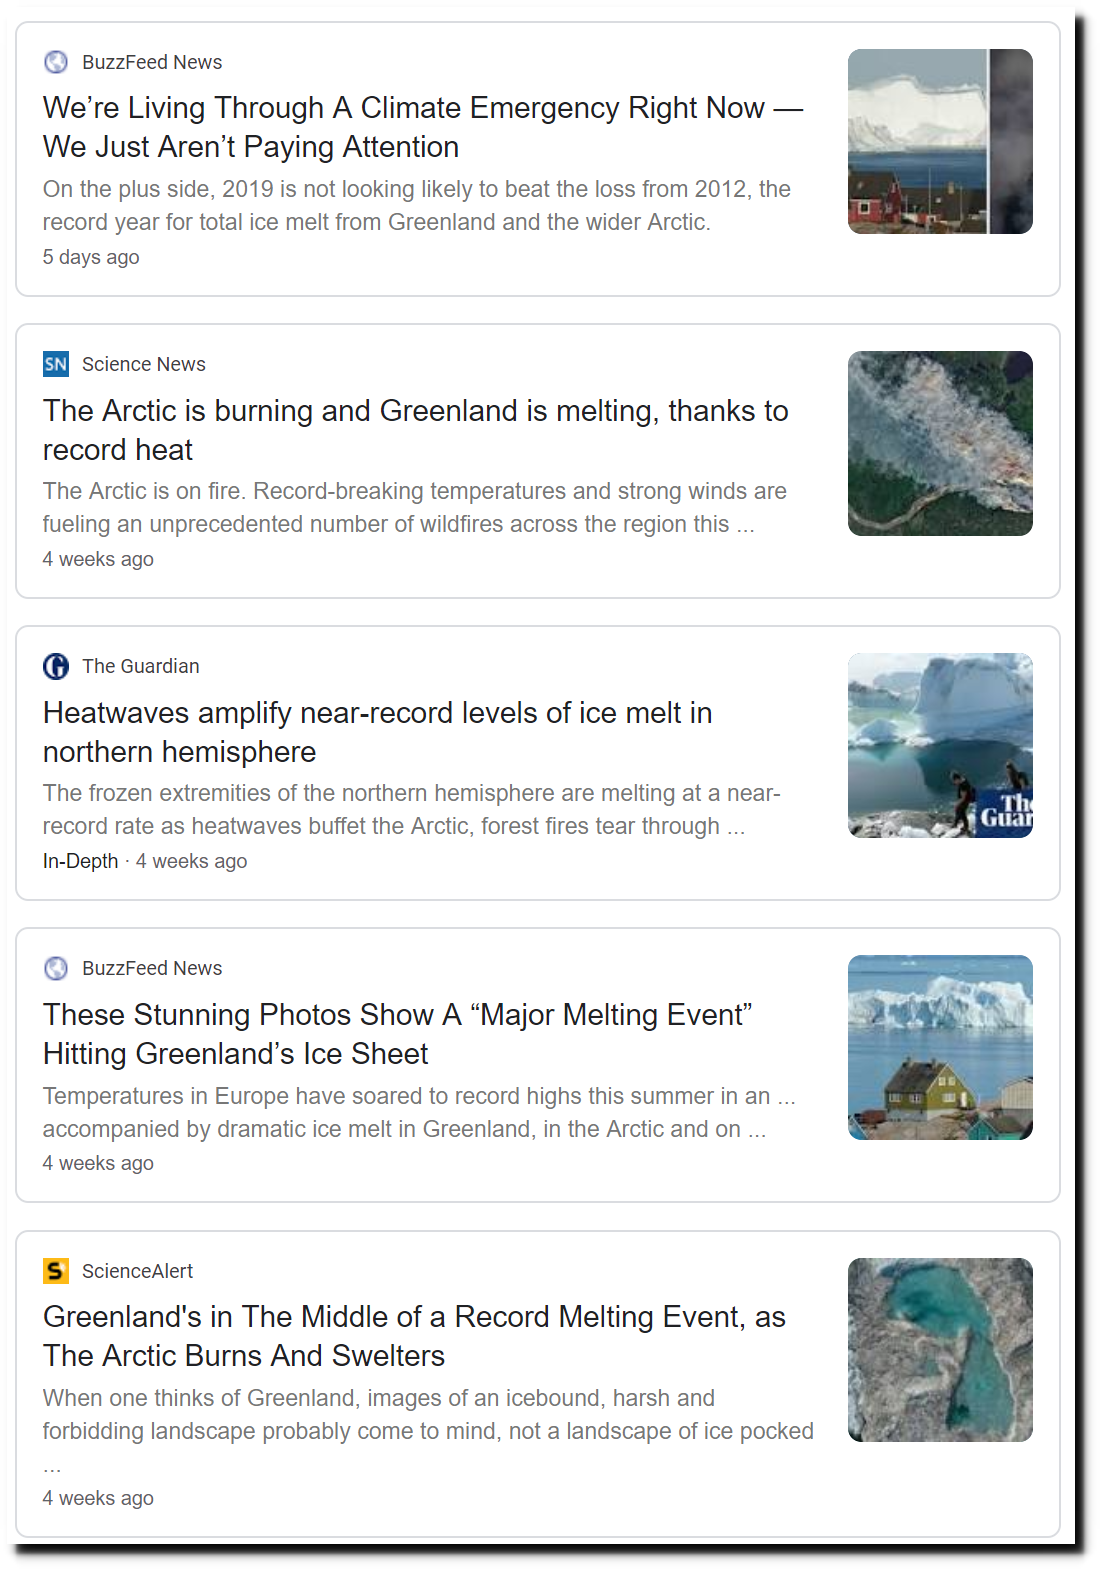
Meanwhile, climate alarmists ramp up the hysteria in their imaginary alternate reality …
Posted in Uncategorized
Leave a comment
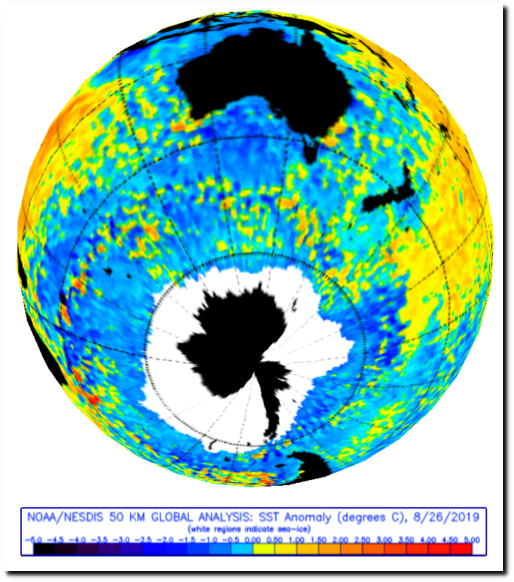
Shrinking Down The Rabbit Hole
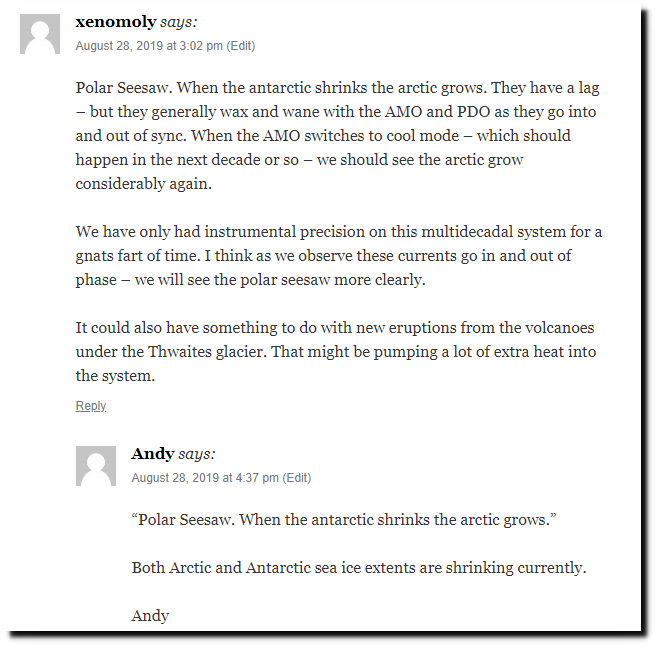
“xenomoly” is correct. The Arctic and Antarctic trends move opposite each other.
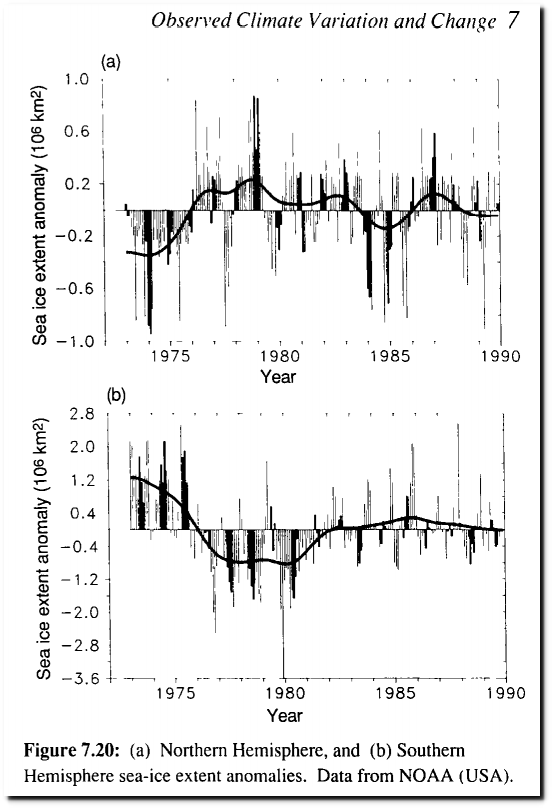
During the summer of 1976, almost all of the sea ice around Antarctica melted.
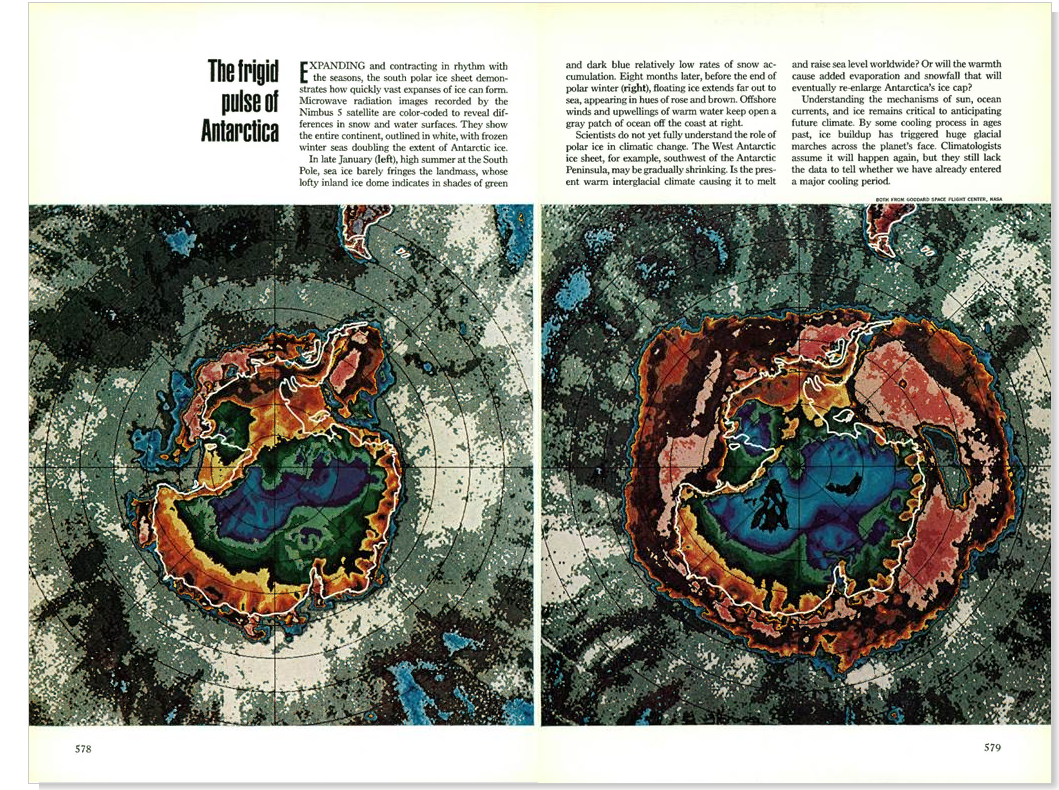
The National Geographic Archive | November 1976 | page 1
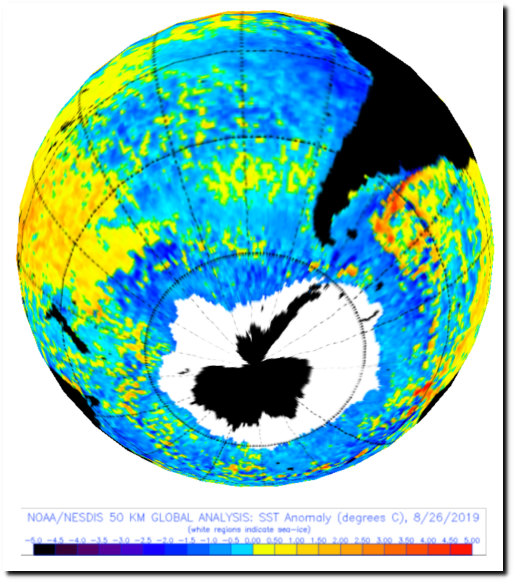
But this is what “shrinking” looks like to “Andy”.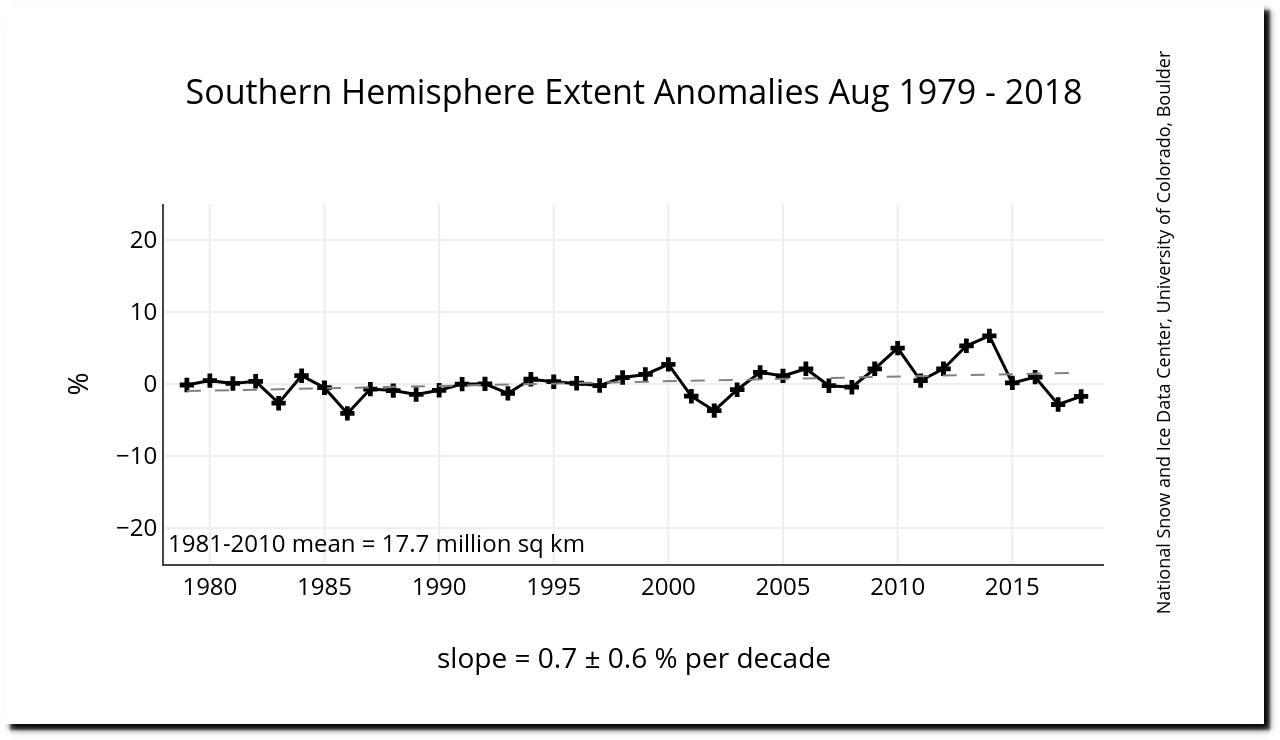
NOAA/G02135/south/monthly/images/08_Aug/S_08_extent_anomaly_plot_hires_v3.0.png
Antarctic sea ice extent is very close to the 1979-1990 average.
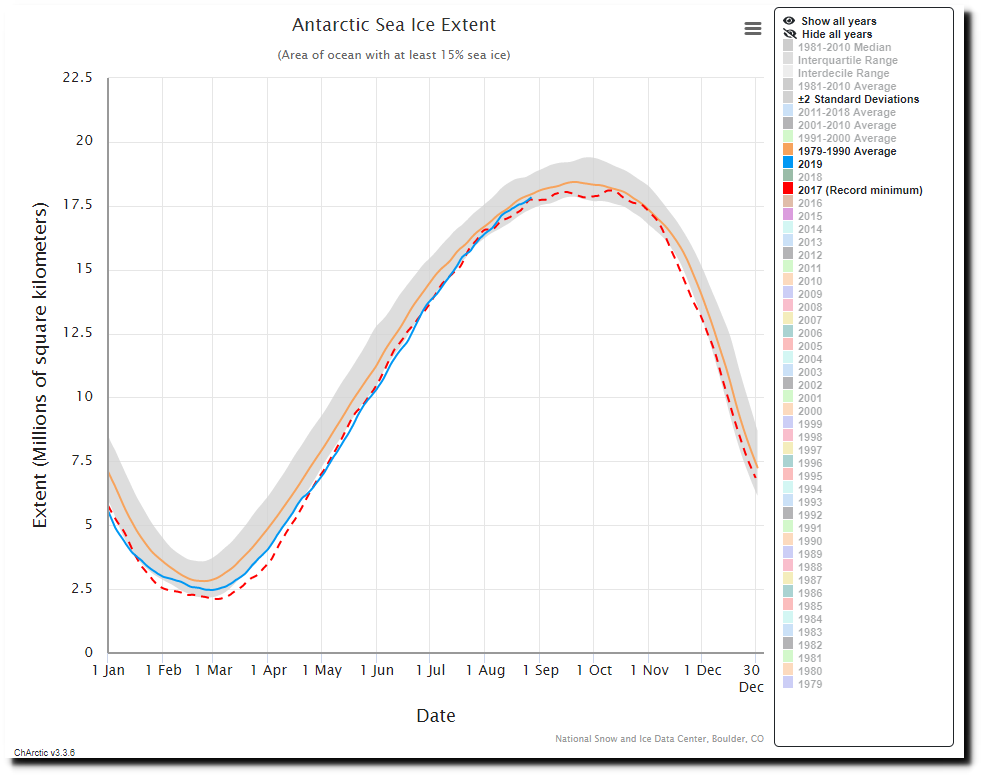
Charctic Interactive Sea Ice Graph | Arctic Sea Ice News and Analysis
Posted in Uncategorized
Leave a comment
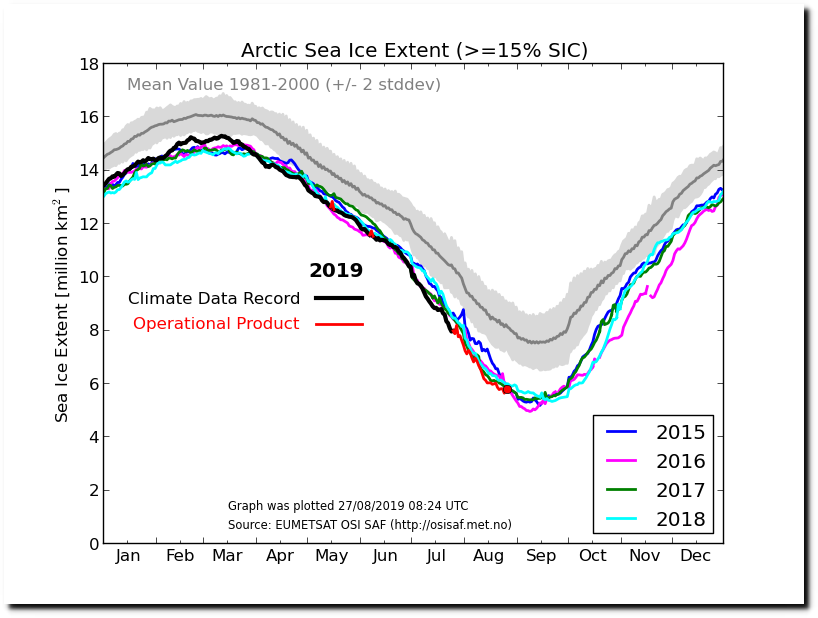
Nothing Happening In The Arctic
I’ve been pointing out for several weeks that there is little melt happening in the Arctic, and official graphs are starting to catch up with reality.
Posted in Uncategorized
Leave a comment
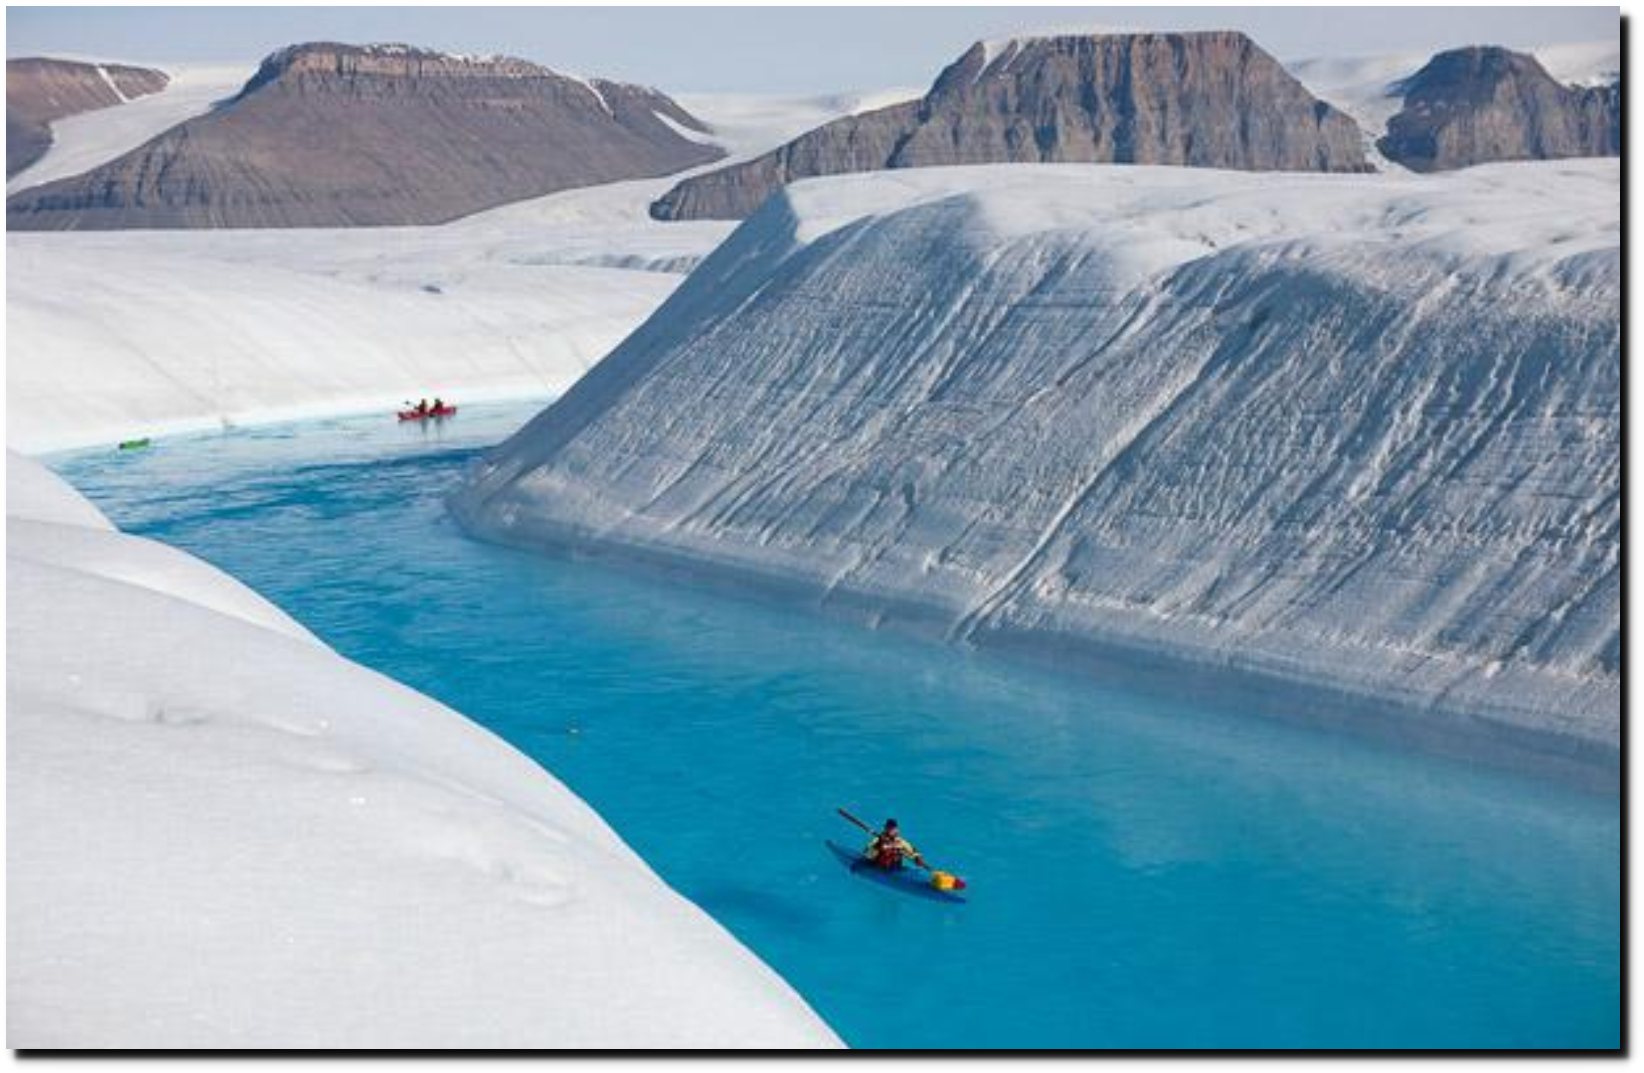
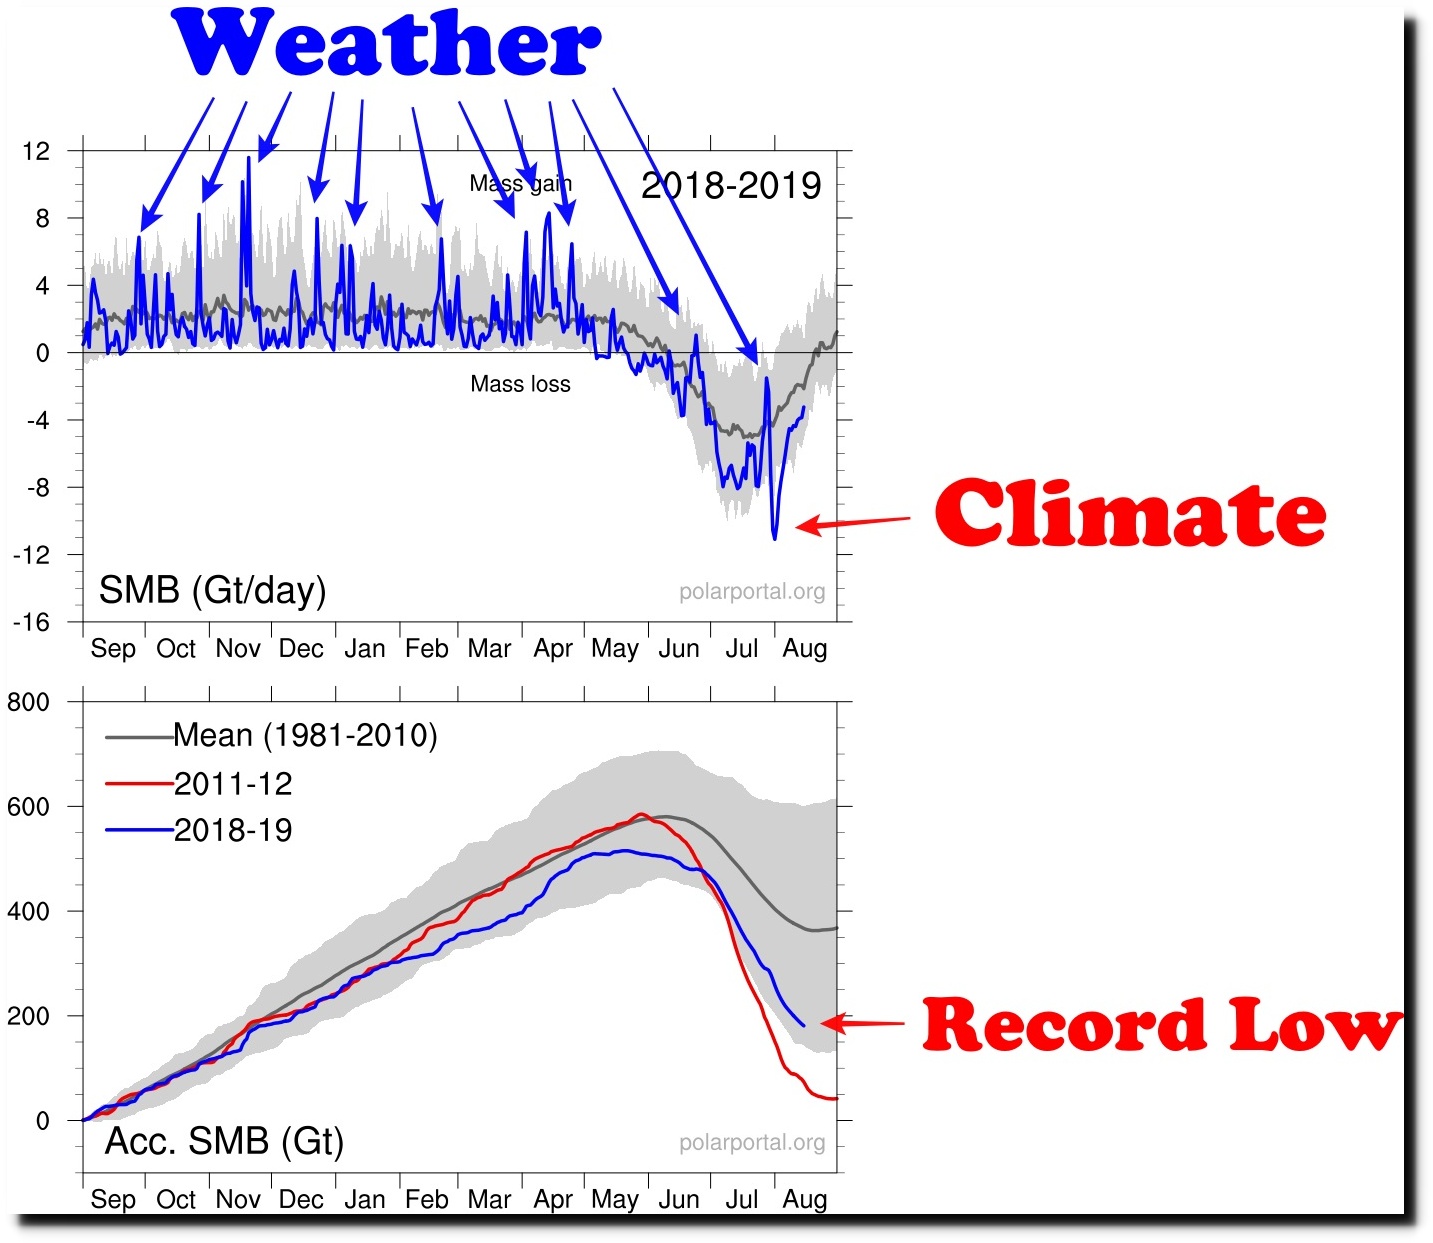
Greenland Propaganda Meltdown
Seth Borenstein has taken Greenland propaganda to an impressive new level.
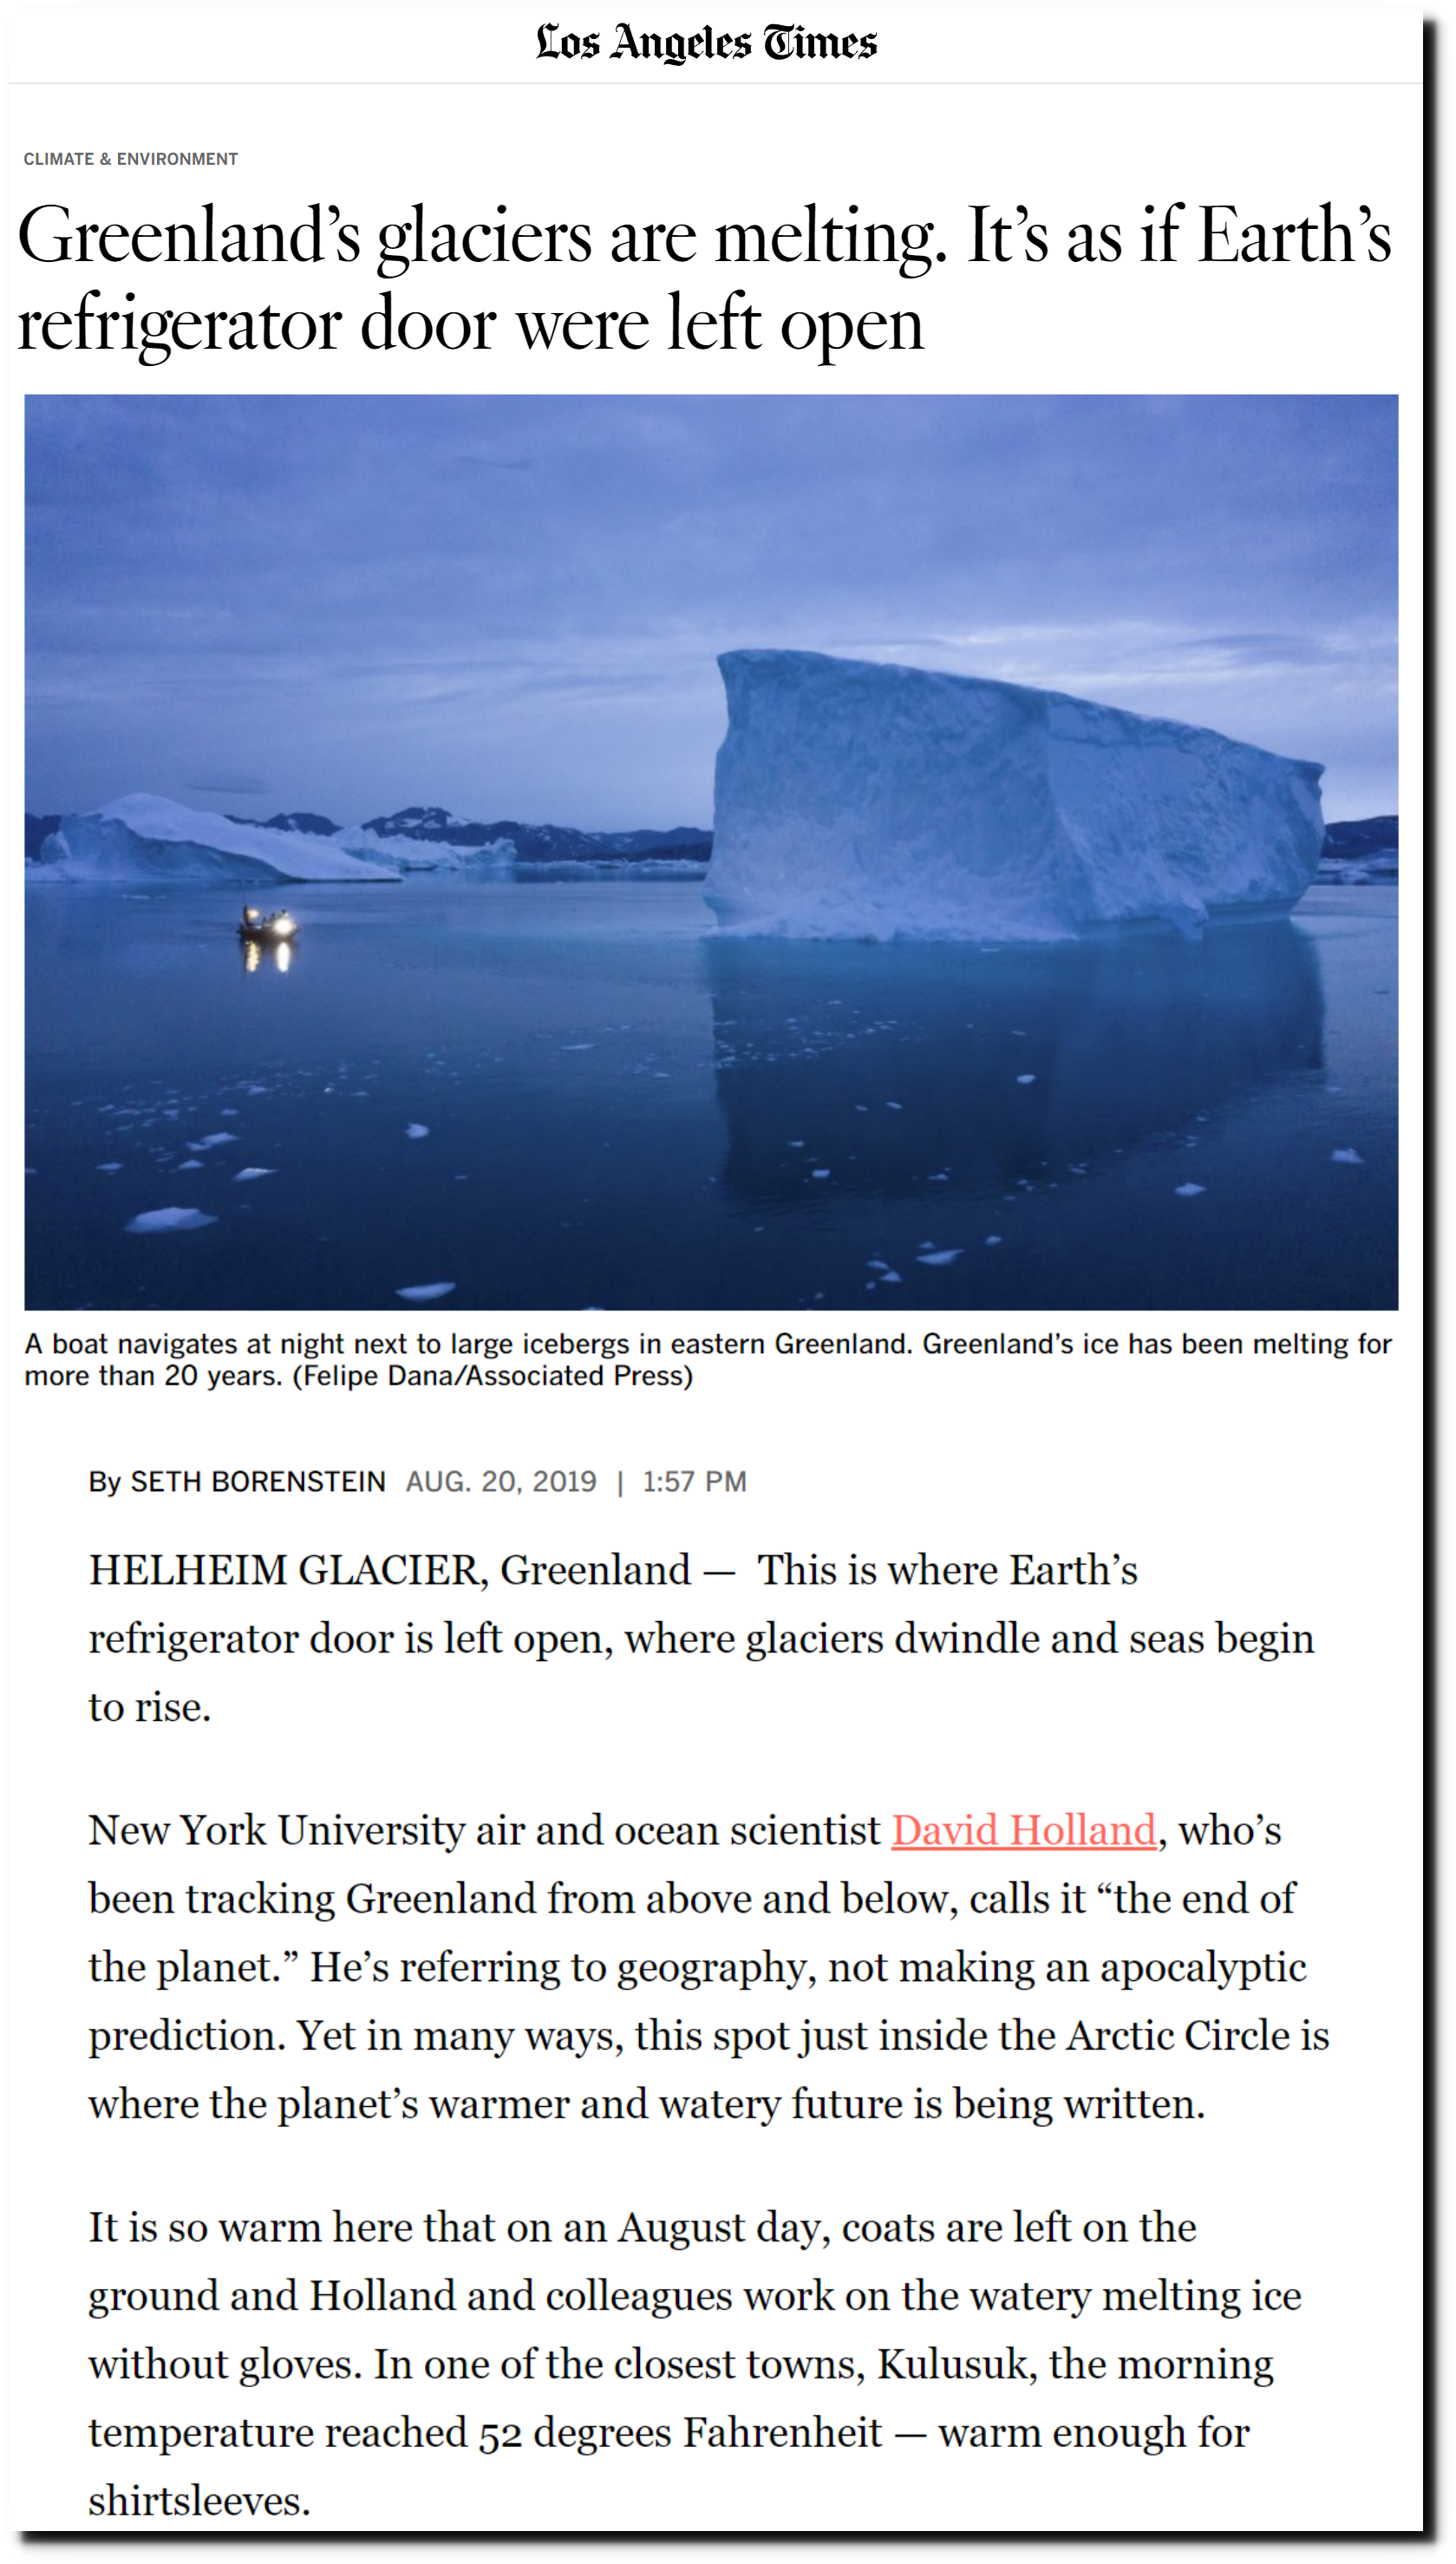

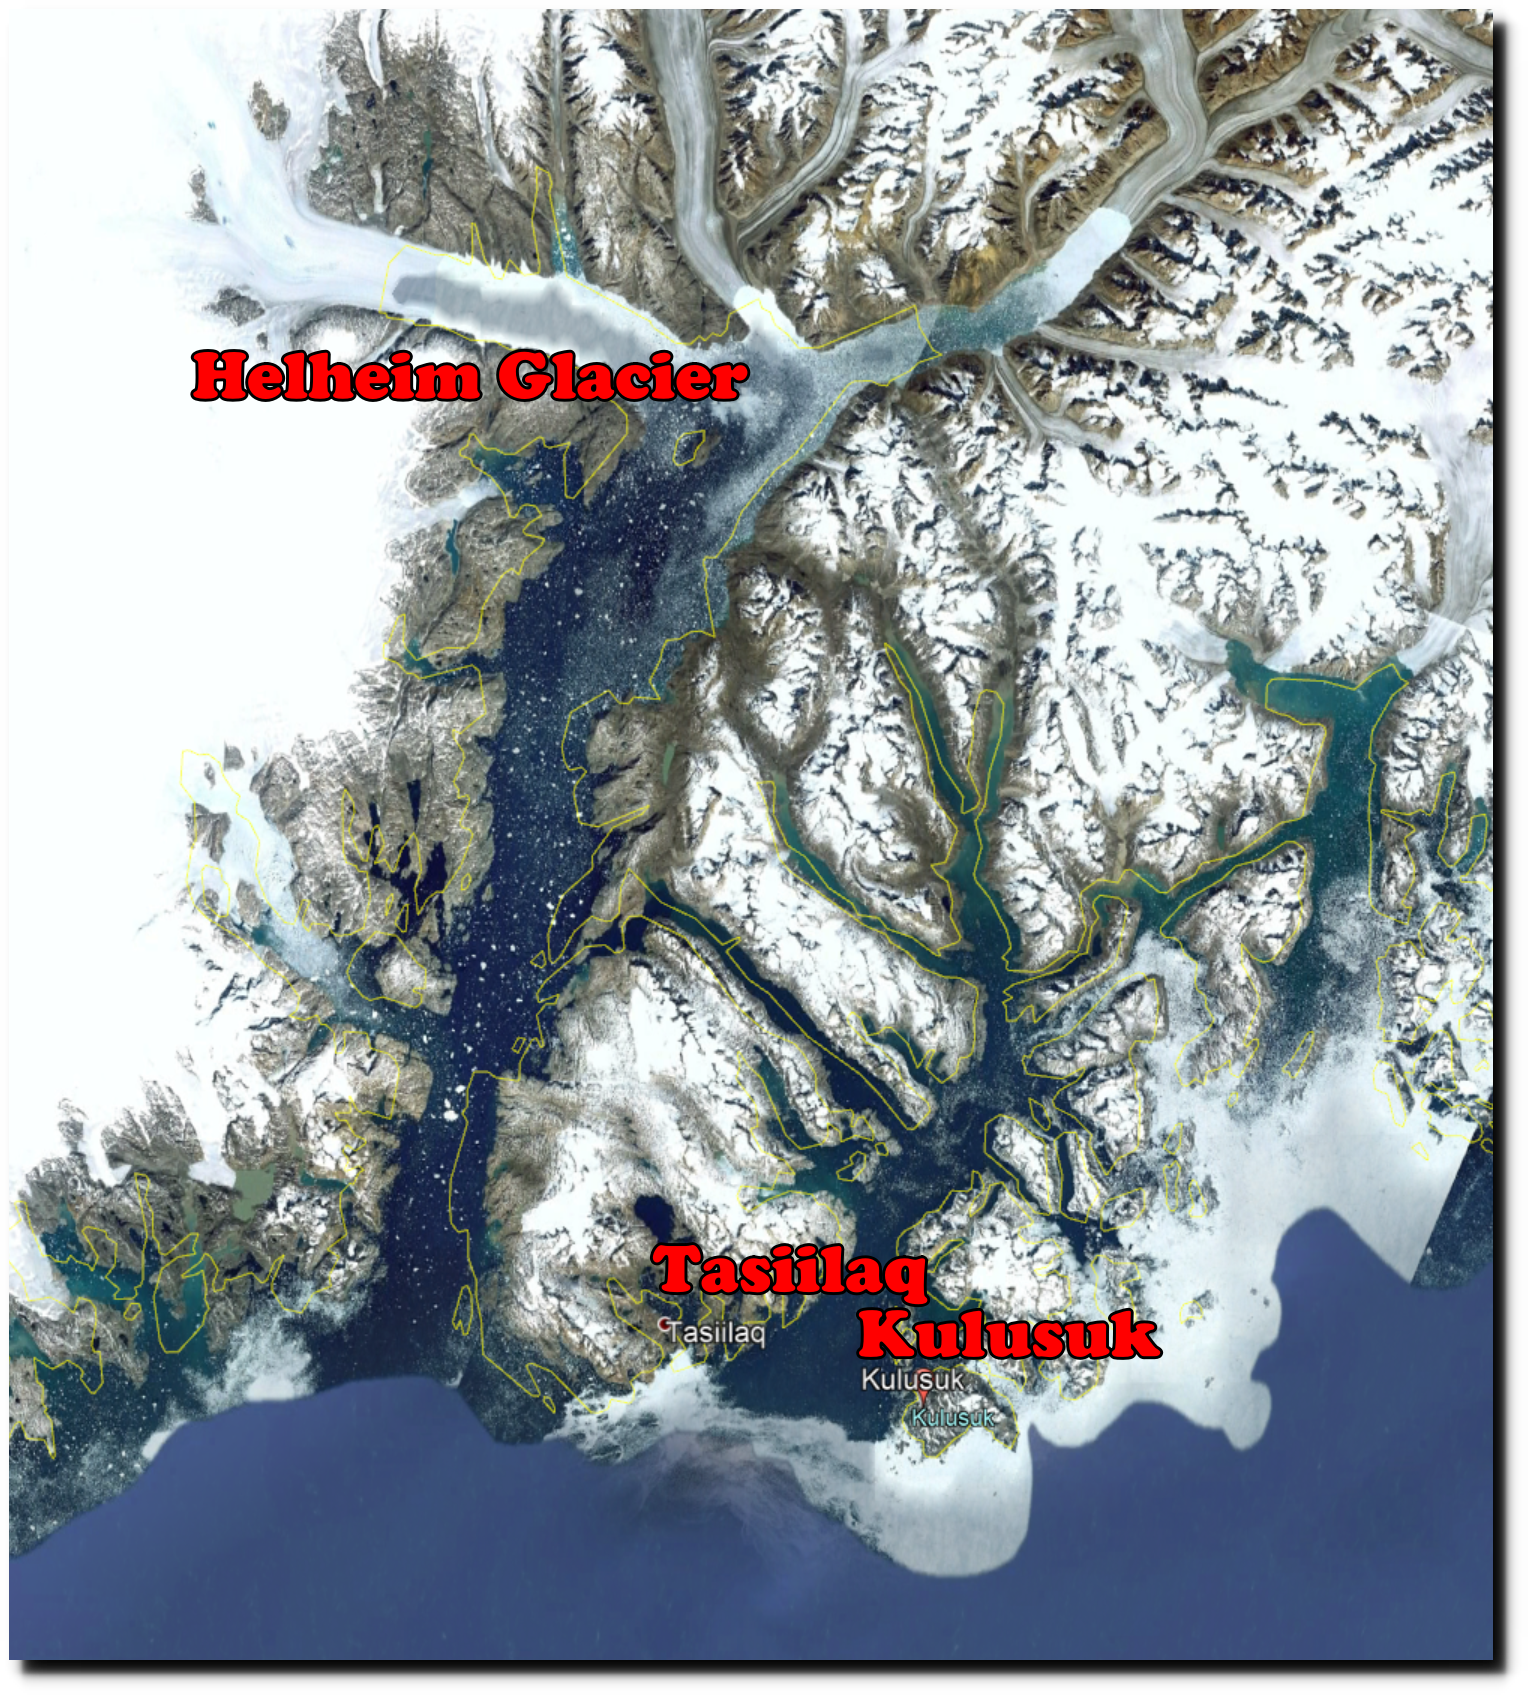
Greenland’s glaciers are melting like never before, especially Helheim – Los Angeles Times
Looking at his claims individually.
This is where Earth’s refrigerator door is left open, where glaciers dwindle and seas begin to rise.
Nonsense. Sea level has been rising for 20,000 years – most of the time much faster than at present. There is much less ice on Earth than there was 20,000 years ago – when New York and Chicago were under more than a mile of ice.
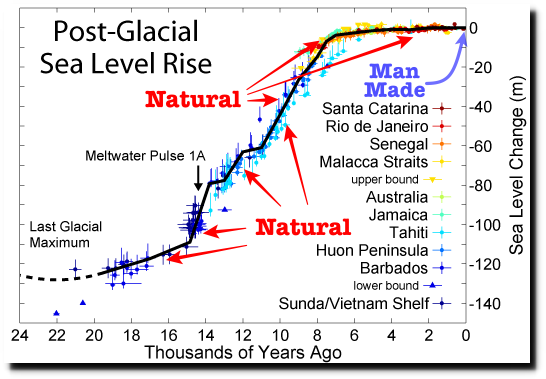
File:Post-Glacial Sea Level.png – Wikimedia Commons
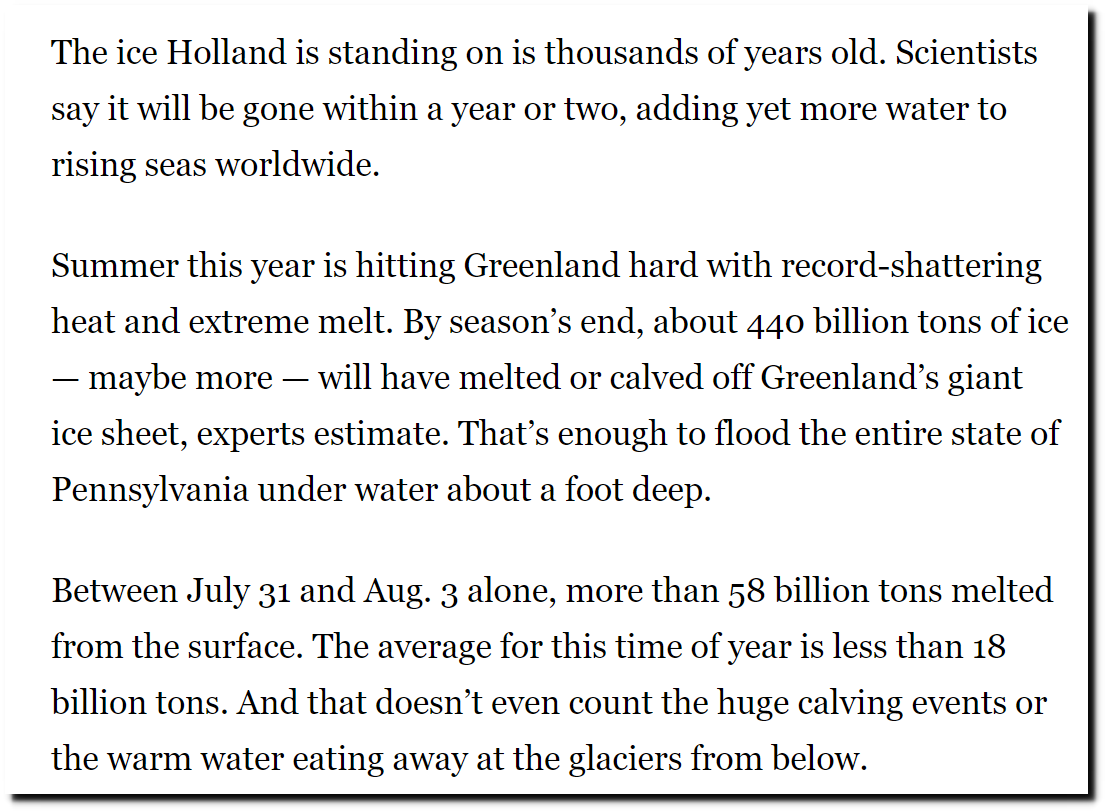
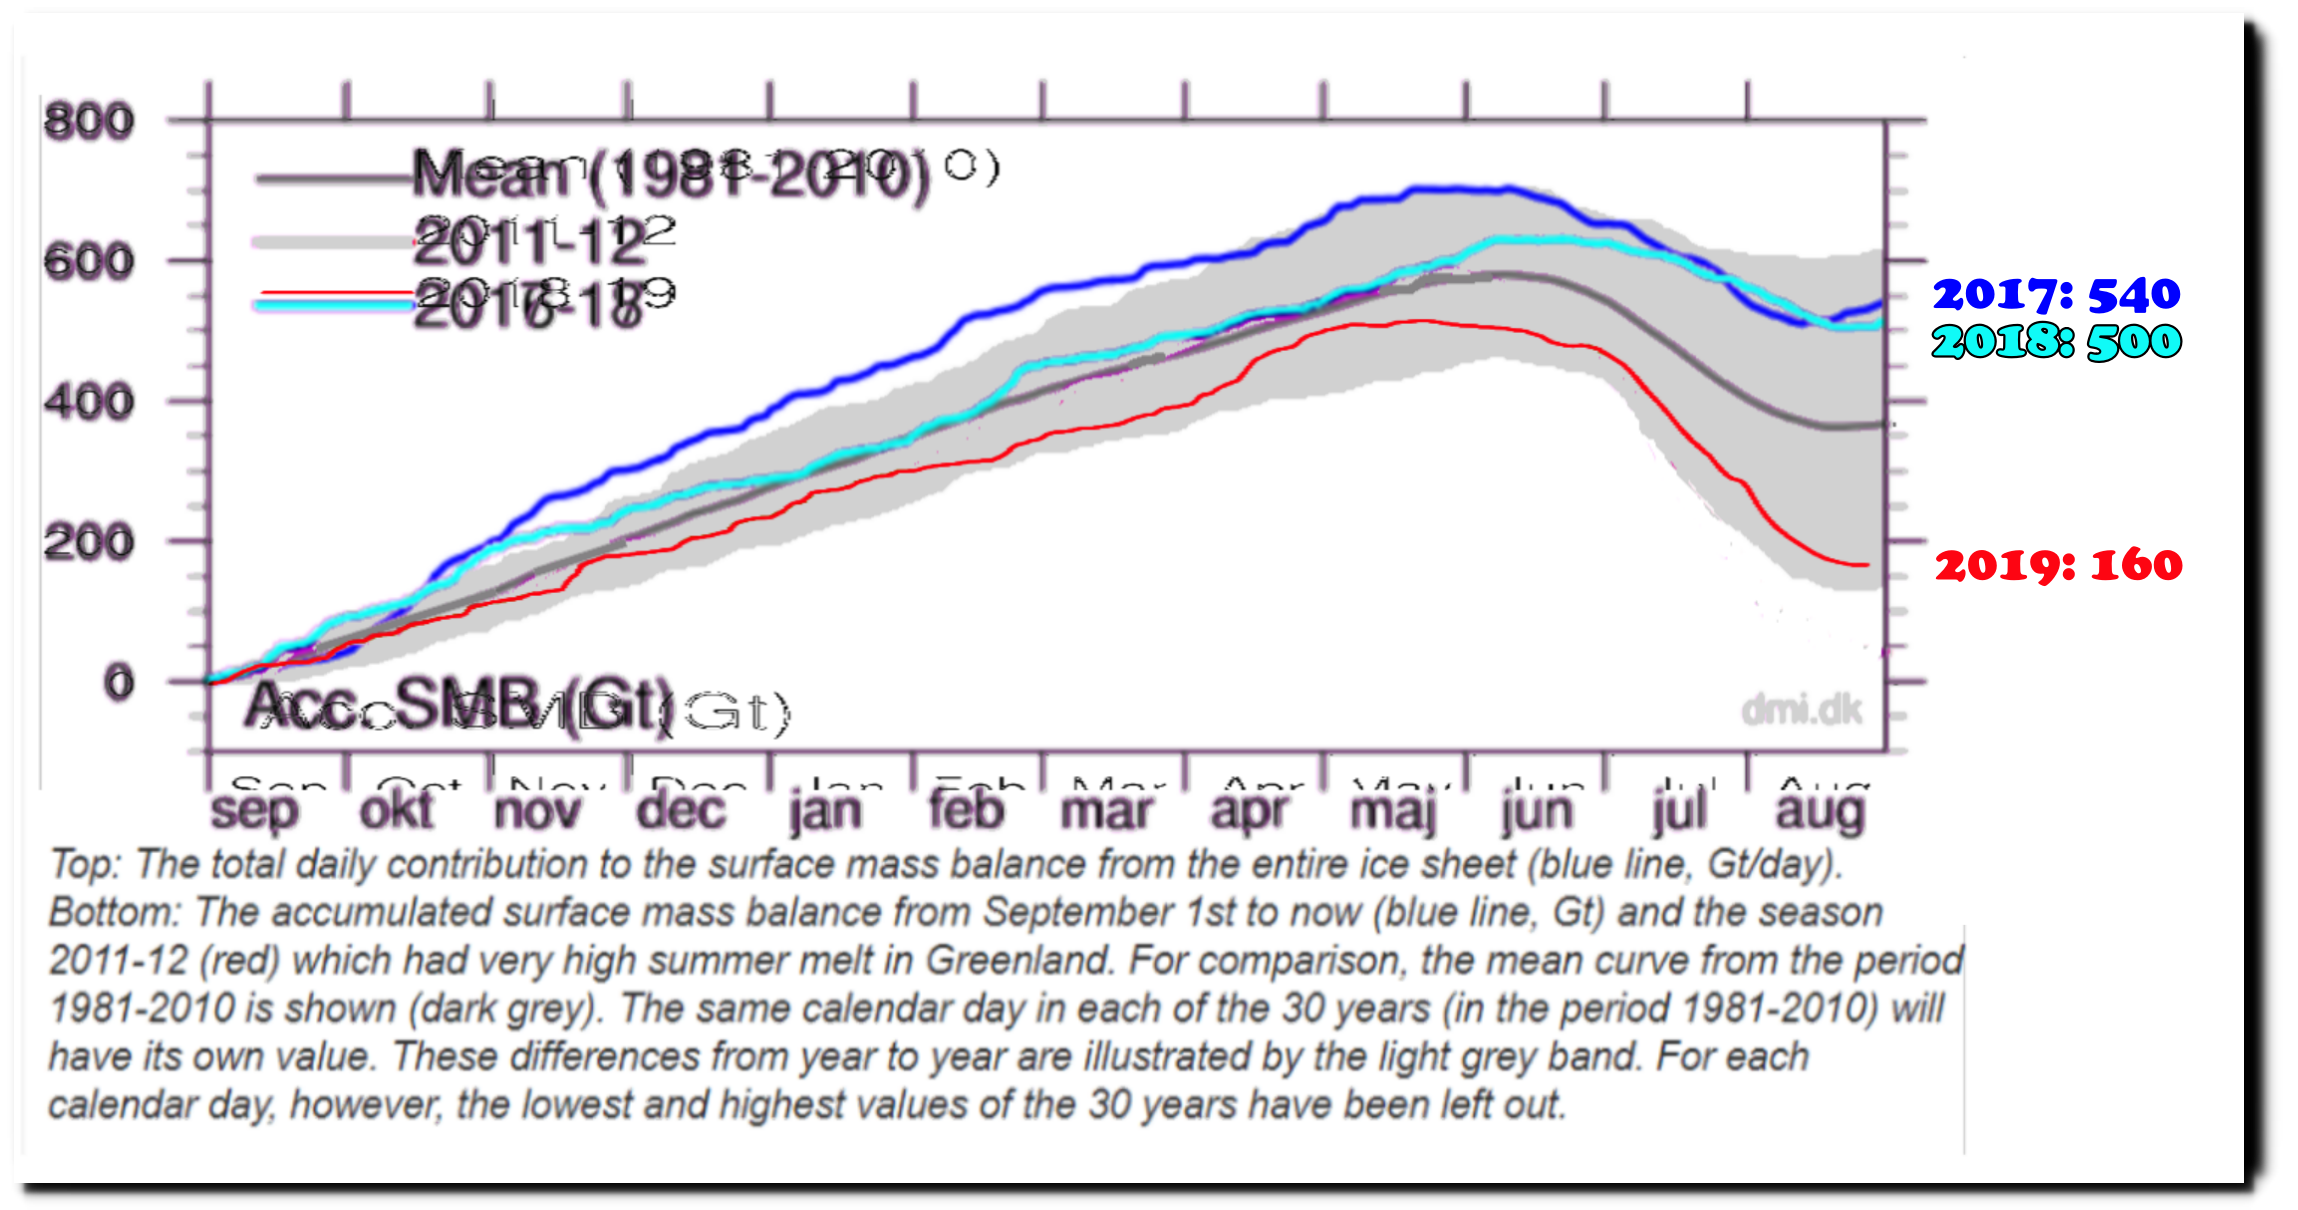
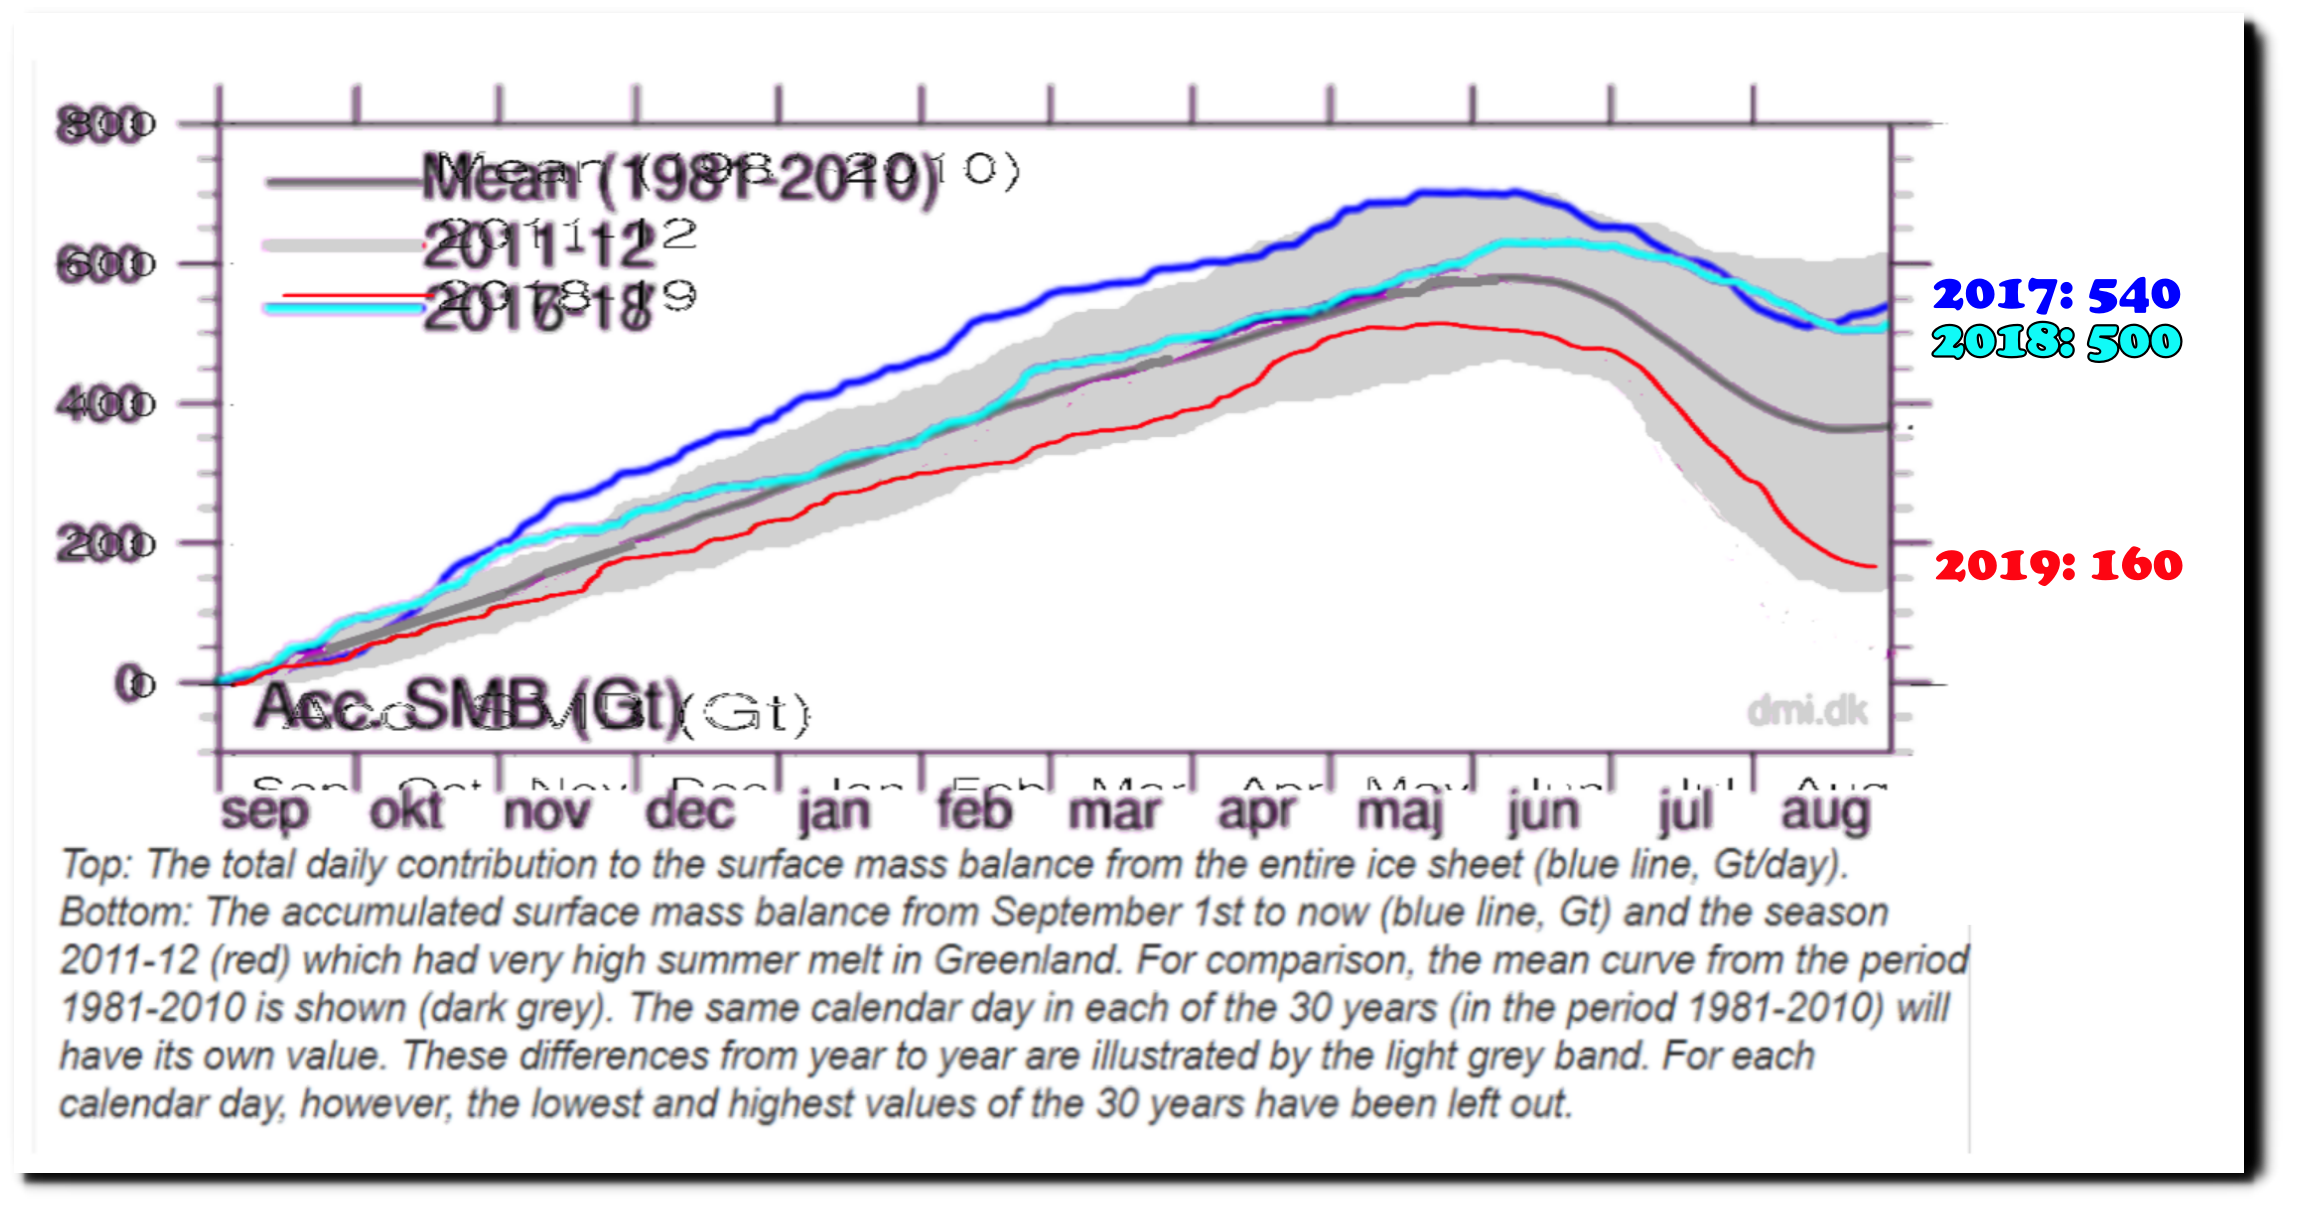
By season’s end, about 440 billion tons of ice — maybe more — will have melted or calved off Greenland’s giant ice sheet, experts estimate.The average for this time of year is less than 18 billion tons.
Greenland’s surface has gained 160 billion tons of new ice this year, after gains of 500 and 540 billion tons during the last two years. Average loss since the spring peak is 225 billion tons (plus calving loss) – not 18 billion tons.
In one of the closest towns, Kulusuk, the morning temperature reached 52 degrees Fahrenheit — warm enough for shirtsleeves.
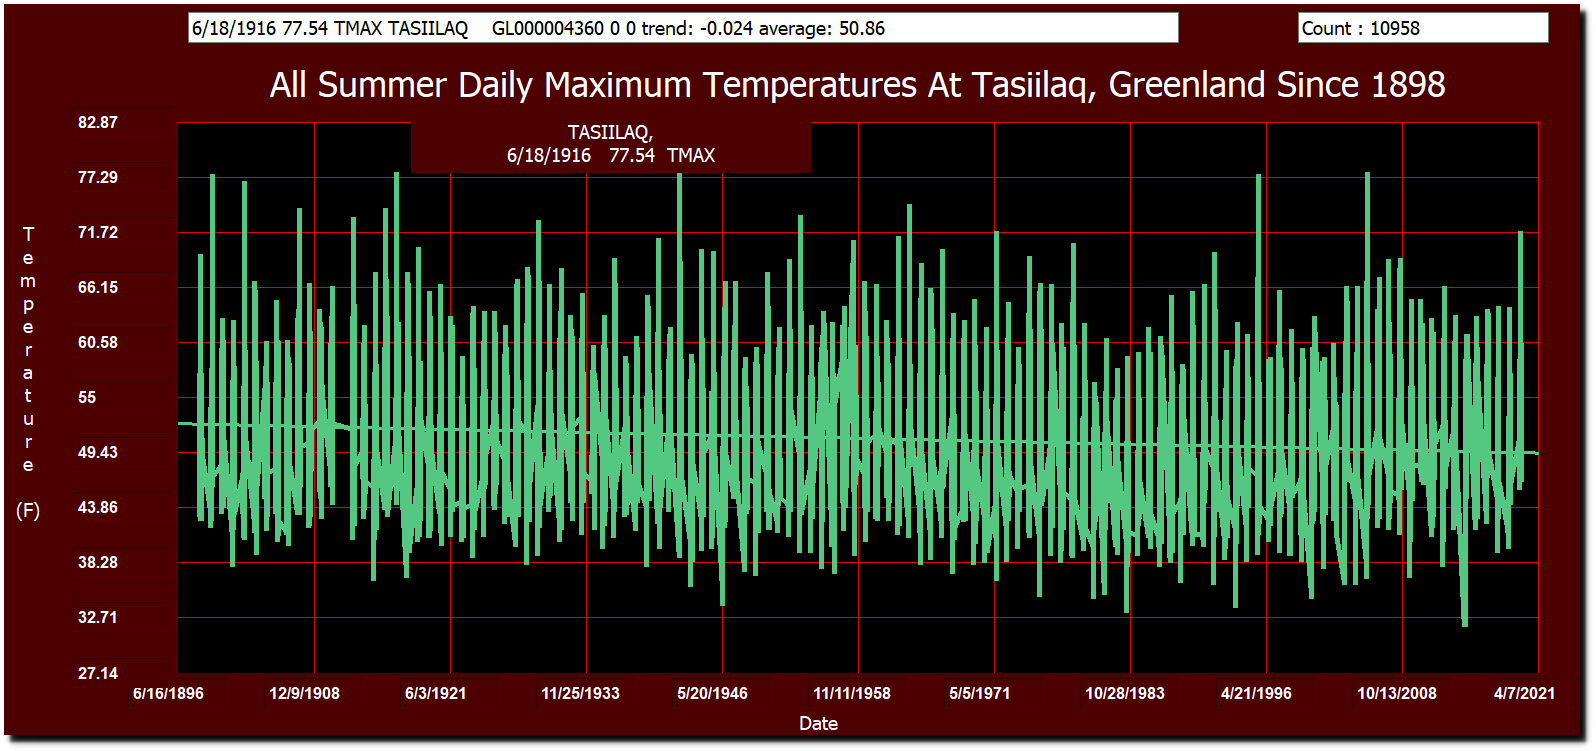
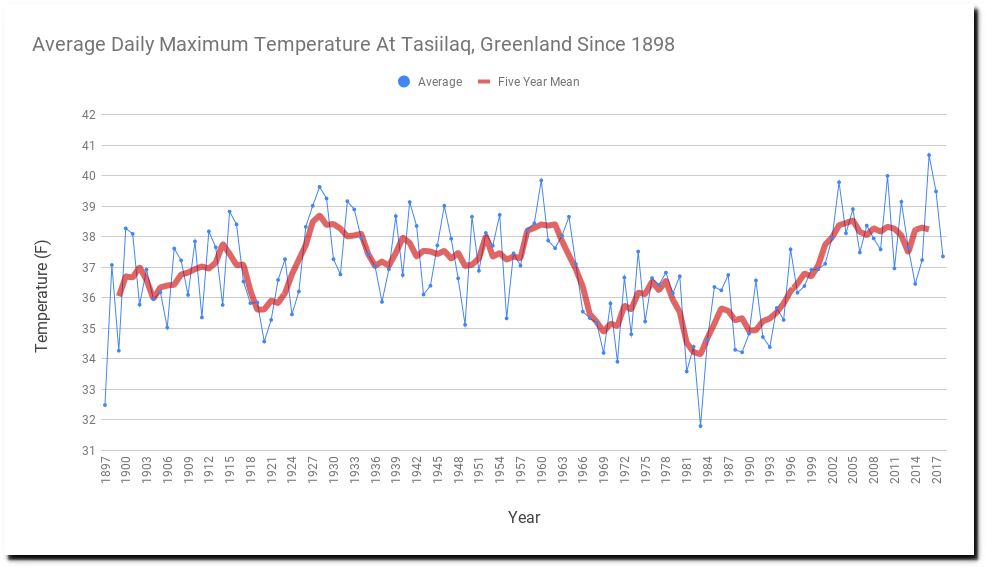
Meaningless out of context propaganda. The average summer maximum temperature there is 51 degrees. They have had 4,675 days over 52F since 1898. Highest temperature recorded there was 78 degrees on first seen on June 18, 1916. Summer daily maximum temperatures have been trending downwards at 2.4 degrees per century since the late 19th century.
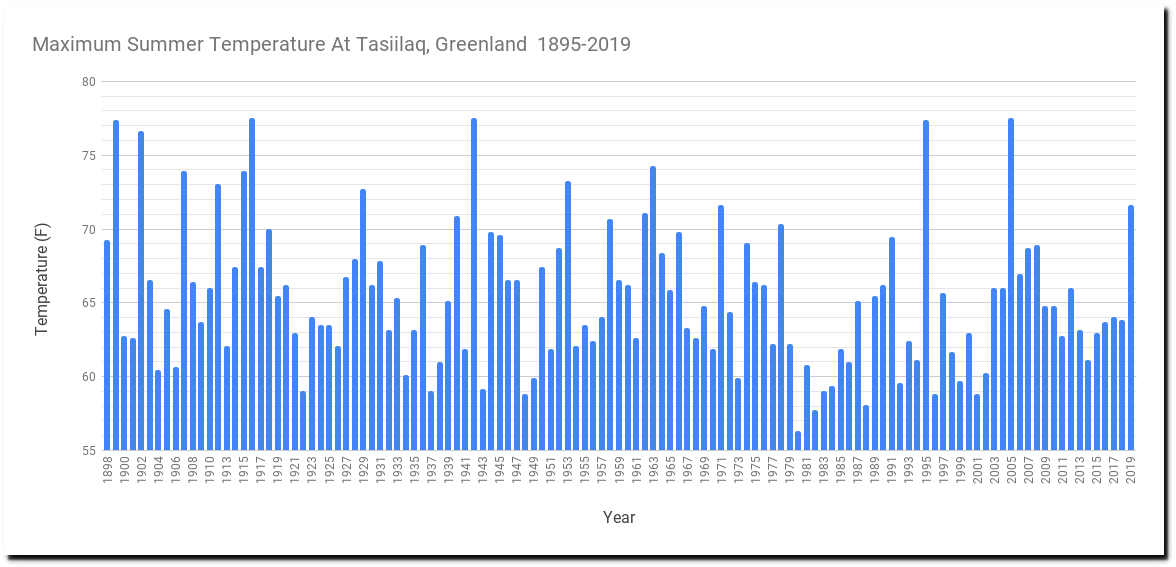
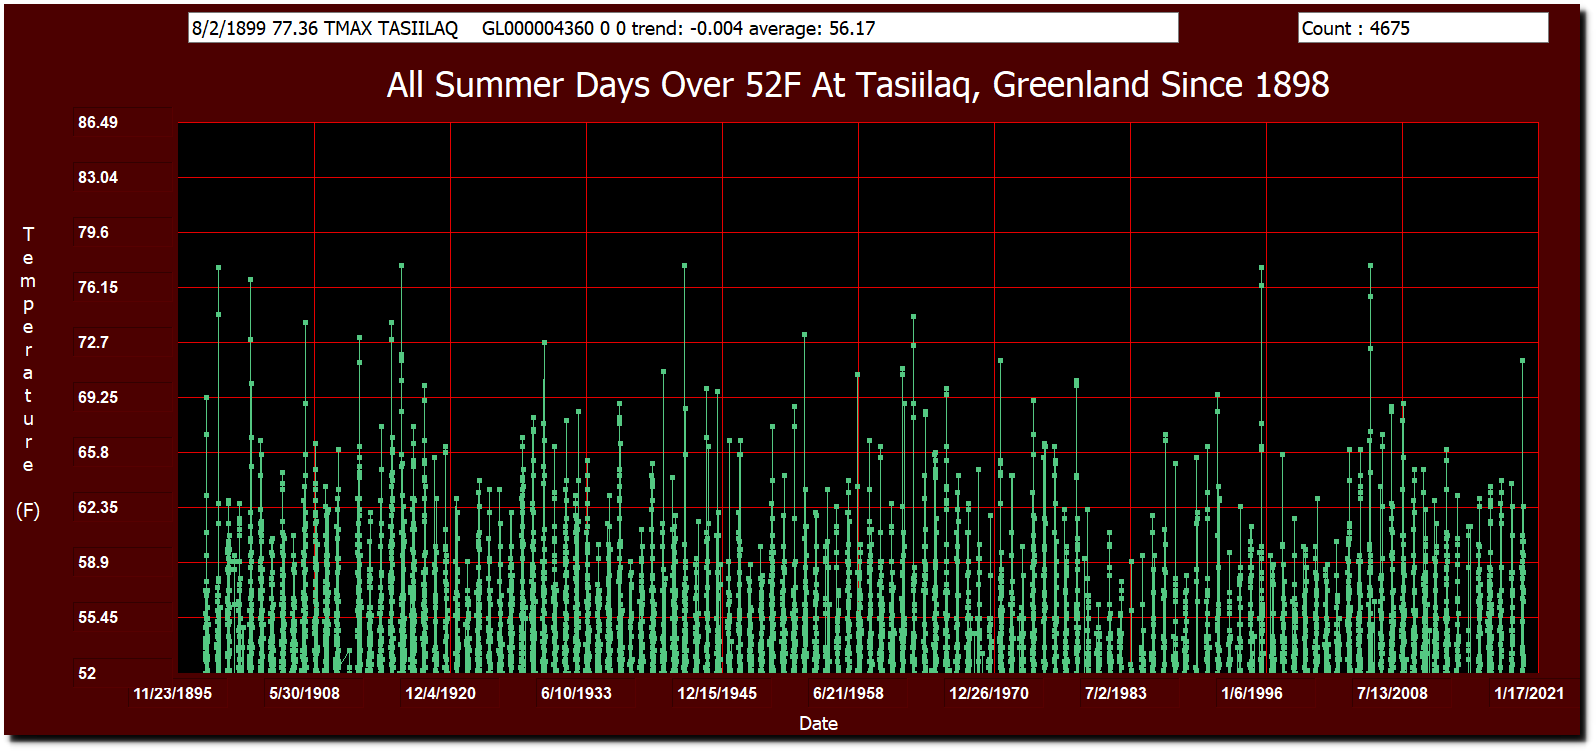
Summer maximum temperatures at Tasiilaq are about the same as they were prior to the cold period from 1960-2000.
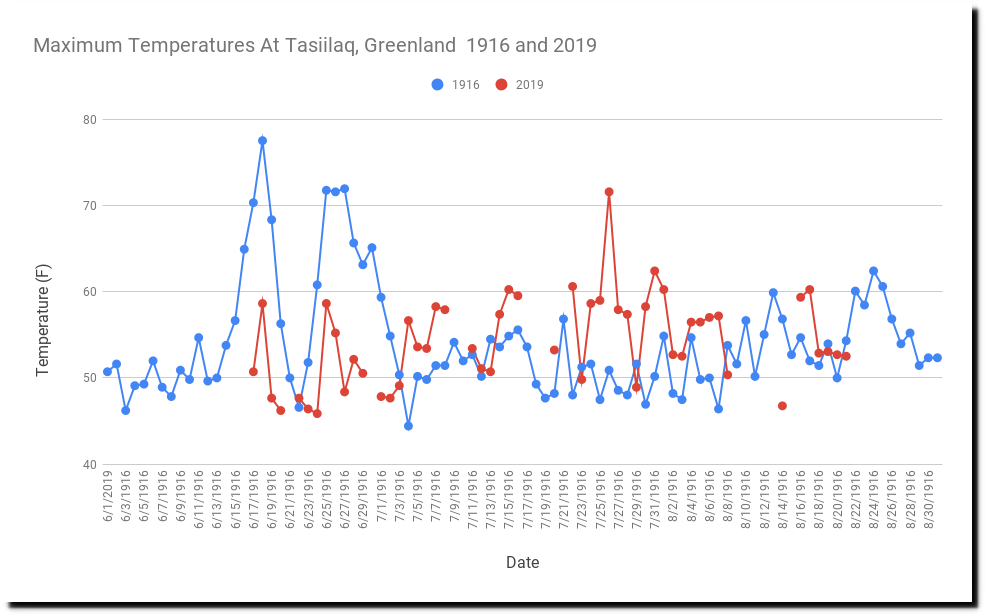
Average temperatures this summer have been about the same as summer 1916, but 1916 had a more warm days. This year only had one.
The Helheim Glacier has lost about three square miles of ice since 2012, while the Petermann Glacier has gained more than ten times that much.
Glaciers here do shrink in the summer and grow in the winter, but nothing like this year.
Incorrect. The Petermann Glacier is more than 100 feet thick at its terminus. There is no way ice that thick can retreat in summer, and has been growing steadily for the past seven years.
Photos near the terminus of the Petermann glacier
Greenland glaciers are melting at a very slow rate, if at all. Compare to 80 years ago when they were “facing catastrophic collapse.”

17 Dec 1939, Page 15 – Harrisburg Sunday Courier
By 1947, the Arctic had warmed 10 degrees, and scientists were predicting catastrophic sea level rise, unless they got money to start an international agency.
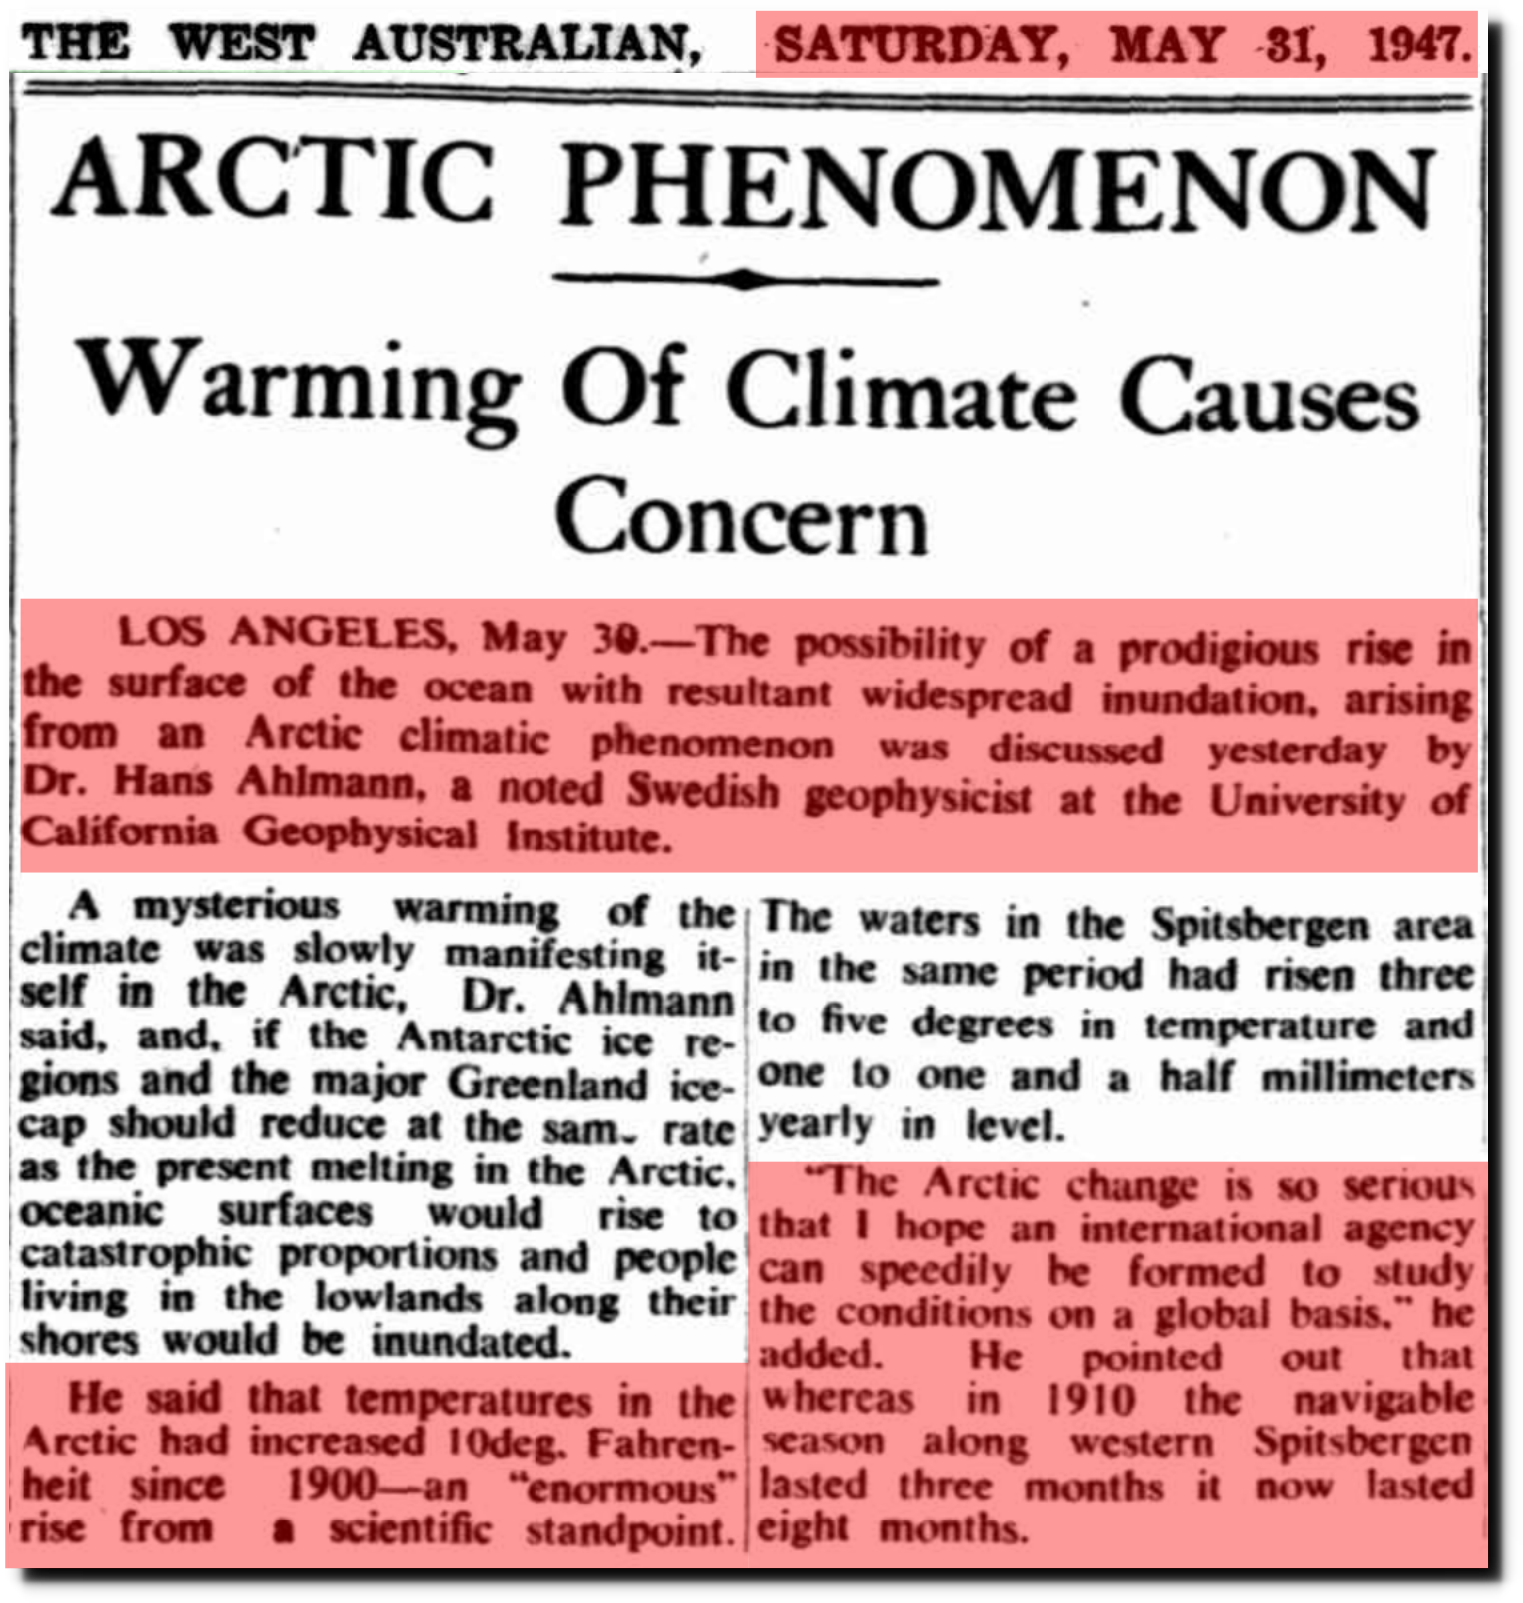
31 May 1947 – ARCTIC PHENOMENON – Trove
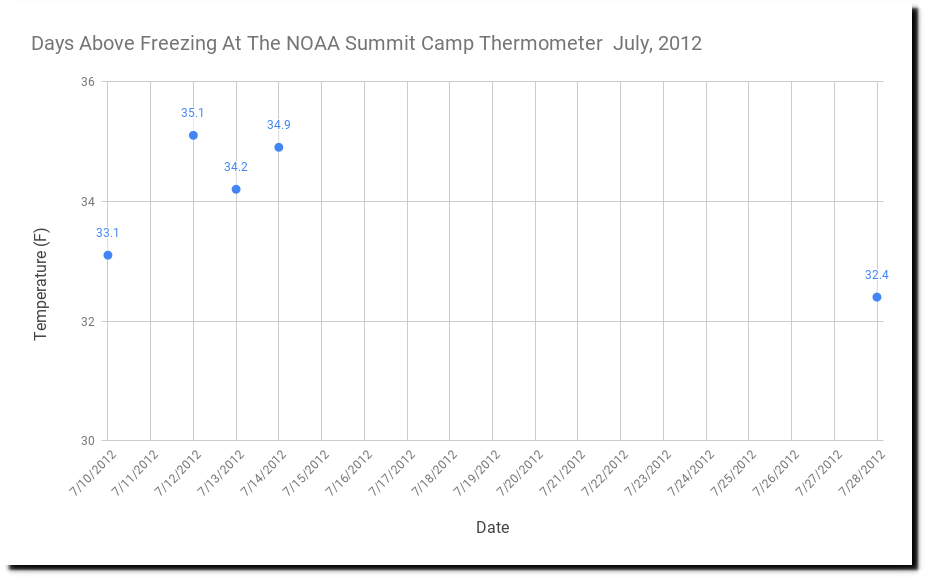
Summit Station, a research camp nearly 2 miles high and far north, warmed to above freezing twice this year for a record total of 16.5 hours. Before this year, that station was above zero for only 6.5 hours in 2012, once in 1889 and also in the Middle Ages.
Incorrect. Summit station never got above freezing this summer.
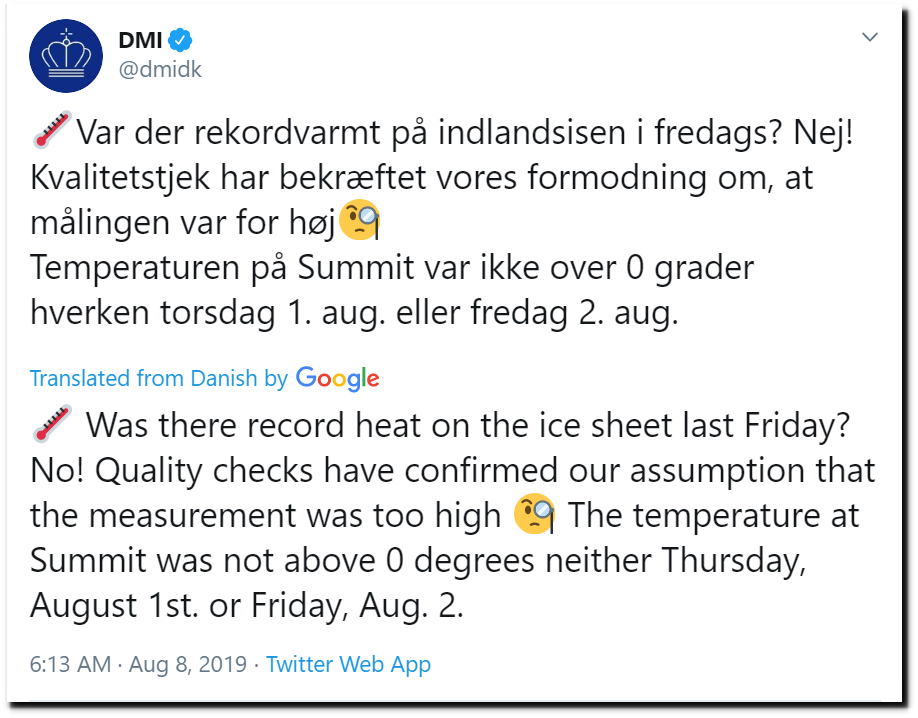
(24) DMI on Twitter: “??Var der rekordvarmt på indlandsisen i fredags? Nej!
According to NOAA, Summit camp was above freezing on six days in 2012.
The one thing with Seth Borenstein got right in this article is that Greenland was warm during the Middle Ages, when CO2 levels were very low.
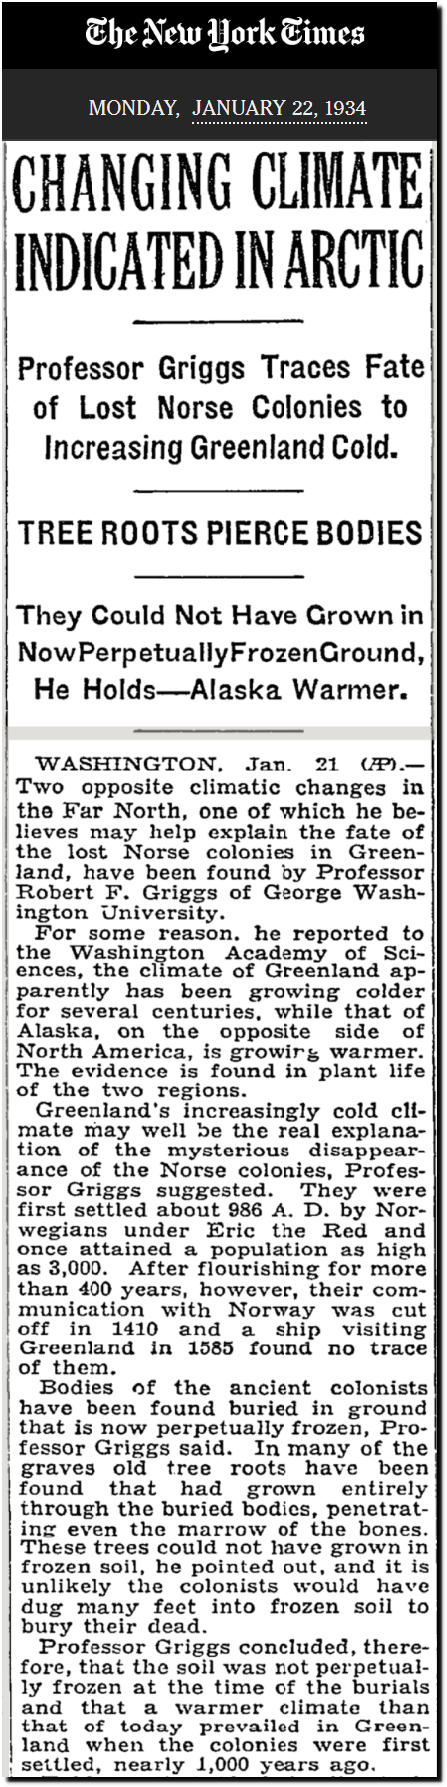
TimesMachine: January 22, 1934 – NYTimes.com
Seth is keeping up the long tradition of Greenland fake news. According to the Guardian, next year is the tipping point and sea level will rise 23 feet.
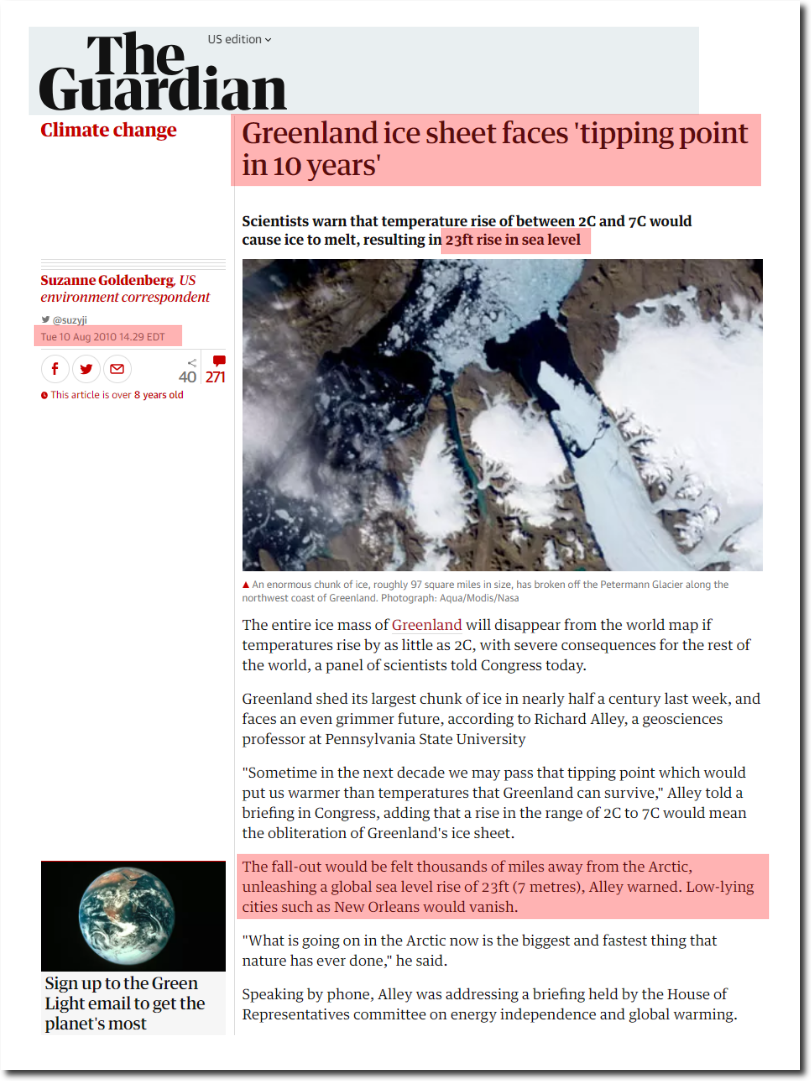
Greenland ice sheet faces ‘tipping point in 10 years’ | Environment | The Guardian
So, the same story as 1952.
Dr. William S. Carlson, an Arctic expert, said to-night that the Polar icecaps were melting at anastonishingg and unexplained rate and were threatening to swamp seaports by raising the ocean levels.
February 16, 1952
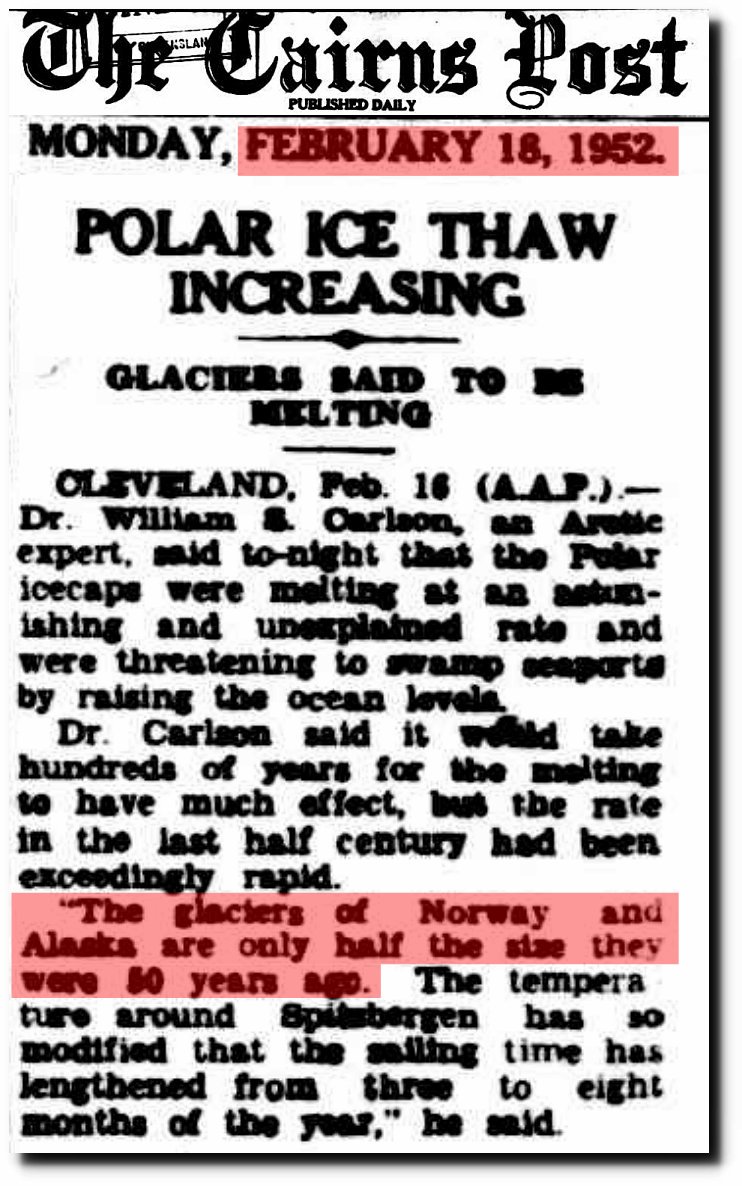
18 Feb 1952 – POLAR ICE THAW INCREASING
What I find disturbing is not that Seth Borenstein is spreading misinformation – that is what journalists do for a living. What troubles me is that a small handful of scientists like Josh Willis, Tom Mote and Jason Box allow themselves to be used in misleading propaganda articles like this, over and over again.
Posted in Uncategorized
Leave a comment
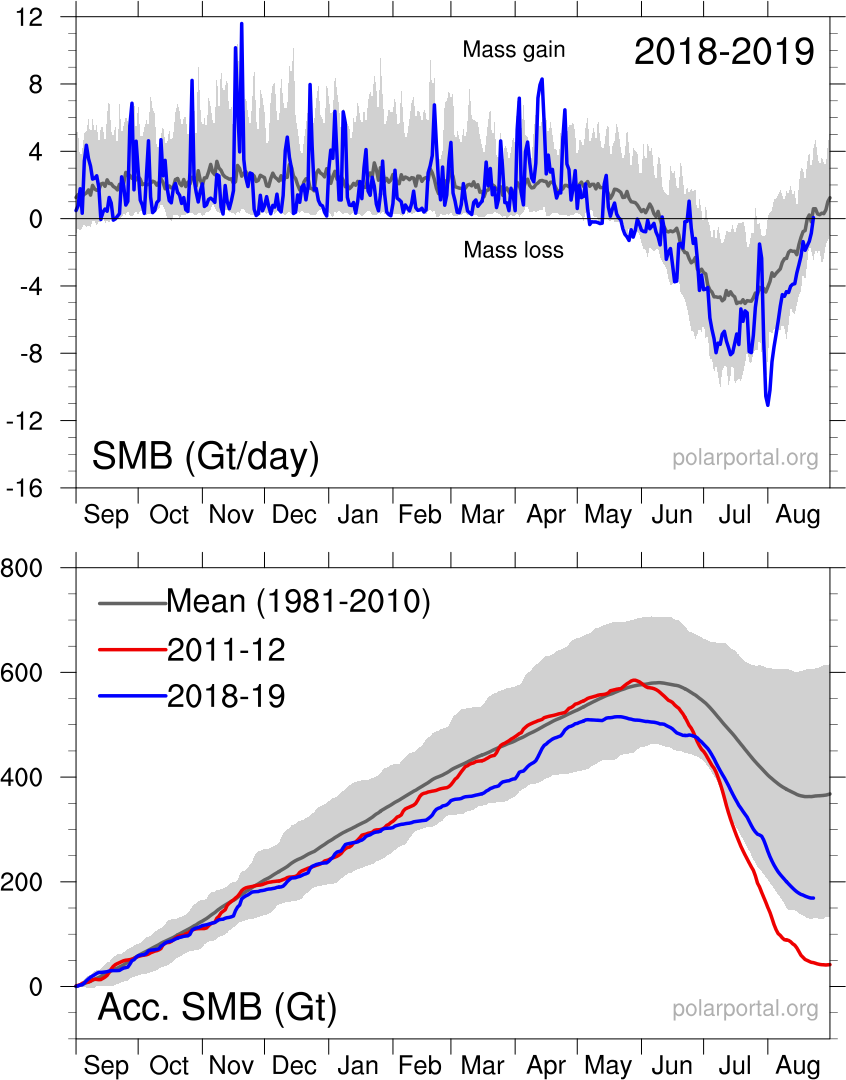
Greenland Melt Season Ends – 1.2 Trillion Tons Of New Ice Since 2016
The Greenland melt season has ended, with the surface mass balance showing a gain of 160 billion tons since September 1, 2018.
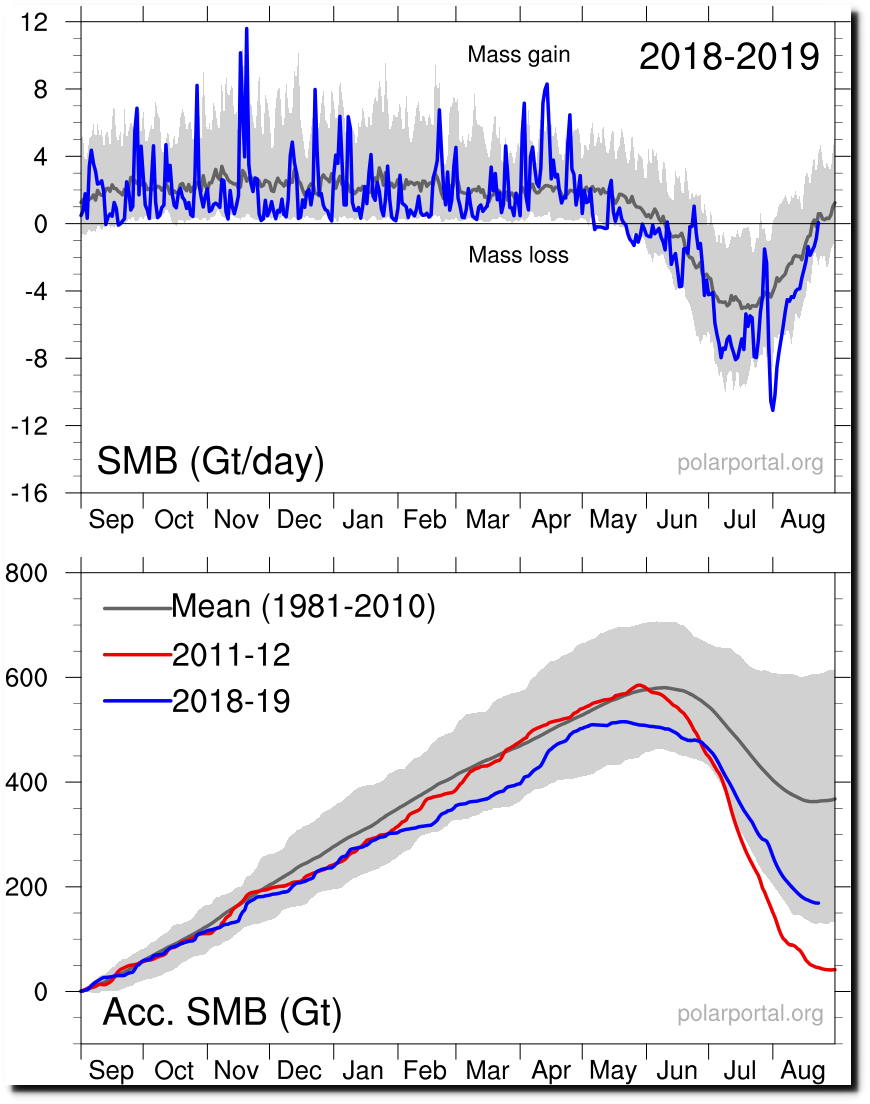
polarportal/surface/SMB_curves_LA_EN_20190823.png
Over the past three years, Greenland’s surface has gained 1.2 trillion tons of new ice.
Experts in the press corps have generously interpreted the data for us, and determined that there is a climate emergency and it is President Trump’s fault.

Their highly researched journalism was based on a single incorrect temperature reading in the center of the Greenland ice sheet.
(24) DMI on Twitter: “??Var der rekordvarmt på indlandsisen i fredags? Nej!
Posted in Uncategorized
Leave a comment