


Disrupting the Borg is expensive and time consuming!

Google Search
-
Recent Posts
- One Atomic Bomb Per Hour
- New Video : Analyzing Oil And Gas
- Is Antarctica Melting?
- High Speed Analysis And Visualization
- El Nino To The Rescue?
- Fake News Update
- Growth Of Antarctic Sea Ice
- 65 Years Of Progress!
- El Nino To The Rescue?
- Worst March Drought On Record
- ChartGL Process Control Demo
- The Biggest Money Laundering Scam
- Drought In The Headwaters Of Lake Powell
- Unrealistic Expectations Of Water Availability
- Did Bill Gates Do This?
- Worst March Drought On Record In The US
- The Real Hockey Stick Graph
- Analyzing The Western Water Crisis
- Gaslighting 1924
- “Why Do You Resist?”
- Climate Attribution Model
- Fact Checking NASA
- Fact Checking Grok
- Fact Checking The New York Times
- New Visitech Features
July 2026 M T W T F S S 1 2 3 4 5 6 7 8 9 10 11 12 13 14 15 16 17 18 19 20 21 22 23 24 25 26 27 28 29 30 31 Recent Comments
- Bob G on One Atomic Bomb Per Hour
- Jack the Insider on One Atomic Bomb Per Hour
- arn on One Atomic Bomb Per Hour
- Bob G on One Atomic Bomb Per Hour
- Bob G on One Atomic Bomb Per Hour
- Bob G on One Atomic Bomb Per Hour
- Hank Phillips on One Atomic Bomb Per Hour
- Hank Phillips on One Atomic Bomb Per Hour
- Bob G on One Atomic Bomb Per Hour
- Bob G on One Atomic Bomb Per Hour
Obamas Worried About Sea Level Rise
Barack Obama is so worried about sea level rise, he is buying a $15 million dollar home on the beach with his $200,000 salary.

Barack and Michelle Obama buying $14.85M Martha’s Vineyard estate
Posted in Uncategorized
Leave a comment
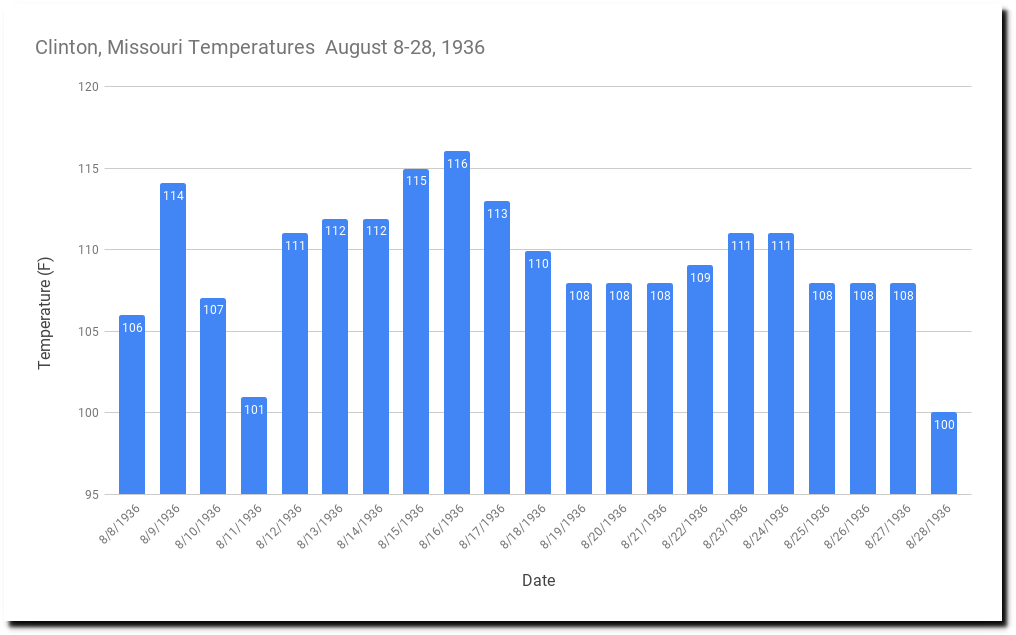
1936 : Twenty-One Straight Days Over 100F
During the three weeks from August 8-28, 1936, Clinton, Missouri was over 100F every day, including ten days over 110F. The average maximum temperature was 109F.
ftp://ftp.ncdc.noaa.gov/pub/data/ghcn/daily/all/USC00231711.dly
Temperatures have been plummeting since the 19th century, with this year (AKA “hottest year ever”) averaging more than twenty degrees cooler than 1936. The only other year which came close to 1936 was 1913.
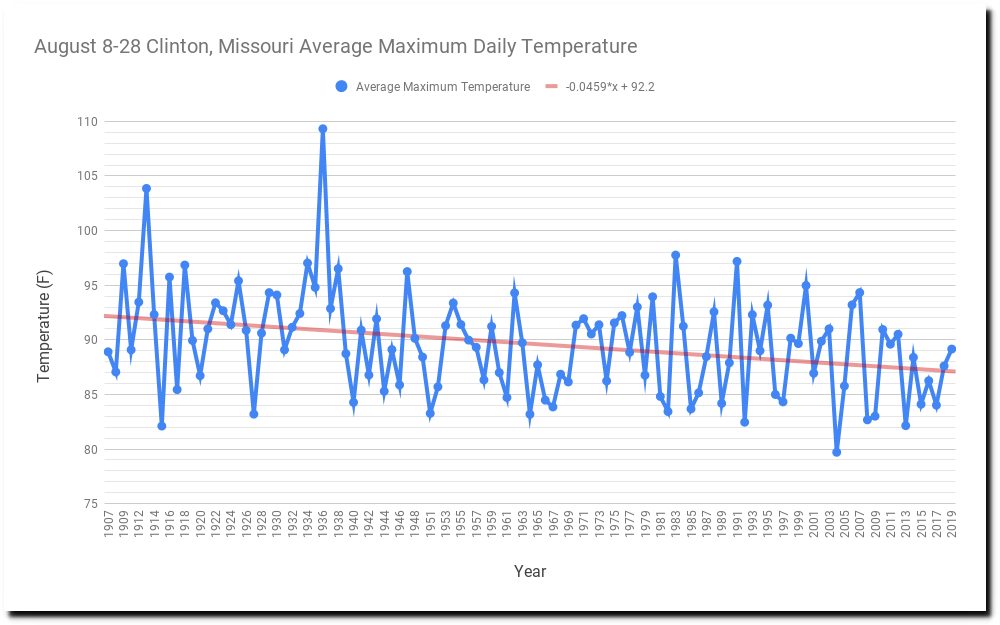
August temperatures were much hotter when CO2 was close to pre-industrial levels.

On this date in 1936, there were 100 degree temperatures from California to Pennsylvania. Seven states were over 110 degrees, and 24 states were over 100 degrees.
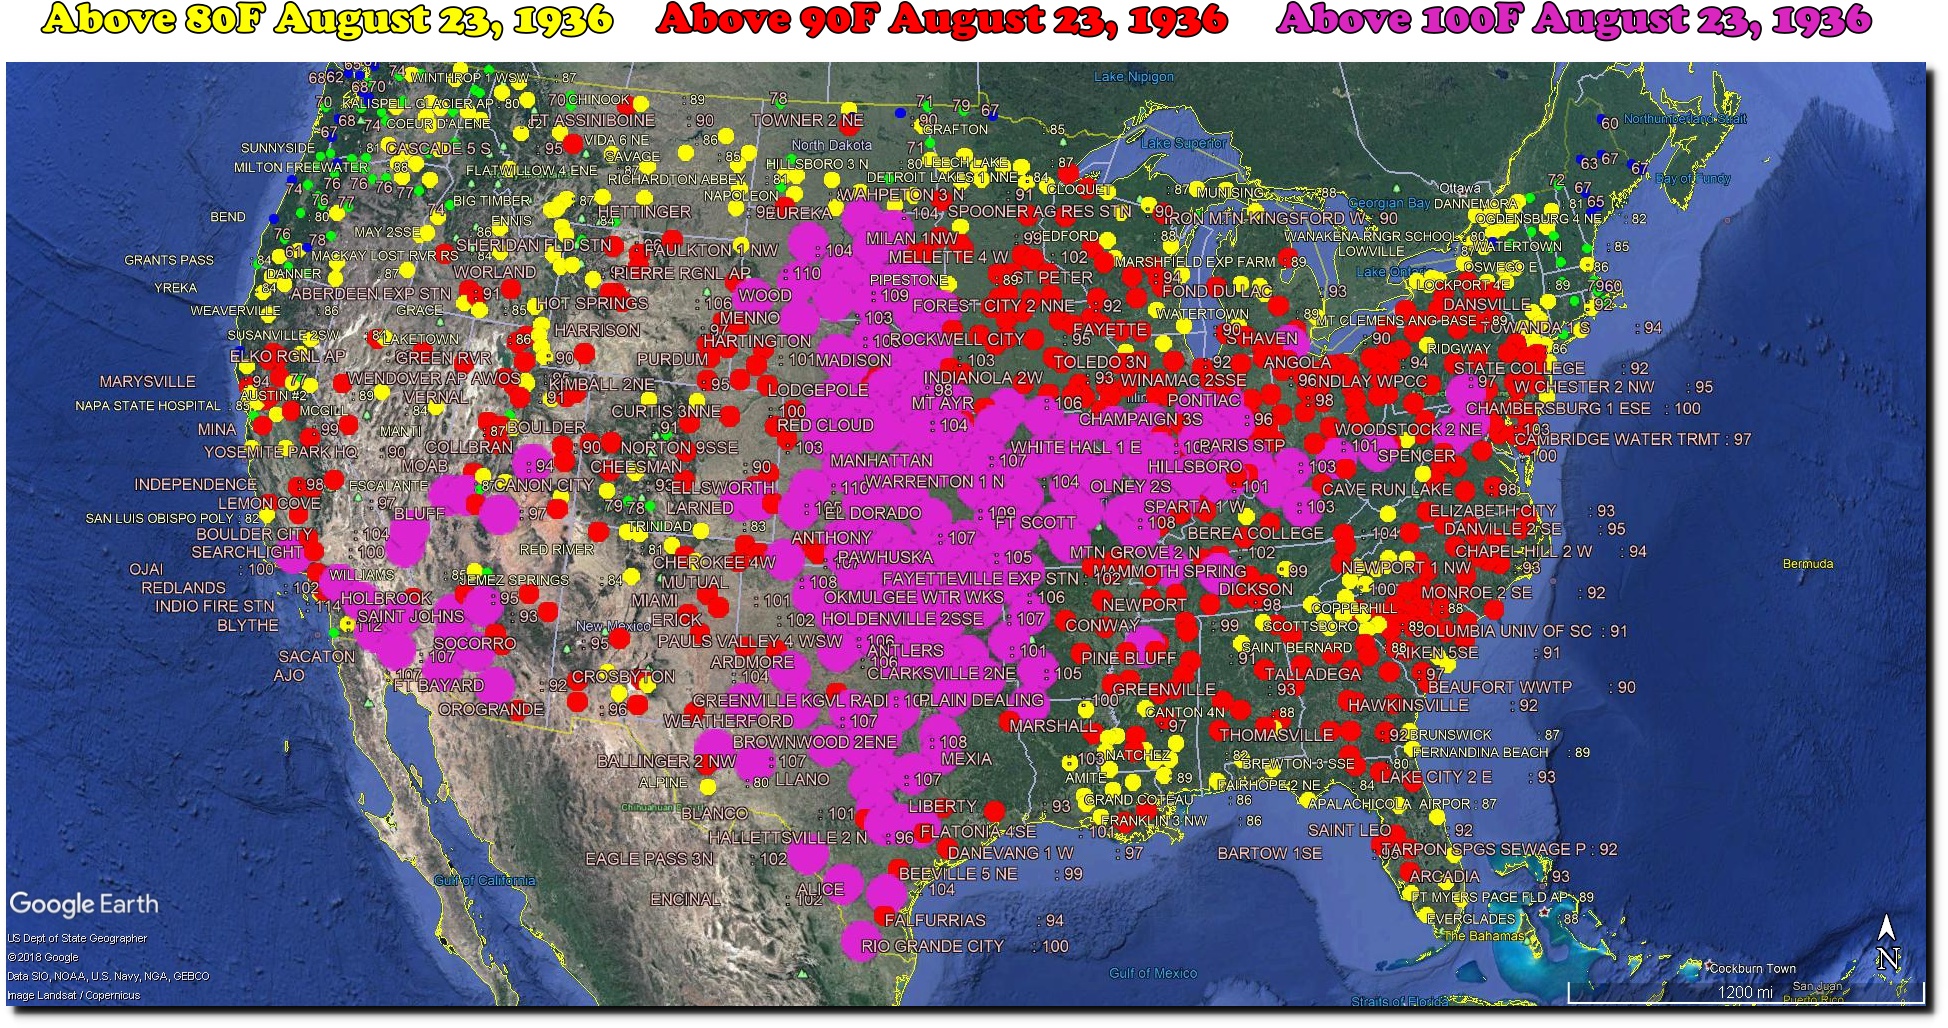
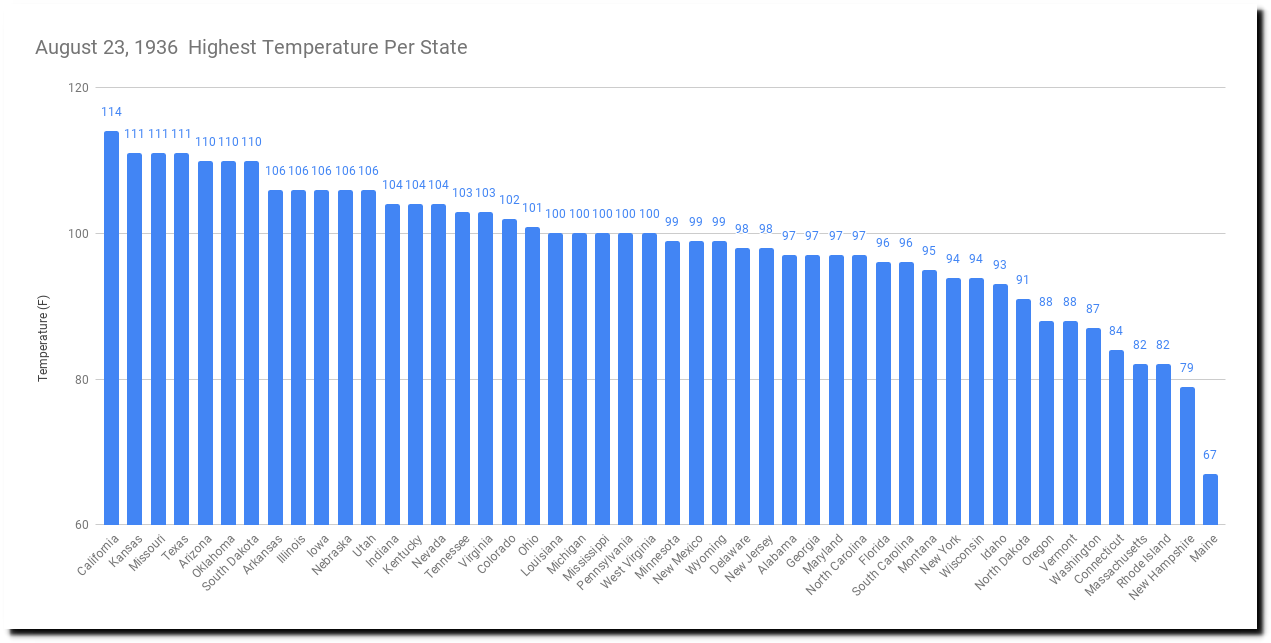
The weather man said “something is wrong” with the weather.
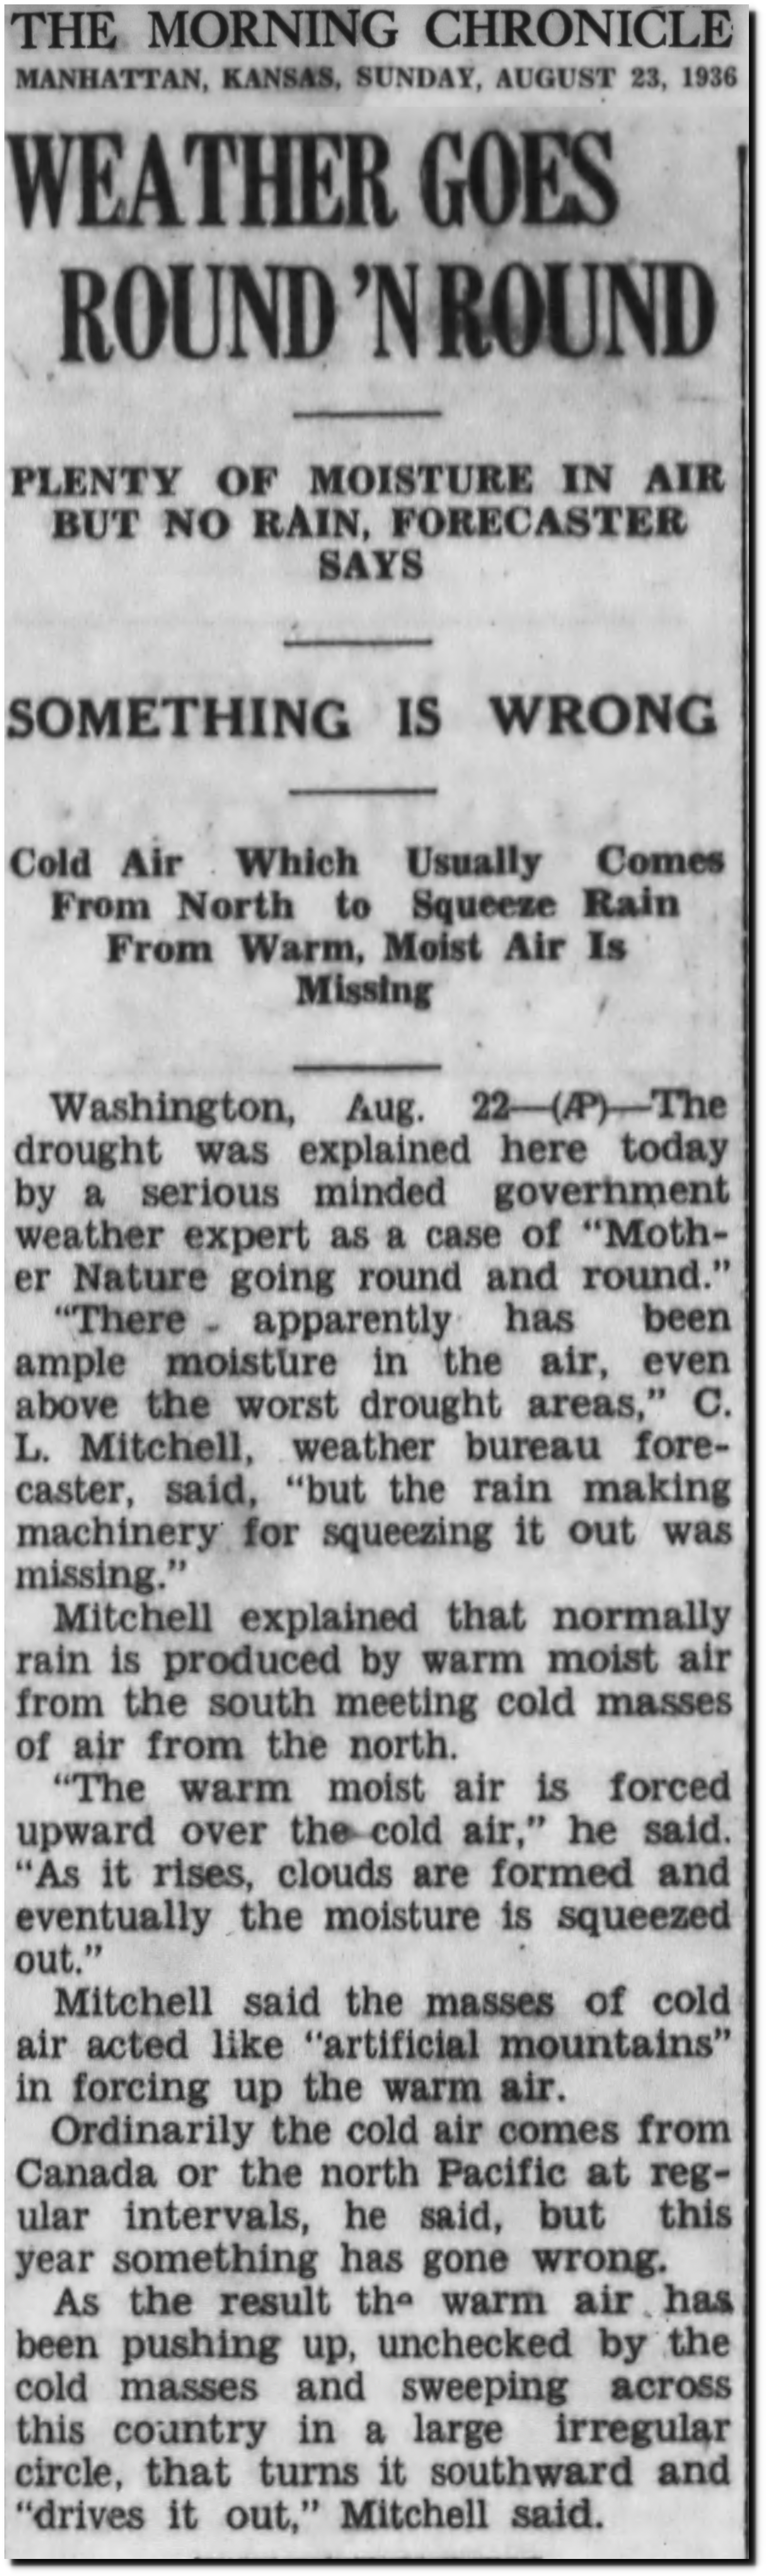
23 Aug 1936, 1 – The Morning Chronicle at Newspapers.com
Weather like that is incomprehensible now to most Americans, which is what NASA and NOAA are counting on when they try to erase it.
Posted in Uncategorized
Leave a comment
Arctic Settled Science Update
MASIE shows Arctic sea ice extent 9% less than the same date in 2012.

DATASETS/NOAA/G02186/masie_4km_allyears_extent_sqkm.csv
But NSIDC maps show 9% more ice than 2012.
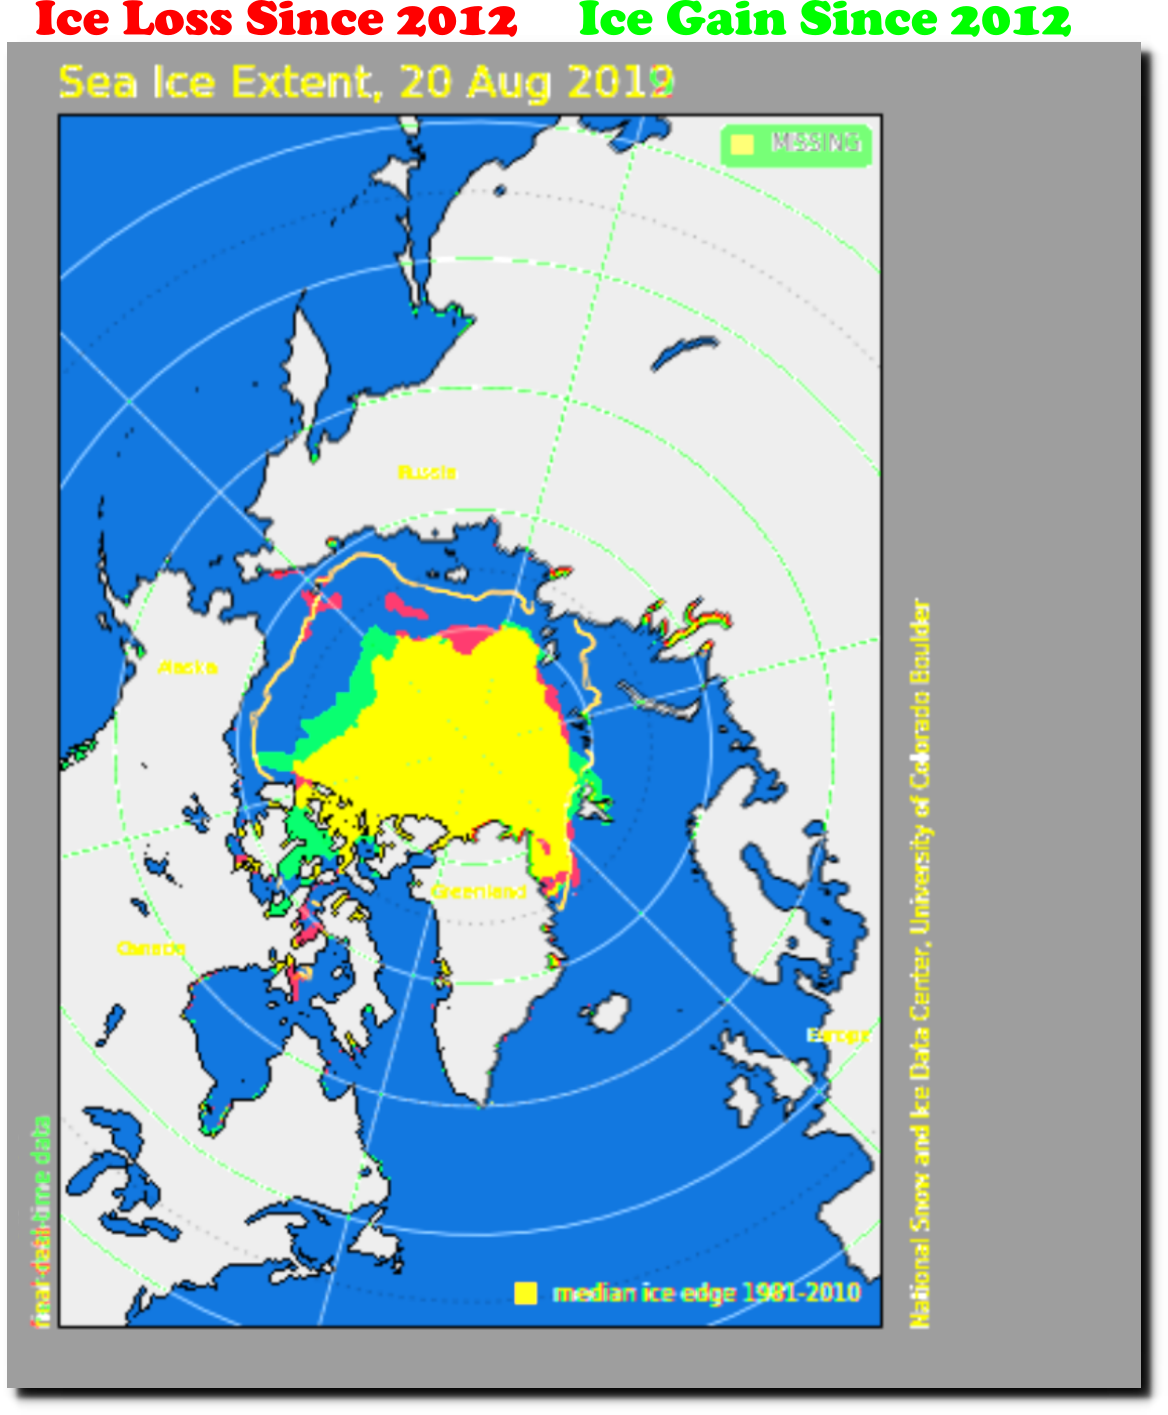
Apparently an 18% discrepancy is close enough for government work, which will be used to make multi-trillion dollar superstition based policy decisions.
Posted in Uncategorized
Leave a comment
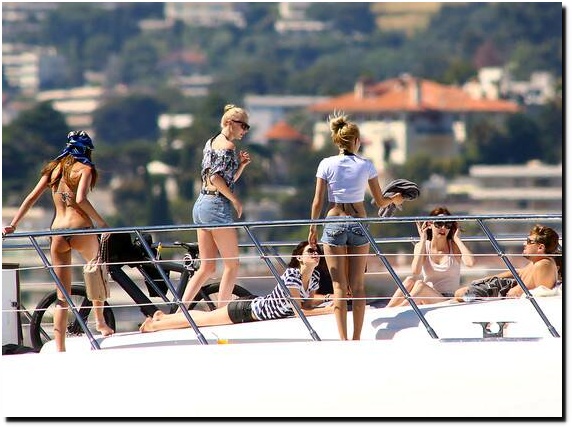
Greta’s Dire Straits

Greta Thunberg doesn’t go to school, because adults around her have convinced her the climate situation is simply too bad. Instead she is traveling on an expensive yacht to the US, preaching imminent doom as a “magnet for hope.” She has been told that children had a much brighter future when CO2 levels were lower, like a century ago. Greta believes greenhouse gases cause catastrophic heatwaves, natural disasters and disease, which will ruin her future..
It is easy enough to test that idea out, by looking at how children lived a century ago – at lower CO2 levels. On this date in 1916, children were out of school for different reasons. New York Public Schools were shut down due to a polio epidemic.
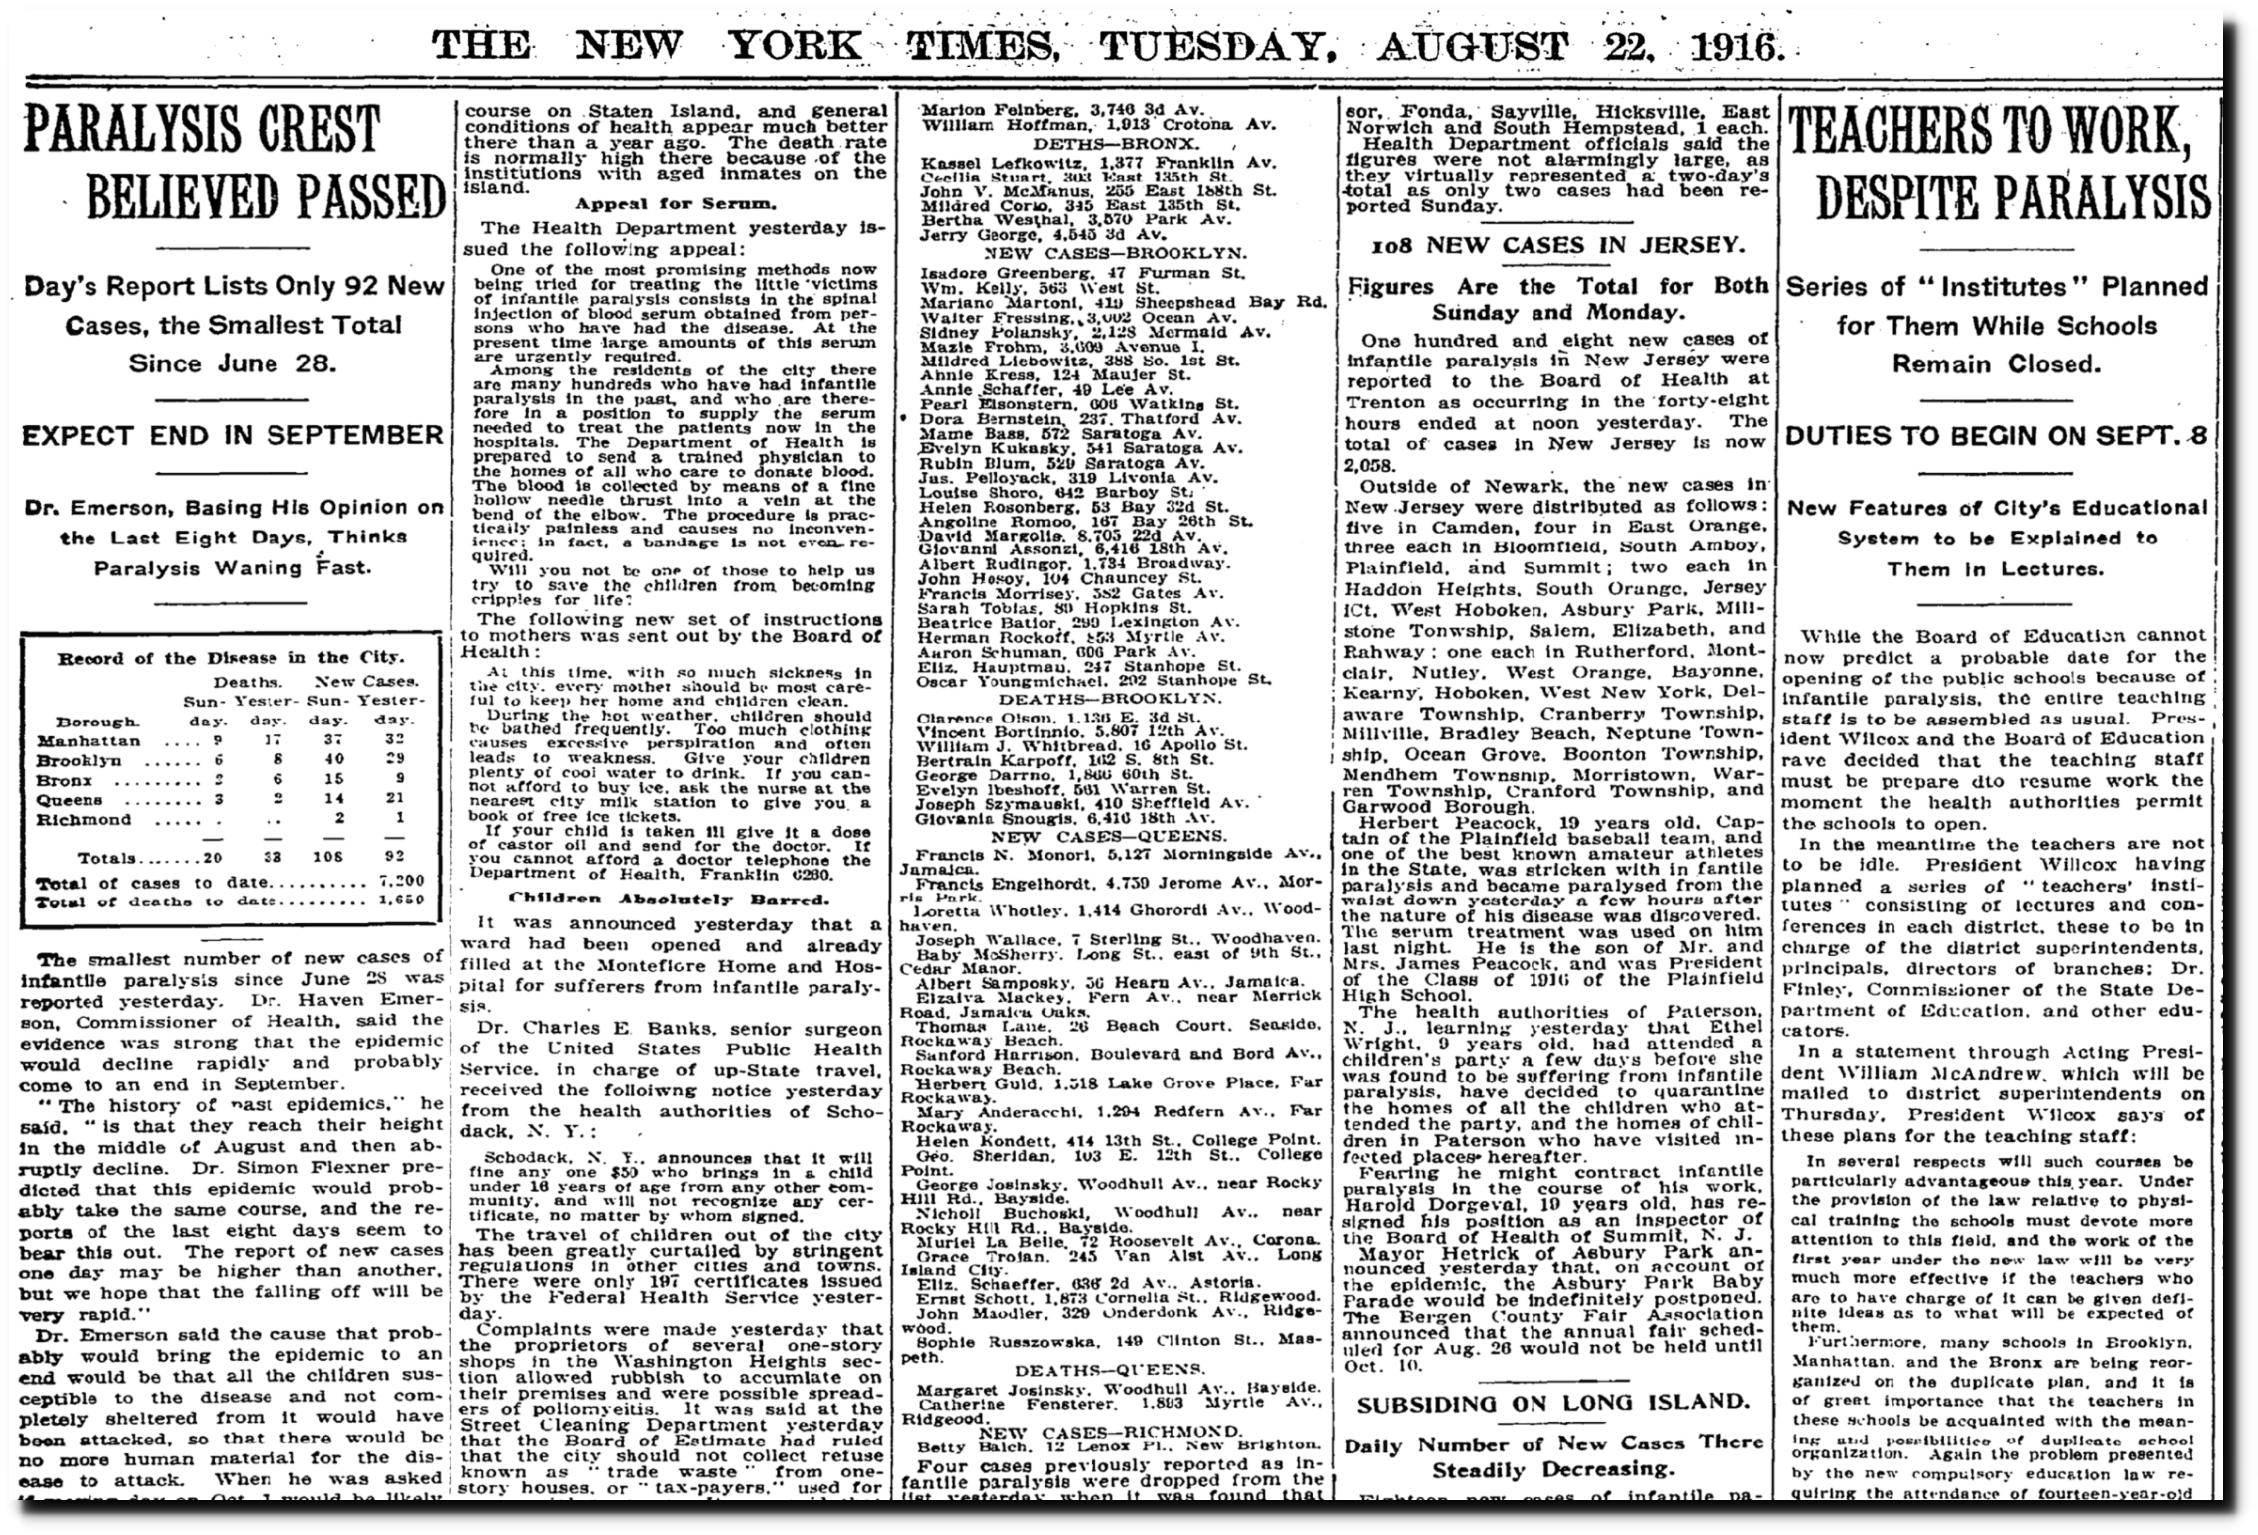
TimesMachine: Tuesday August 22, 1916 – NYTimes.com

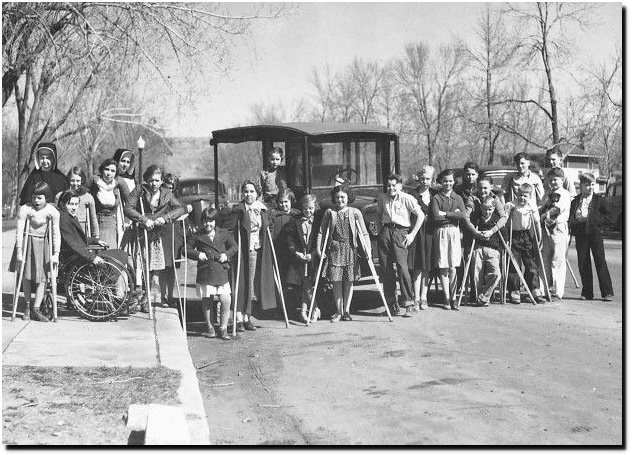
The polio epidemic spread all over the country. This 1916 photo was taken in Billings, Montana. (At least the children didn’t have to face an extra 0.0001 mole fraction CO2 in the atmosphere.)
And what about the weather? On this date in 1916, there were 100 degree temperatures from Oregon to upstate New York. Adrian, Michigan was the hottest place in the country at 106 degrees.

States over 100F on August 22, 1916 : Michigan 106, Oklahoma 105, Arizona 104, Kansas 102, Louisiana 102, Ohio 102, Texas 102, New York 101, Utah 101, Missouri 100, New Jersey 100, Oregon 100 and Pennsylvania 100.
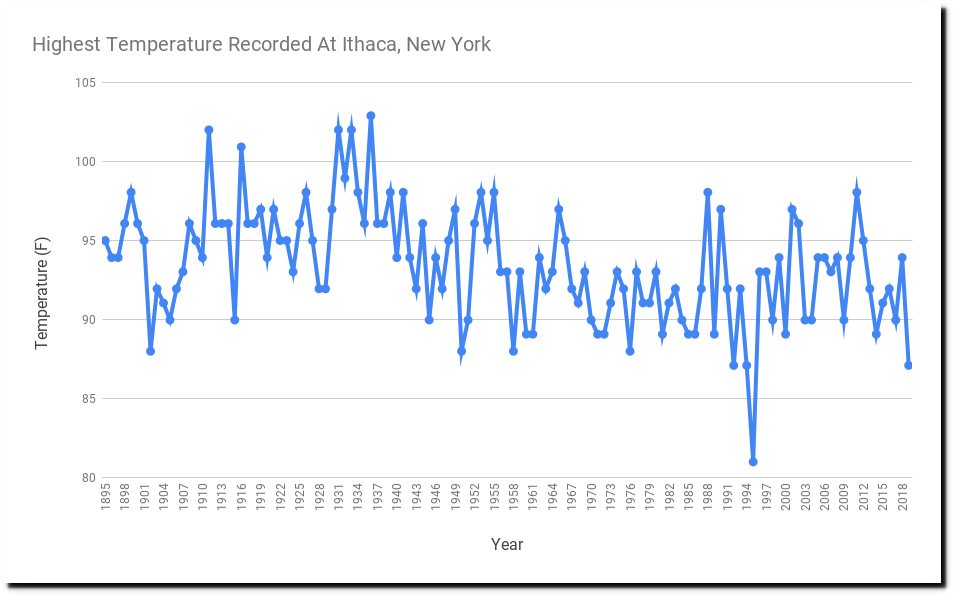
Ithaca NY was 101 degrees on this date in 1916. They have had a total of ten days over 100 degrees since 1895, all of which occurred more than 80 years ago.
All days over 100F at Ithaca, New York
7/3/1911    101
7/4/1911    102
7/5/1911    100
8/22/1916   101
7/2/1931    102
9/12/1931   100
6/29/1933   102
7/8/1936    101
7/9/1936    103
7/10/1936   102
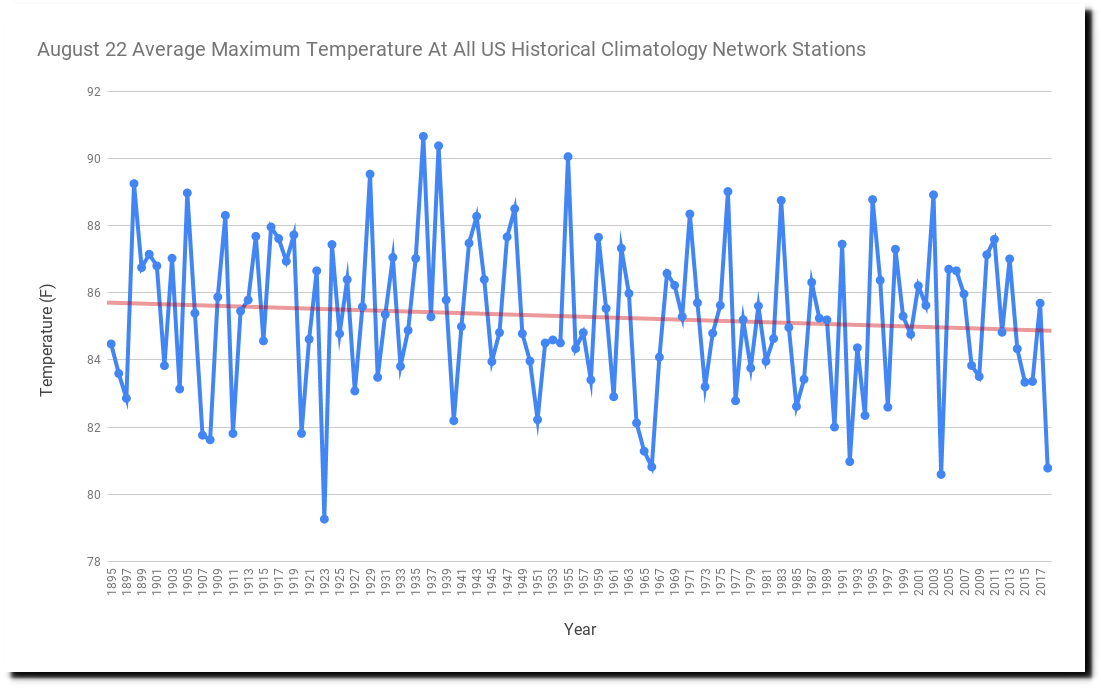
The hottest August 22 across the US occurred in 1936. The average afternoon temperature across the US that day was 91 degrees.
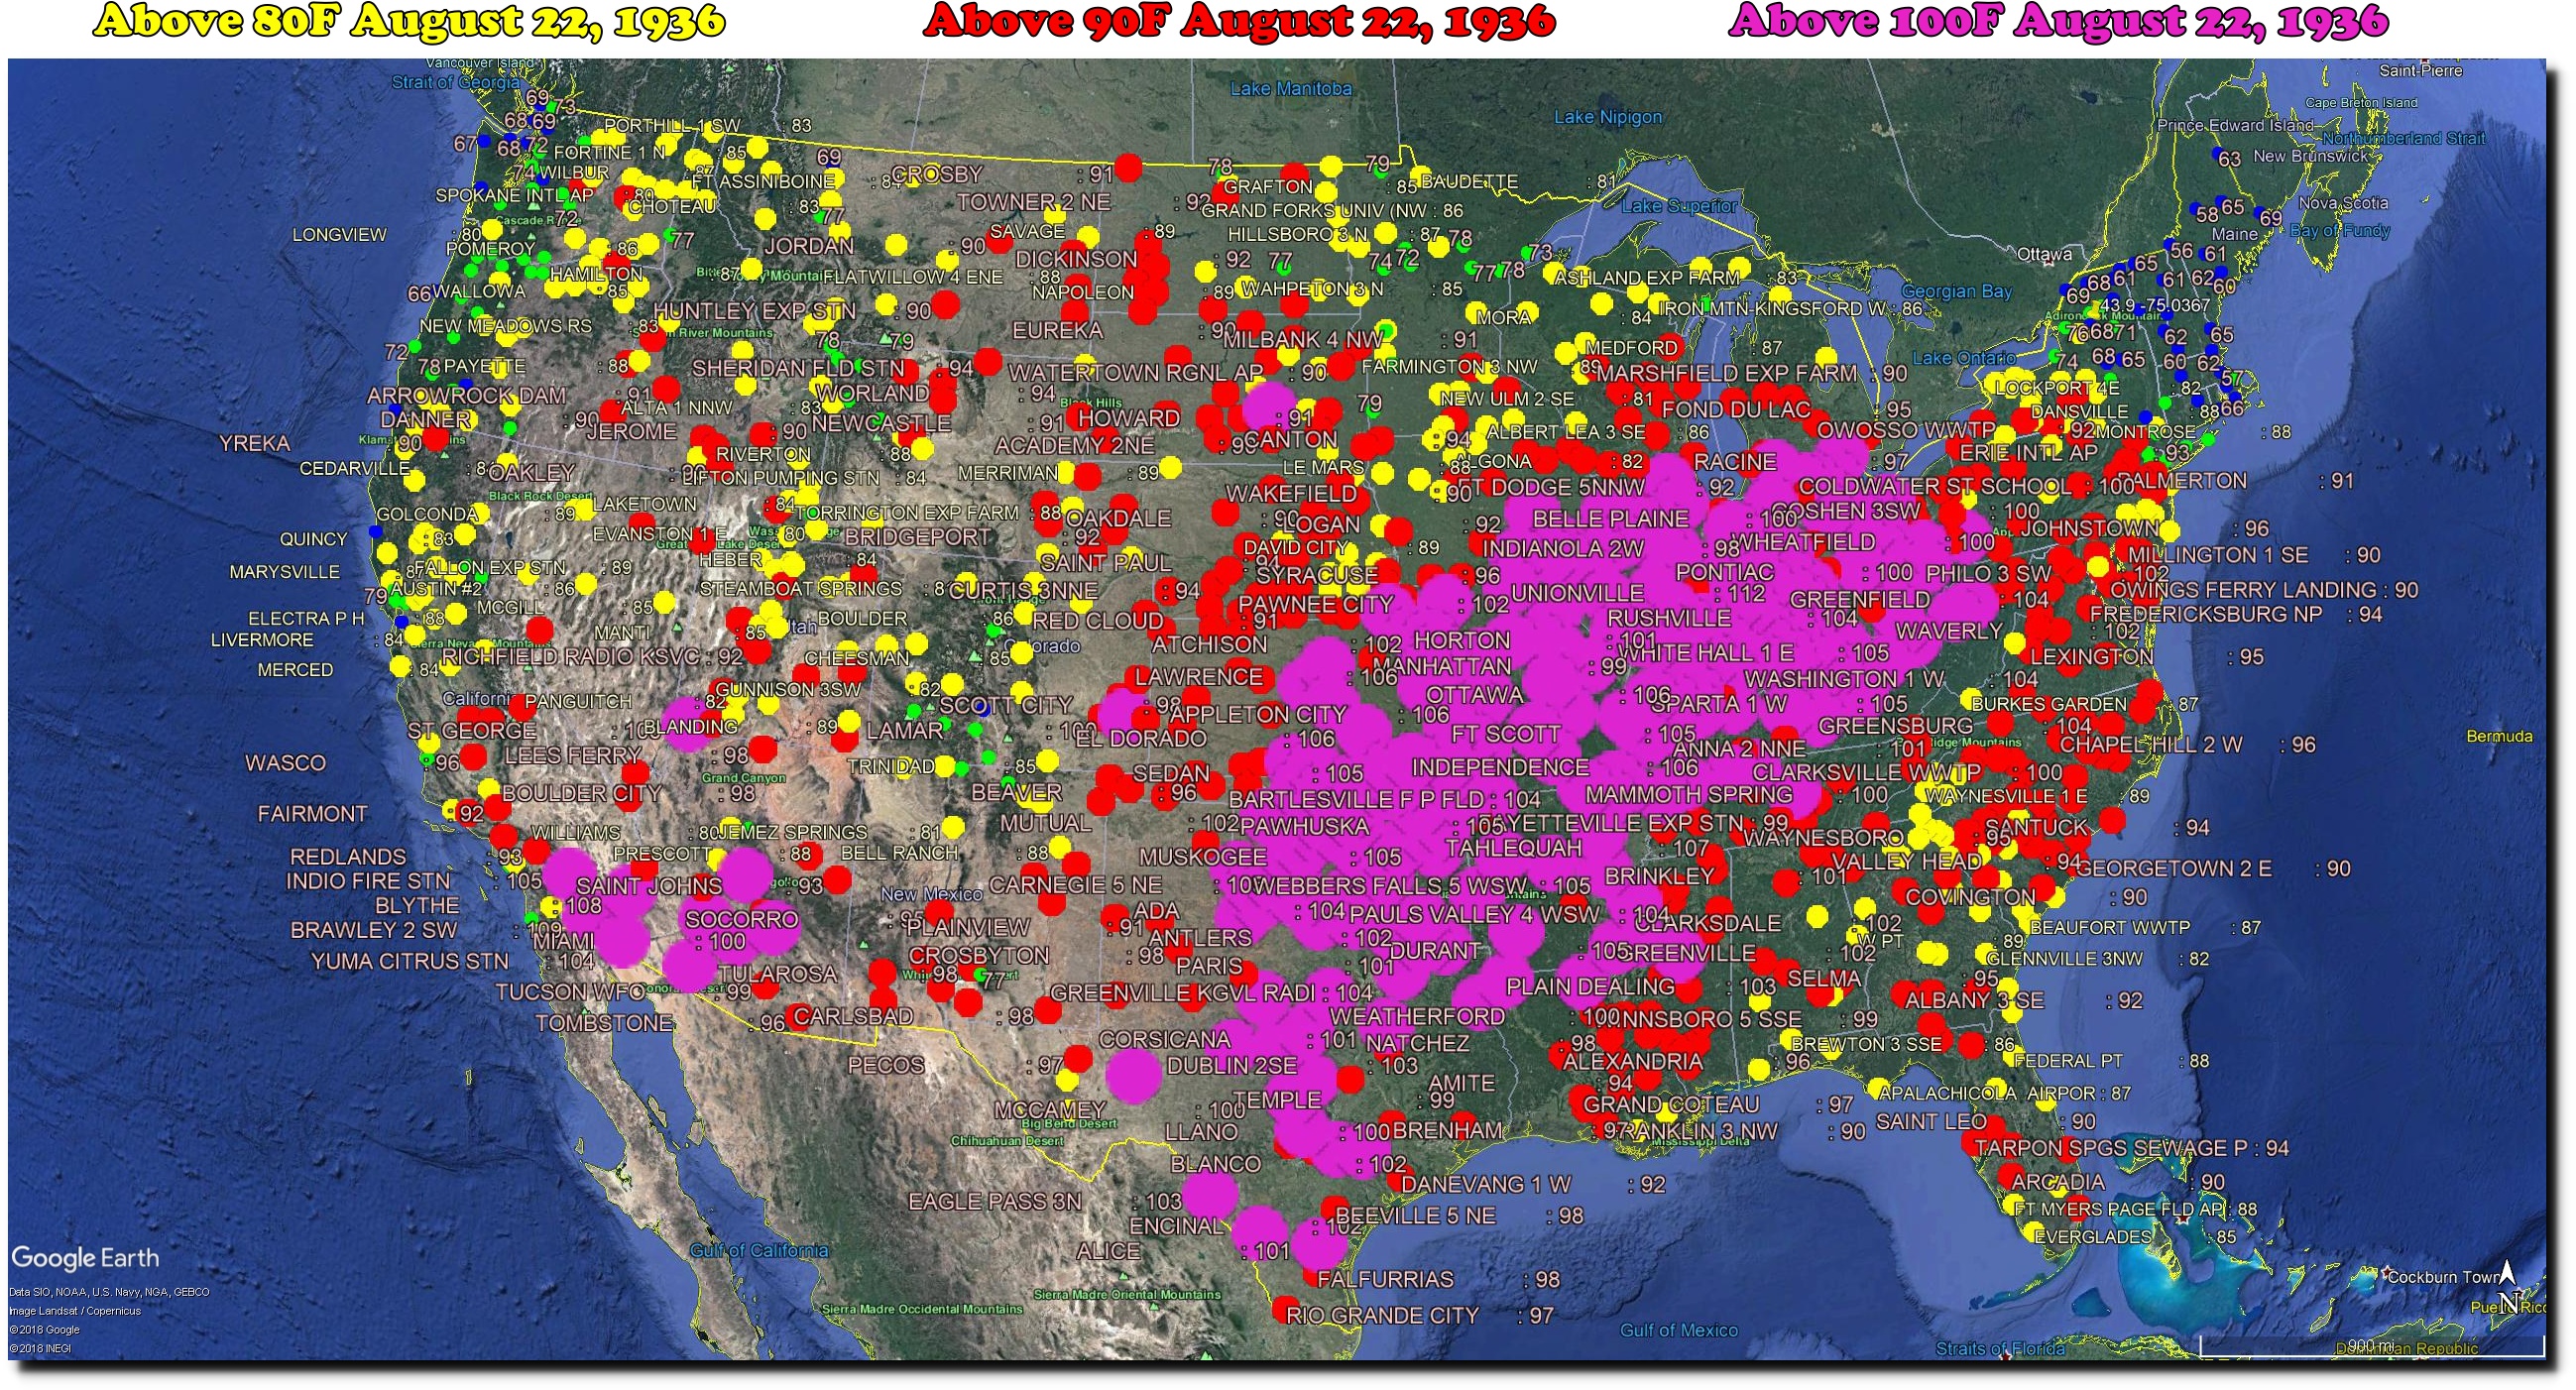
Four states were over 110 degrees and twenty-one states were over 100 degrees on this date in 1936 : Missouri 112, South Dakota 112, Indiana 111, Arizona 110, California 109, Texas 108, Illinois 107, Oklahoma 107, Arkansas 106, Kansas 106, Kentucky 105, Michigan 105, Tennessee 105, Ohio 104, Iowa 103, Louisiana 103, Mississippi 102, Nebraska 102, West Virginia 102, Colorado 100 and Utah 100.
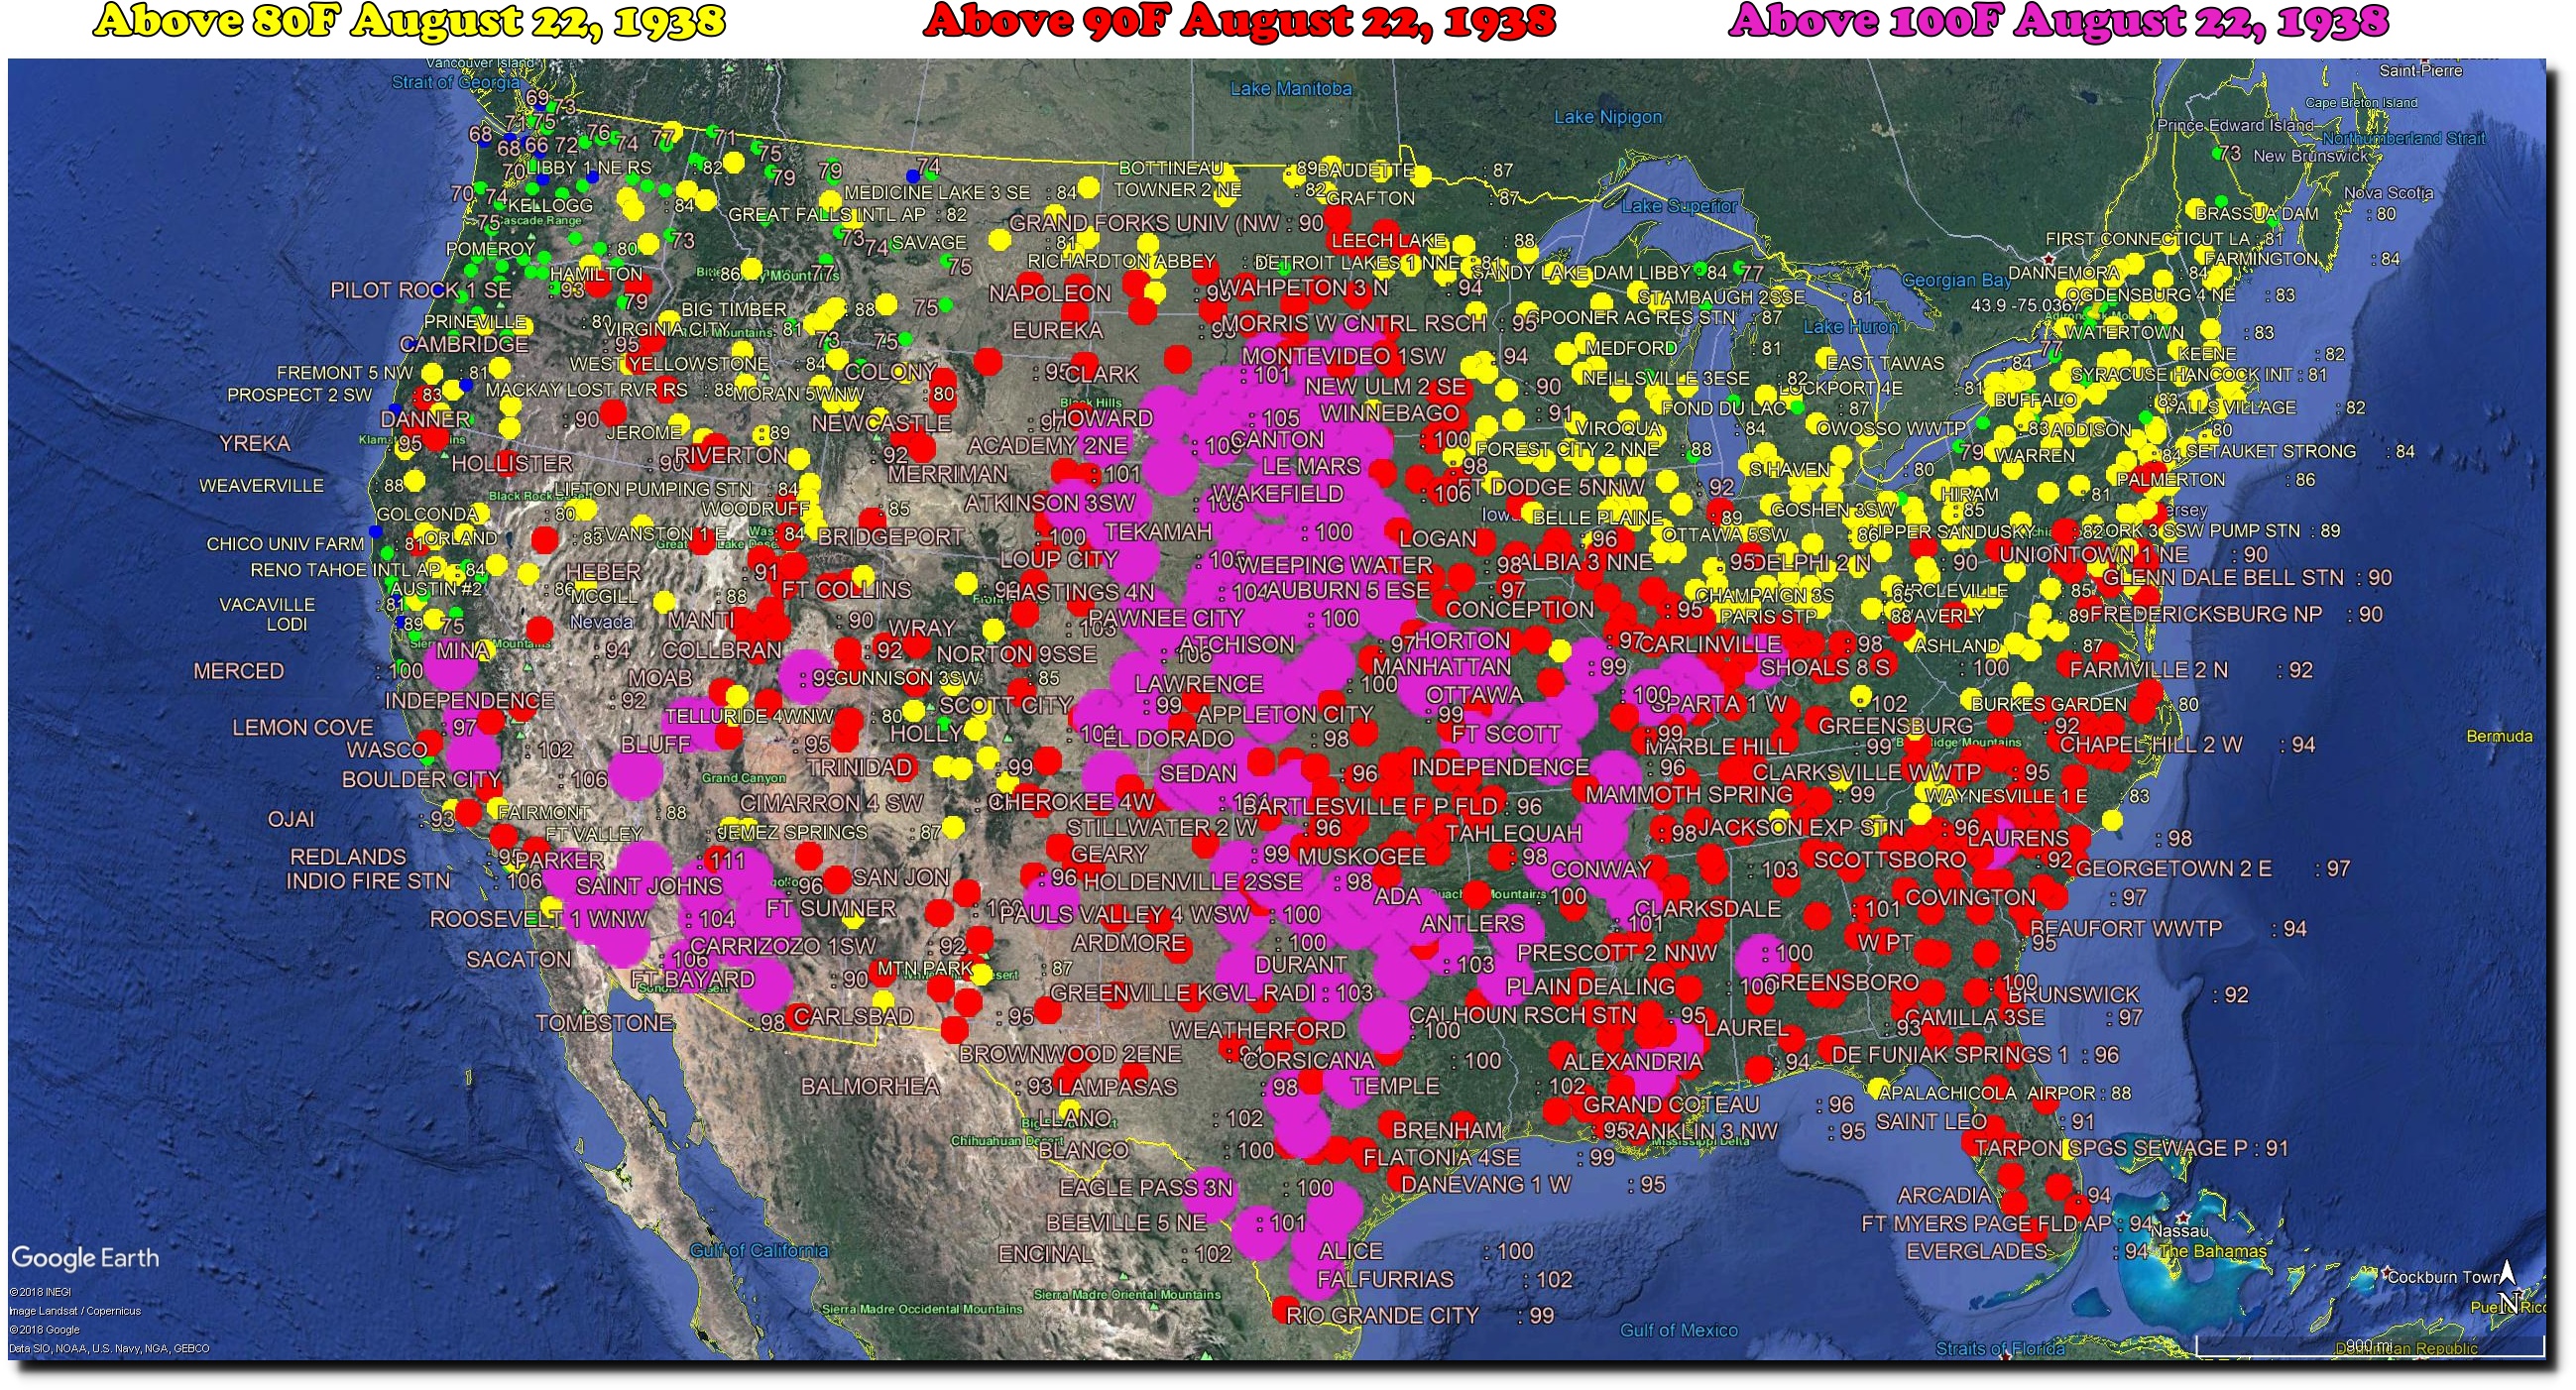
The second August 22 hottest occurred in 1938.
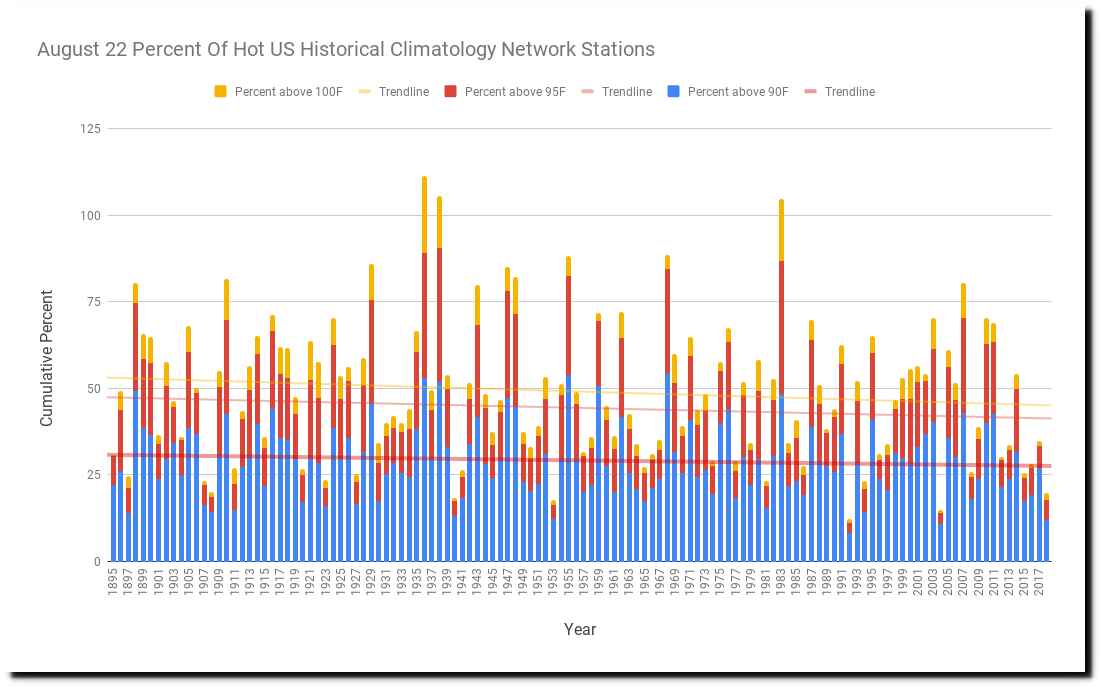
US August 22 afternoon temperatures have been declining since 1895.
The likelihood and areal coverage of hot weather has also been declining, with recent years among the coolest on record.
Two years after the polio outbreak of 1916, the deadliest pandemic in history killed as many as 40 million people, most of them young.
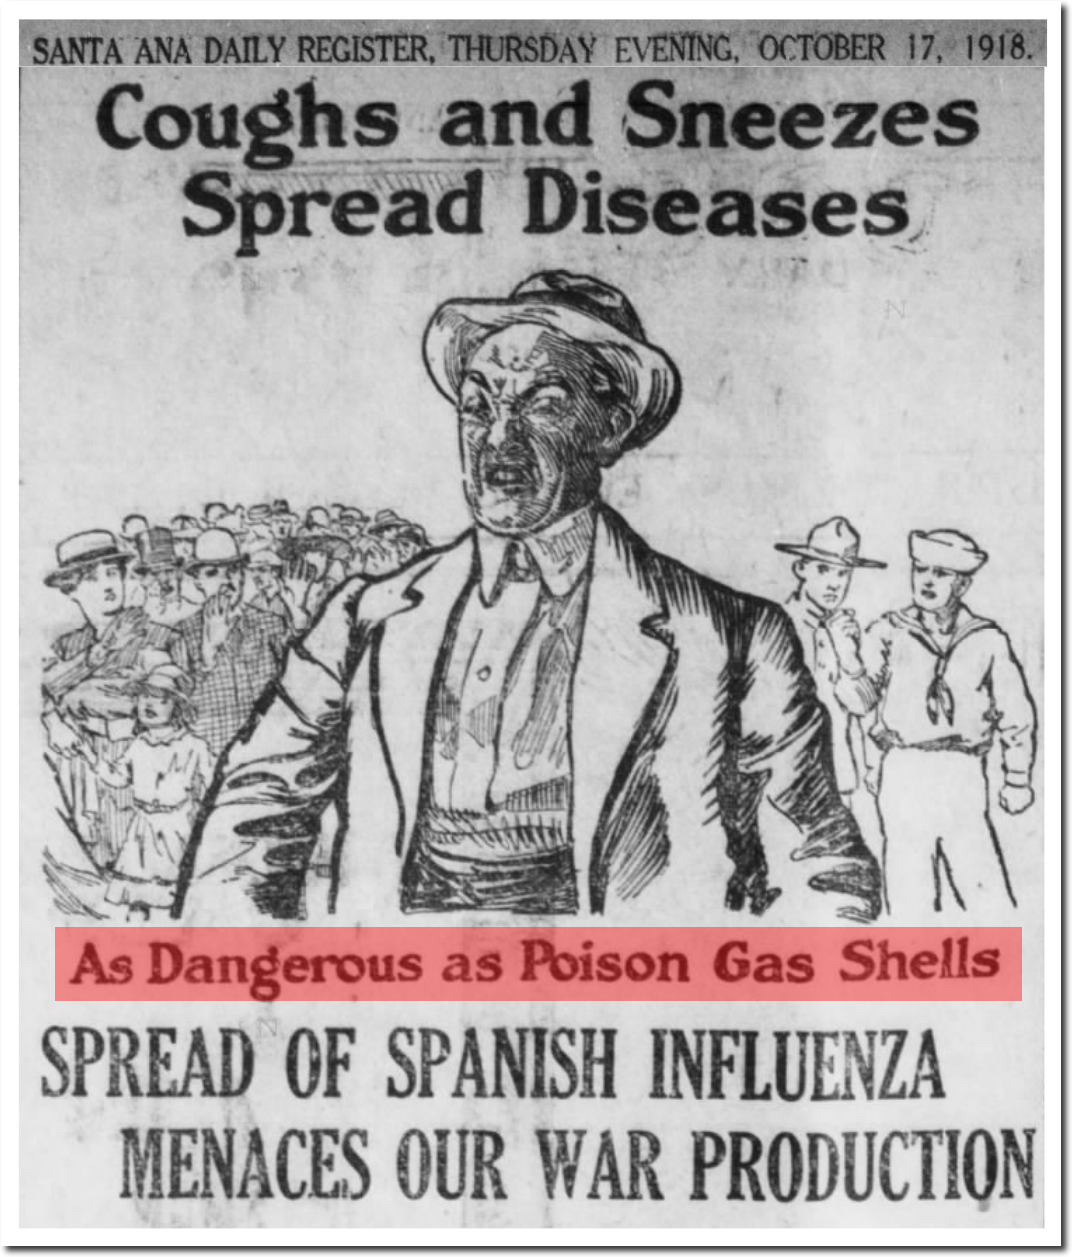
17 Oct 1918, Page 8 – Santa Ana Register at Newspapers.com
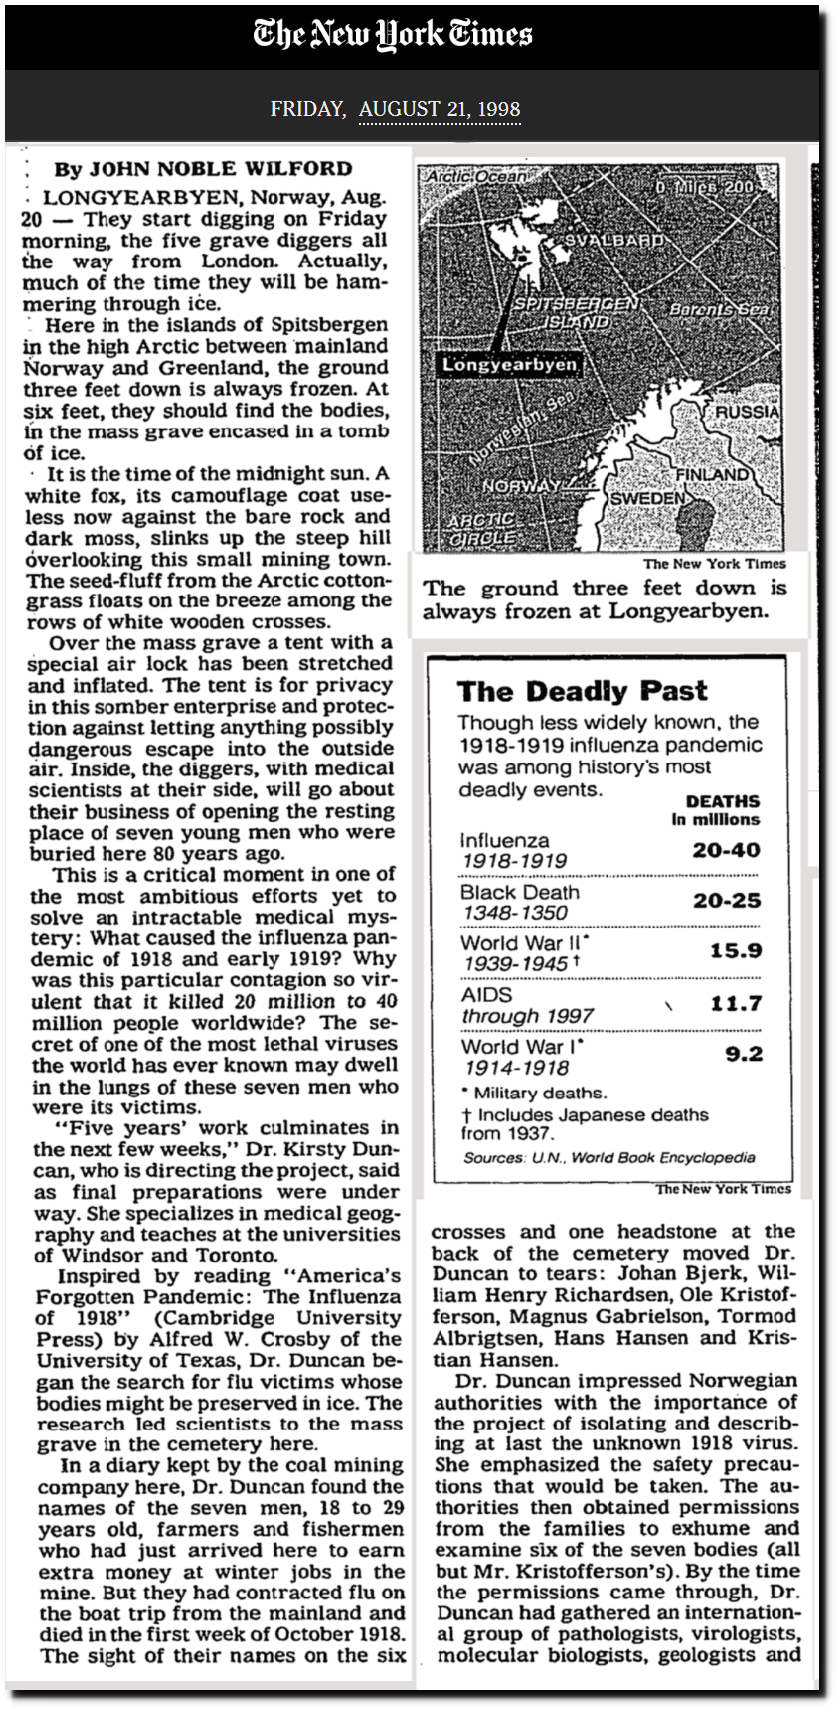
TimesMachine: August 21, 1998 – NYTimes.com
Greta is scheduled to speak at the UN when her yacht arrives, as their official science expert. In this role she replaces another high school dropout with a 450 foot long yacht.

To his credit, Leo DiCaprio always brings lots of climate models on the yacht with him.
Nothing Greta has been taught has any basis in reality. The Greta situation is a good reminder of how evil the people behind this scam are.
Posted in Uncategorized
Leave a comment
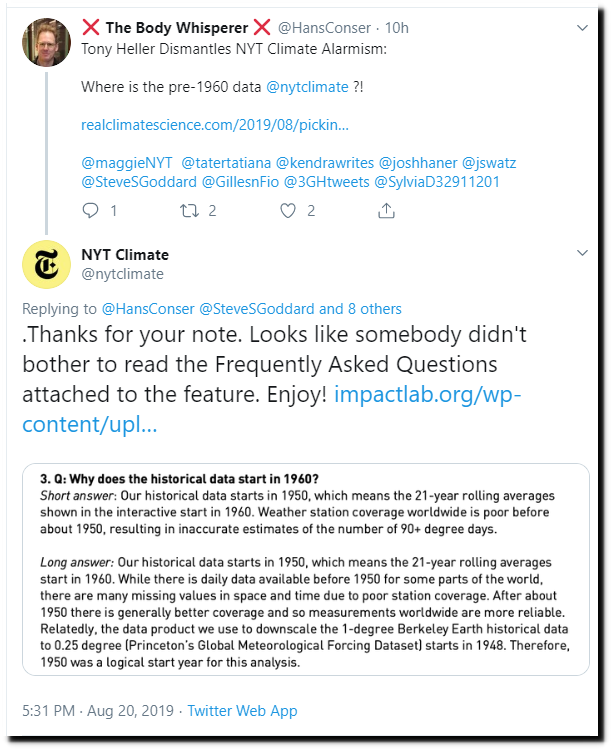
New York Times Explains Why The Global Temperature Record Is Useless
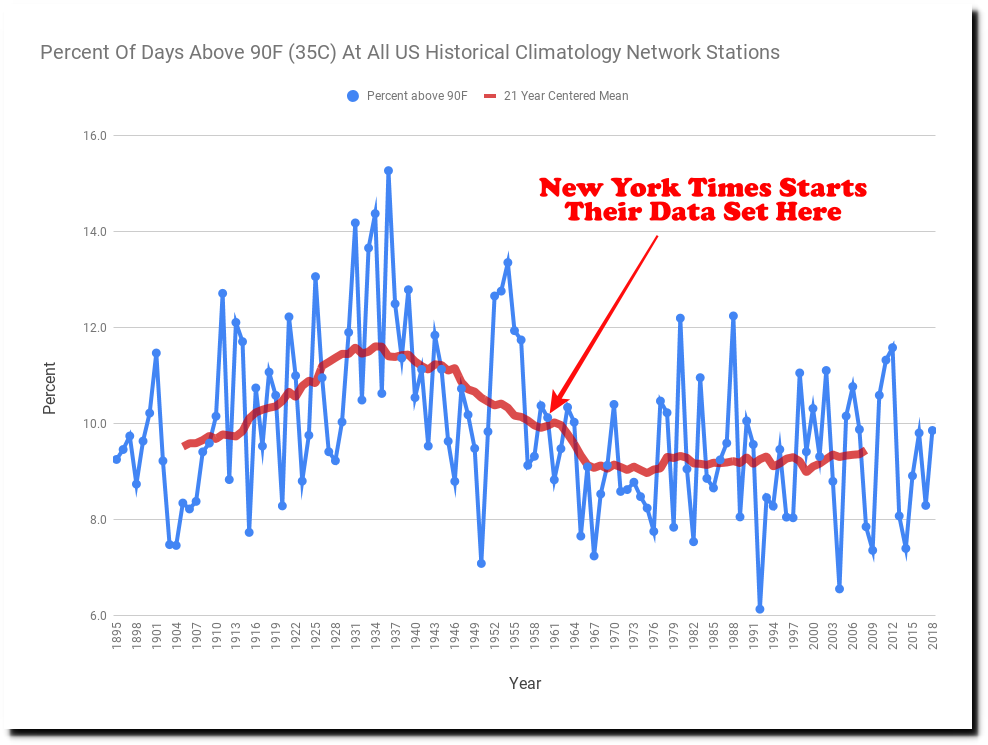
In a previous blog post, I showed how the New York Times is hiding all the hot weather prior to 1960.
The New York Times has responded to this criticism, by stating that there isn’t much data in most of the world before 1950, due to poor station coverage.
This map from the NOAA Global Historical Climatology Network confirms the New York Times assertion. Outside the US, there is very little high quality data prior to 1950.
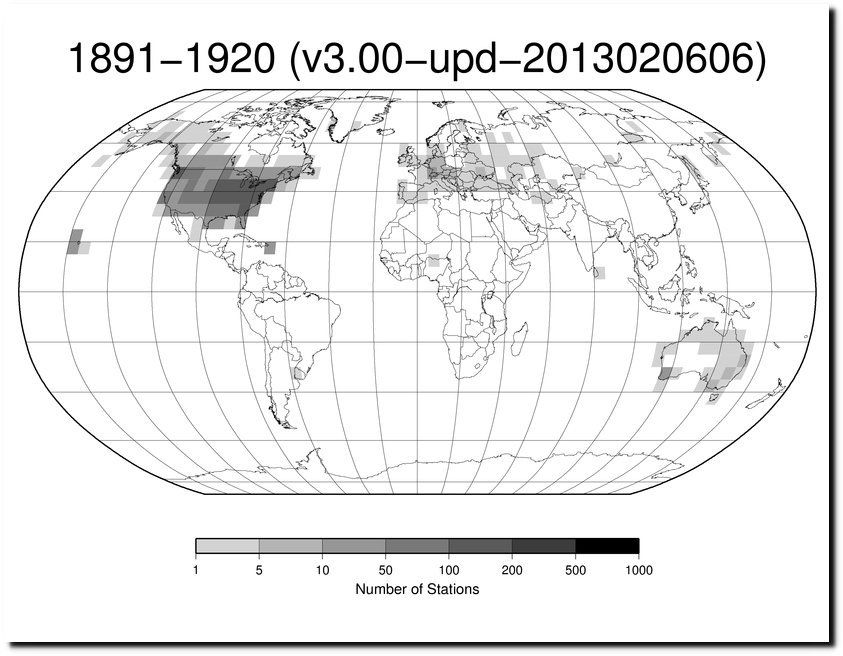
ftp://ftp.ncdc.noaa.gov/pub/data/ghcn/daily/figures/station-counts-1891-1920-temp.png
Here in the US, the story is completely different. There was more data available every year of the past century than there was in 2018.
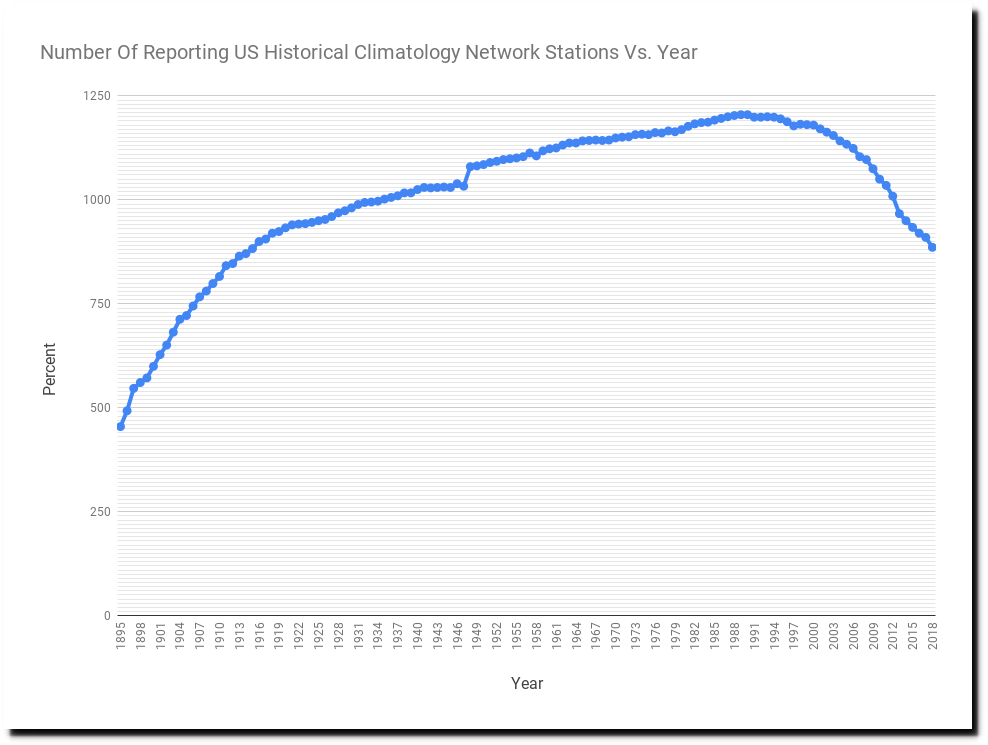
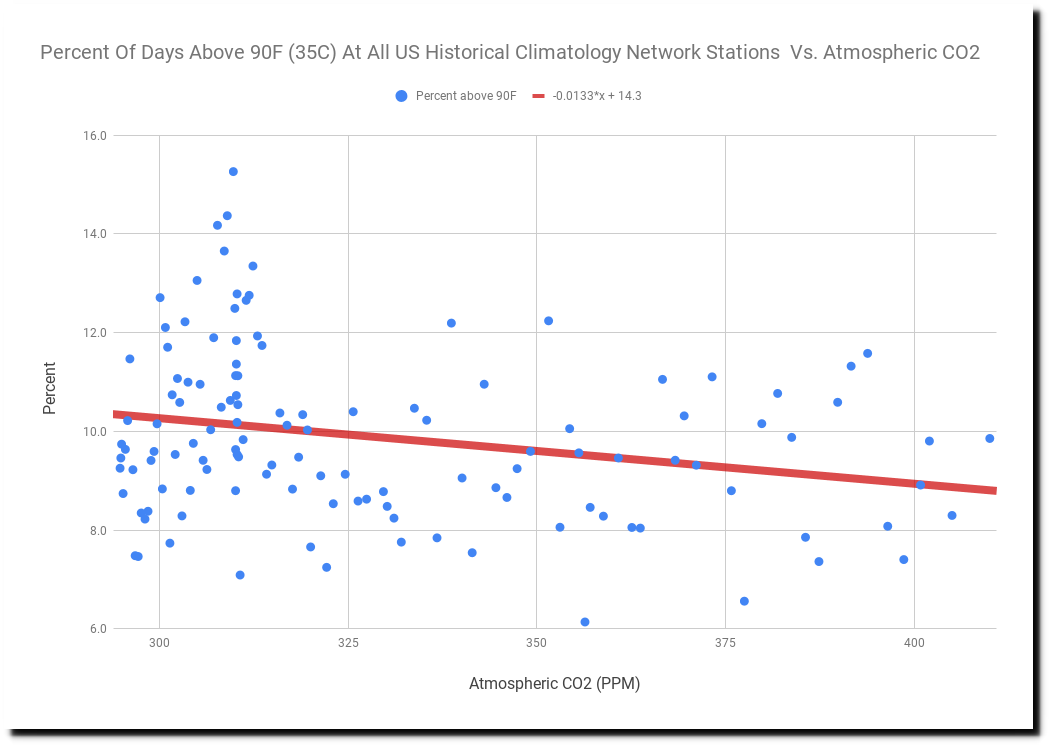
So there is no excuse for for them cherry-picking a start date of 1960 for US stations, failing to point out that the frequency of hot days has declined sharply in the US as CO2 has increased, and not mentioning that their projections of increasing hot days has no scientific basis.
But what they did get correct, is their assertion that the global temperature data prior to 1950 is inadequate for use in statistics, and shouldn’t be graphed. This is what I have been saying for the past dozen years, and I greatly appreciate them confirming my work.
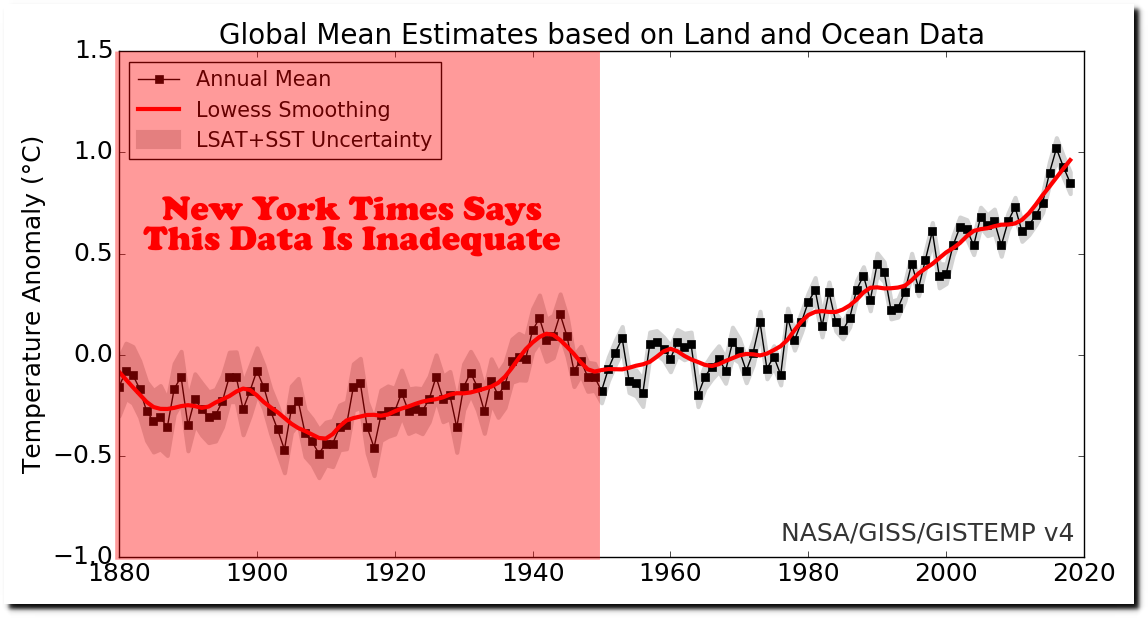
The pre-1960 data which the New York Times is hiding in the US shows that the past was much hotter. Without adequate coverage elsewhere, there is no reason to believe the same trend didn’t occur in other parts of the world. The New York Times is making a very strong argument against the credibility of the global temperature graphs – which serve as the basis of the EPA CO2 Endangerment Finding. This will be very helpful.
Posted in Uncategorized
Leave a comment
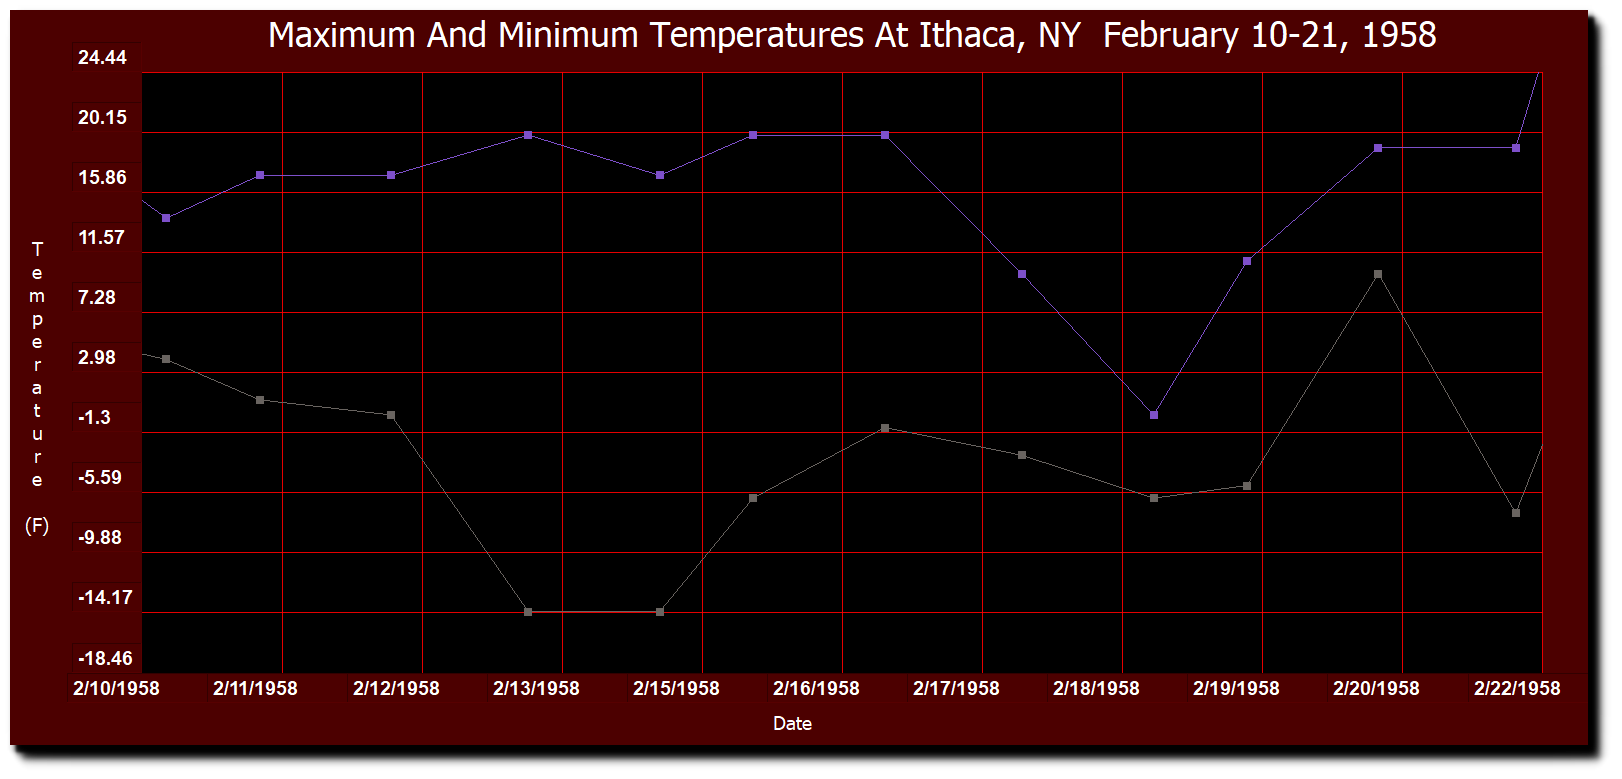
The February Blizzard Of 1958

I’m visiting friends at the Finger Lakes in NY, where my life started. One of them grew up on a farm there in the 1950s and told me about a terrible blizzard in February, 1958 which cut them off for weeks and forced them to dump all of the milk they were producing -because there was no way to get to market. So I did some research and found out that Ithaca never made it above 20F from February 10-21, 1958.
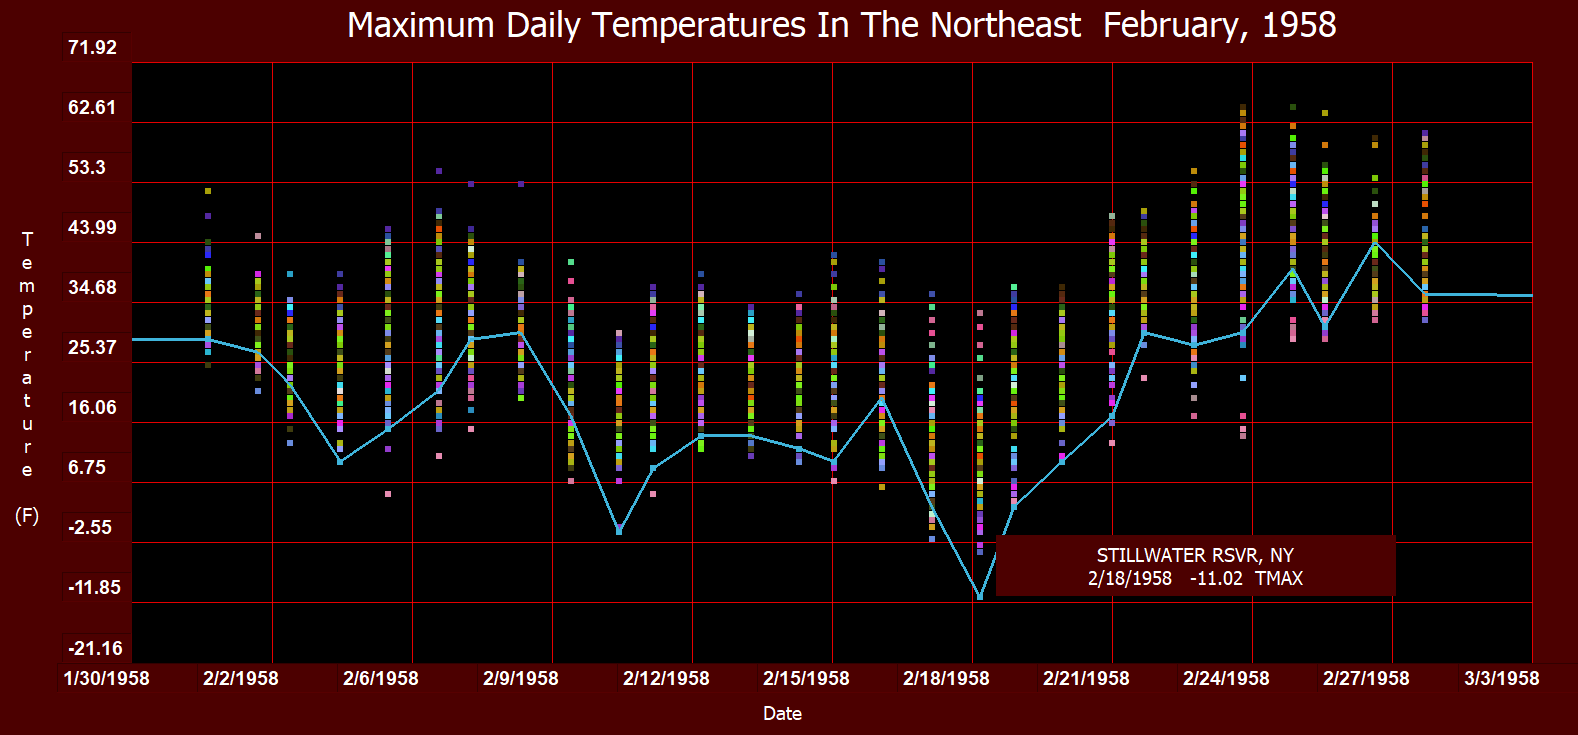
Stillwater Reservoir, New York never made it above -11F on February 18.
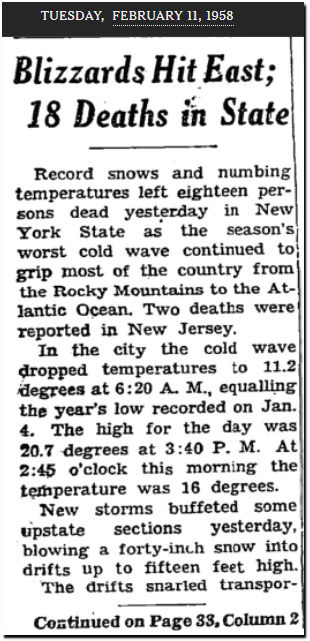
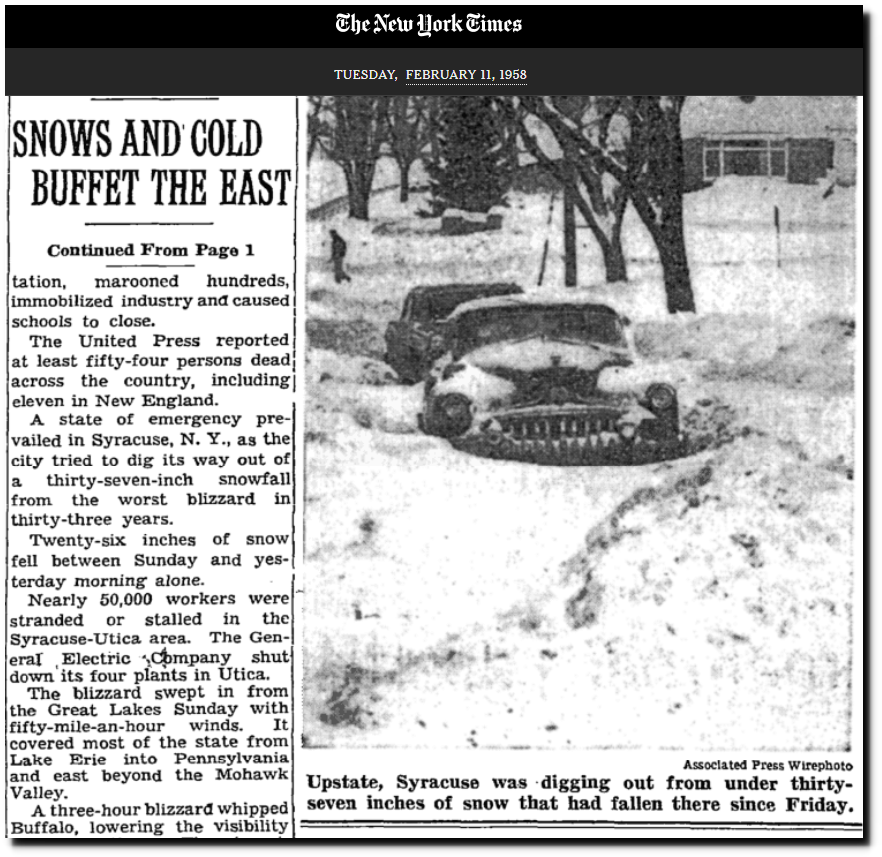
TimesMachine: February 11, 1958 – NYTimes.com
Florida’s vegetable crop was wiped out by the cold.
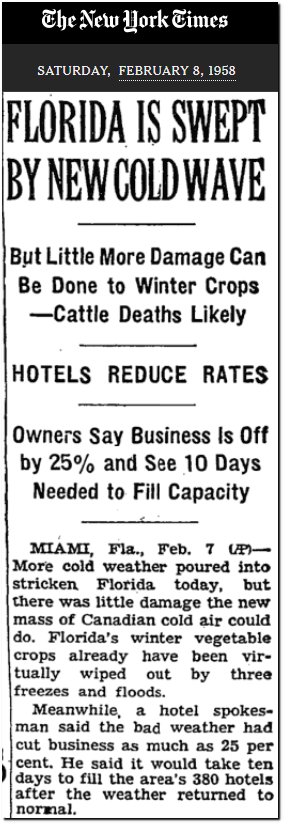
TimesMachine: February 8, 1958 – NYTimes.com
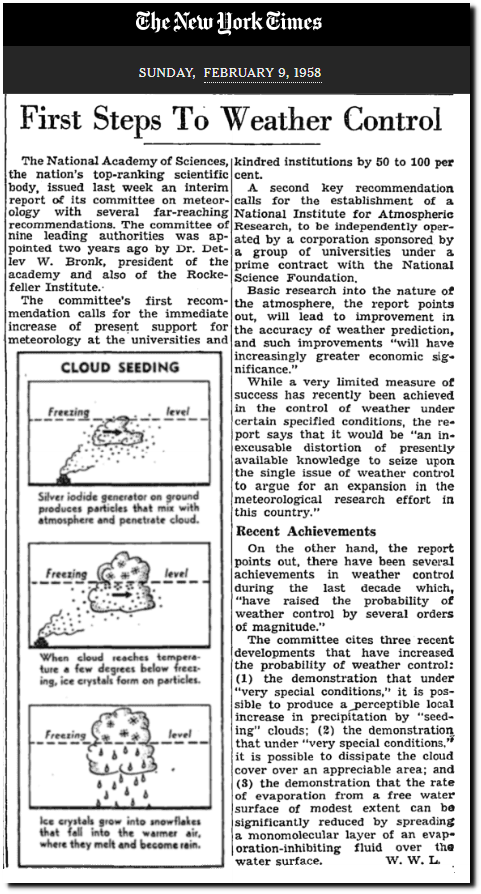
And the National Academy of Sciences said they could control the weather if you sent them money. They called for the creation of a National Center for Atmospheric Research, which now exists in Boulder, gets 180 million dollars in taxpayer money per year, and generates many wildly fraudulent claims about the climate – which I will be discussing more soon.
Posted in Uncategorized
Leave a comment
Picking Cherries In New York Wine Country
I was born in New Mexico, but my life began in Ithaca, New York. I am in the spectacular Finger Lakes country for a few days, and thought I would check in with the New York Times about the future climate here.
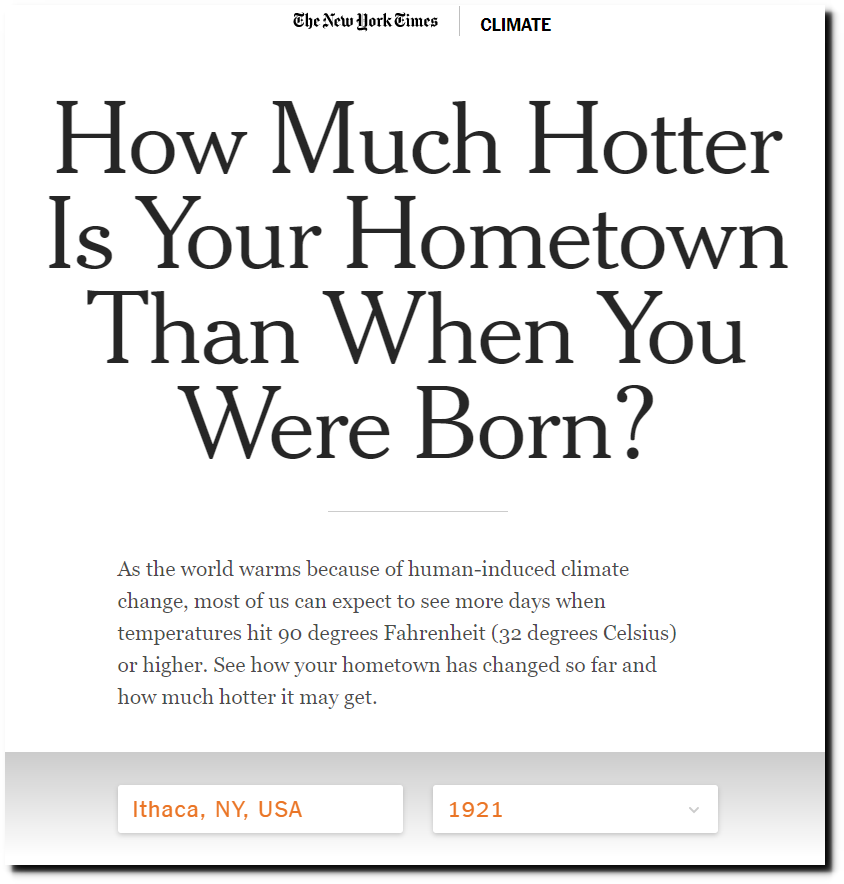
How Much Hotter Is Your Hometown Than When You Were Born? – The New York Times
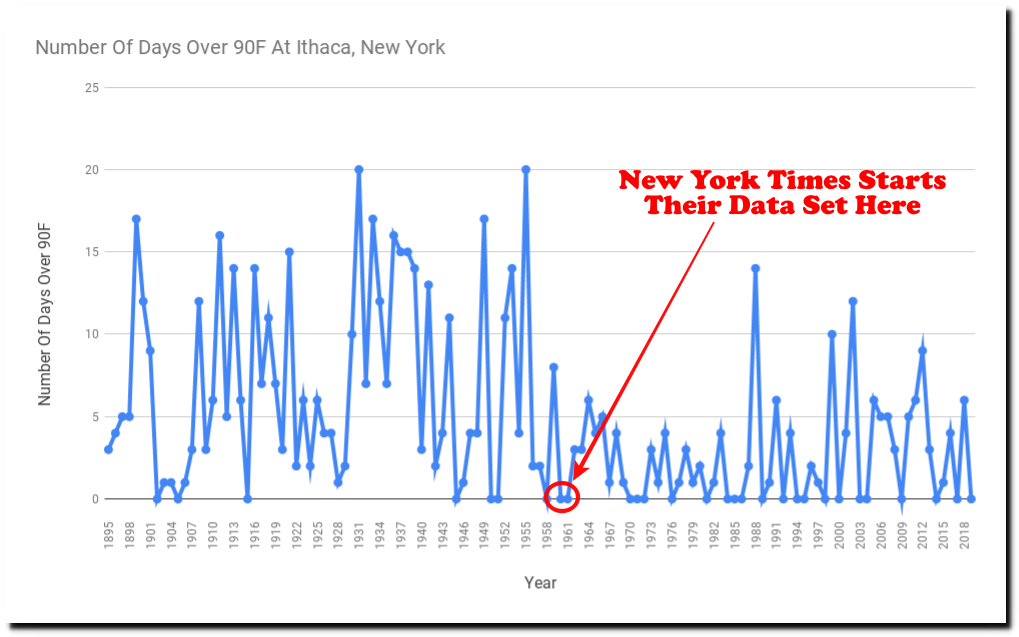
The New York Times has dates going back to 1921 in their menu – but if you submit a date before 1960, this message comes up:
Our dataset goes back to 1960

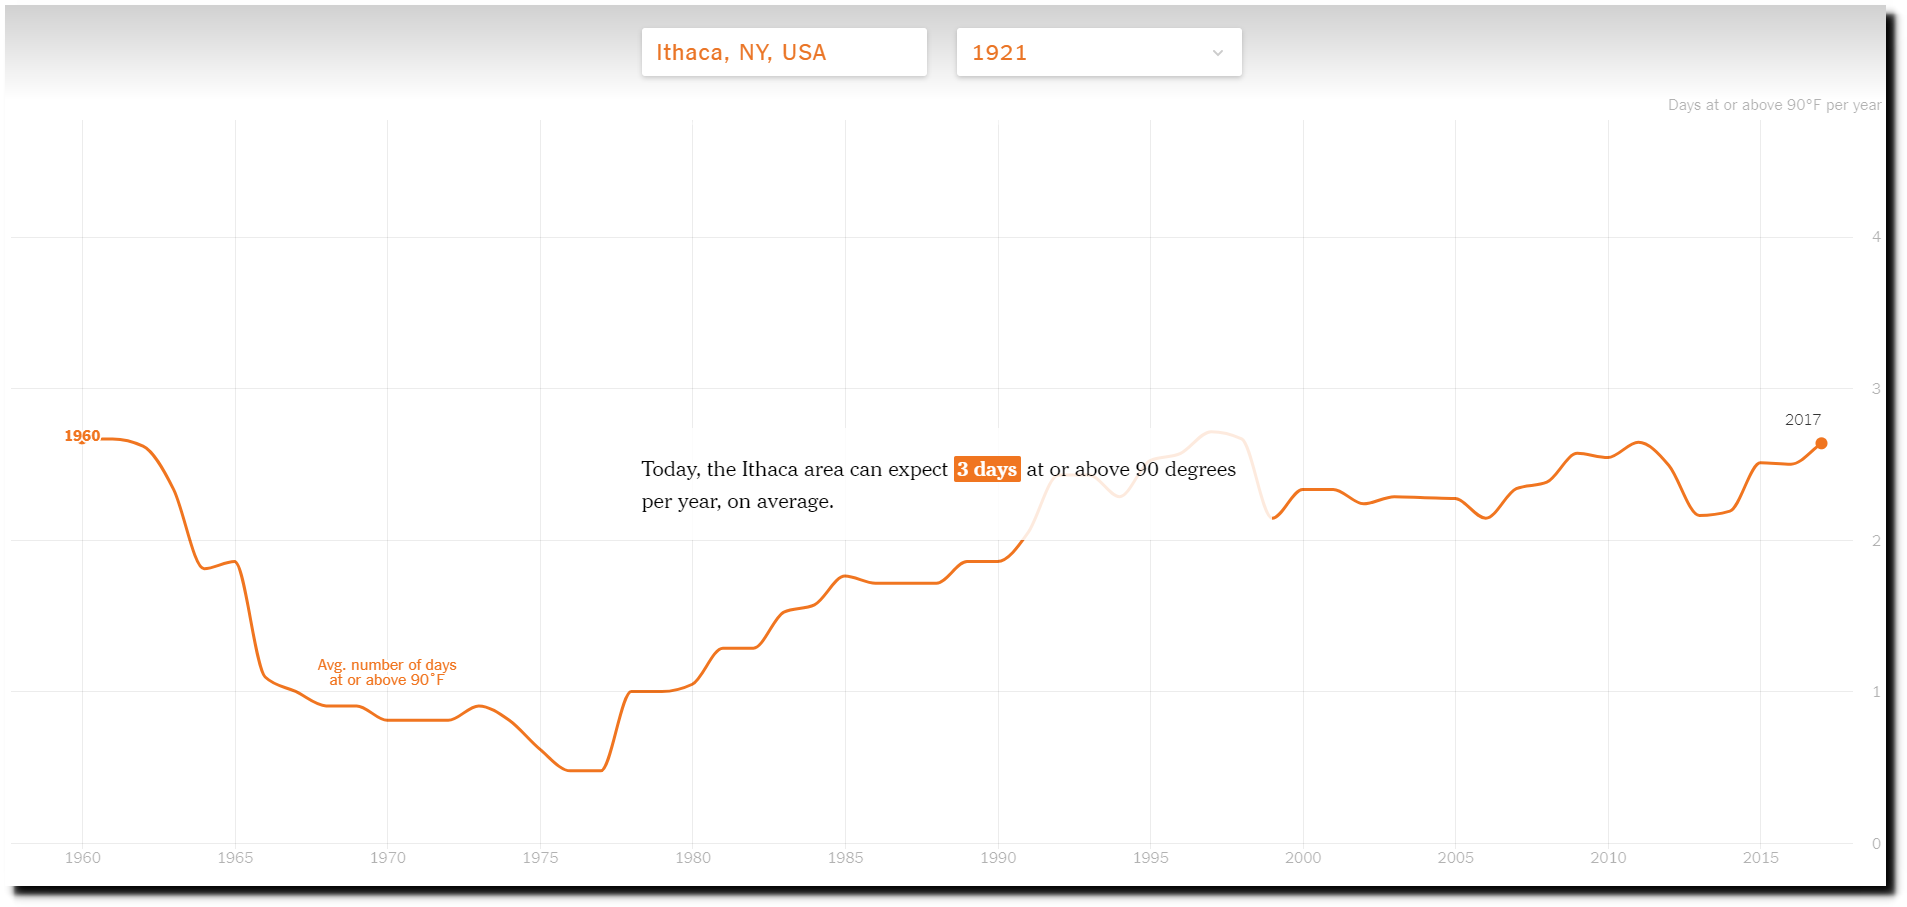
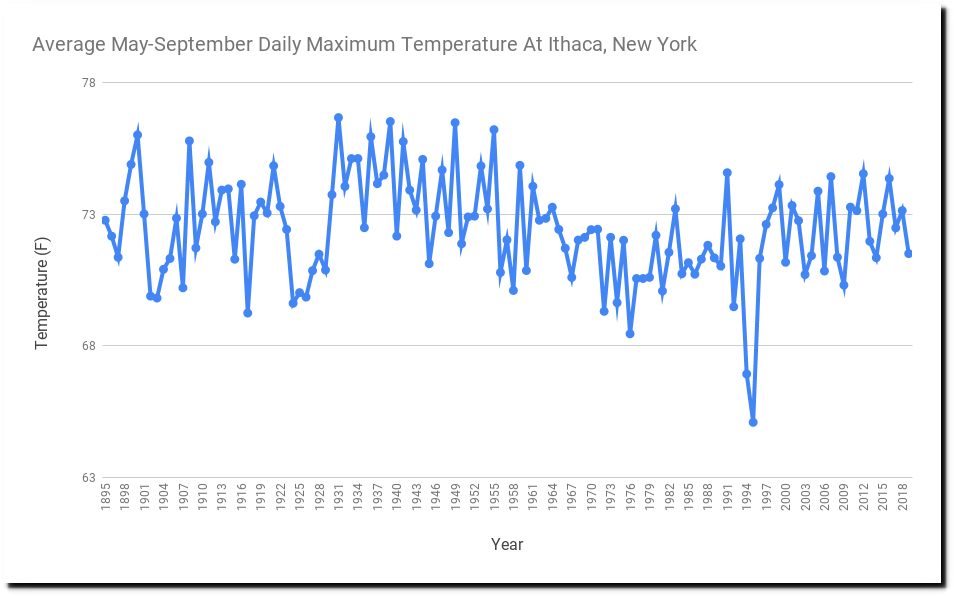
There is plenty of data from before 1960. But they hide it because it completely destroys their “climate change” propaganda. Ithaca was much hotter when CO2 levels were lower. The 1960 start date is carefully cherry-picked.
Then they make a forecast of Ithaca burning up, based on hiding historical data and models which are completely discredited by the data they are hiding.
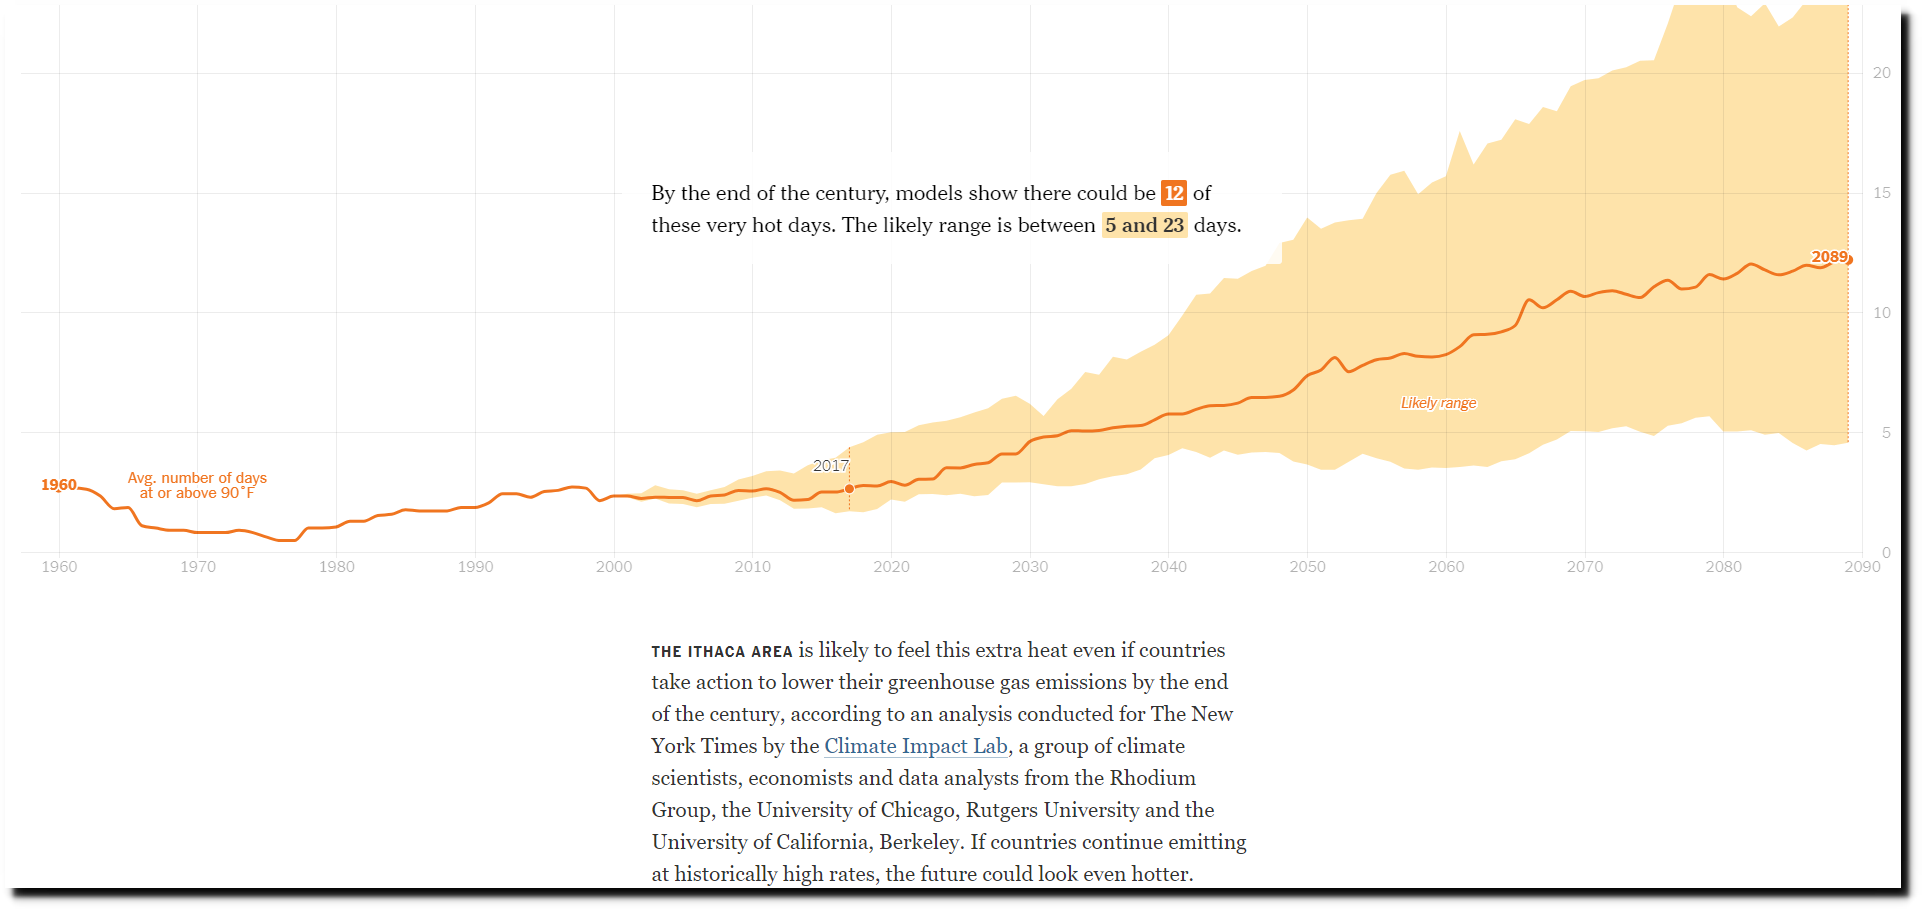
Ithaca was much hotter before I was born. But the New York Times has no interest in facts. They are pushing propaganda towards a political goal.
Posted in Uncategorized
Leave a comment
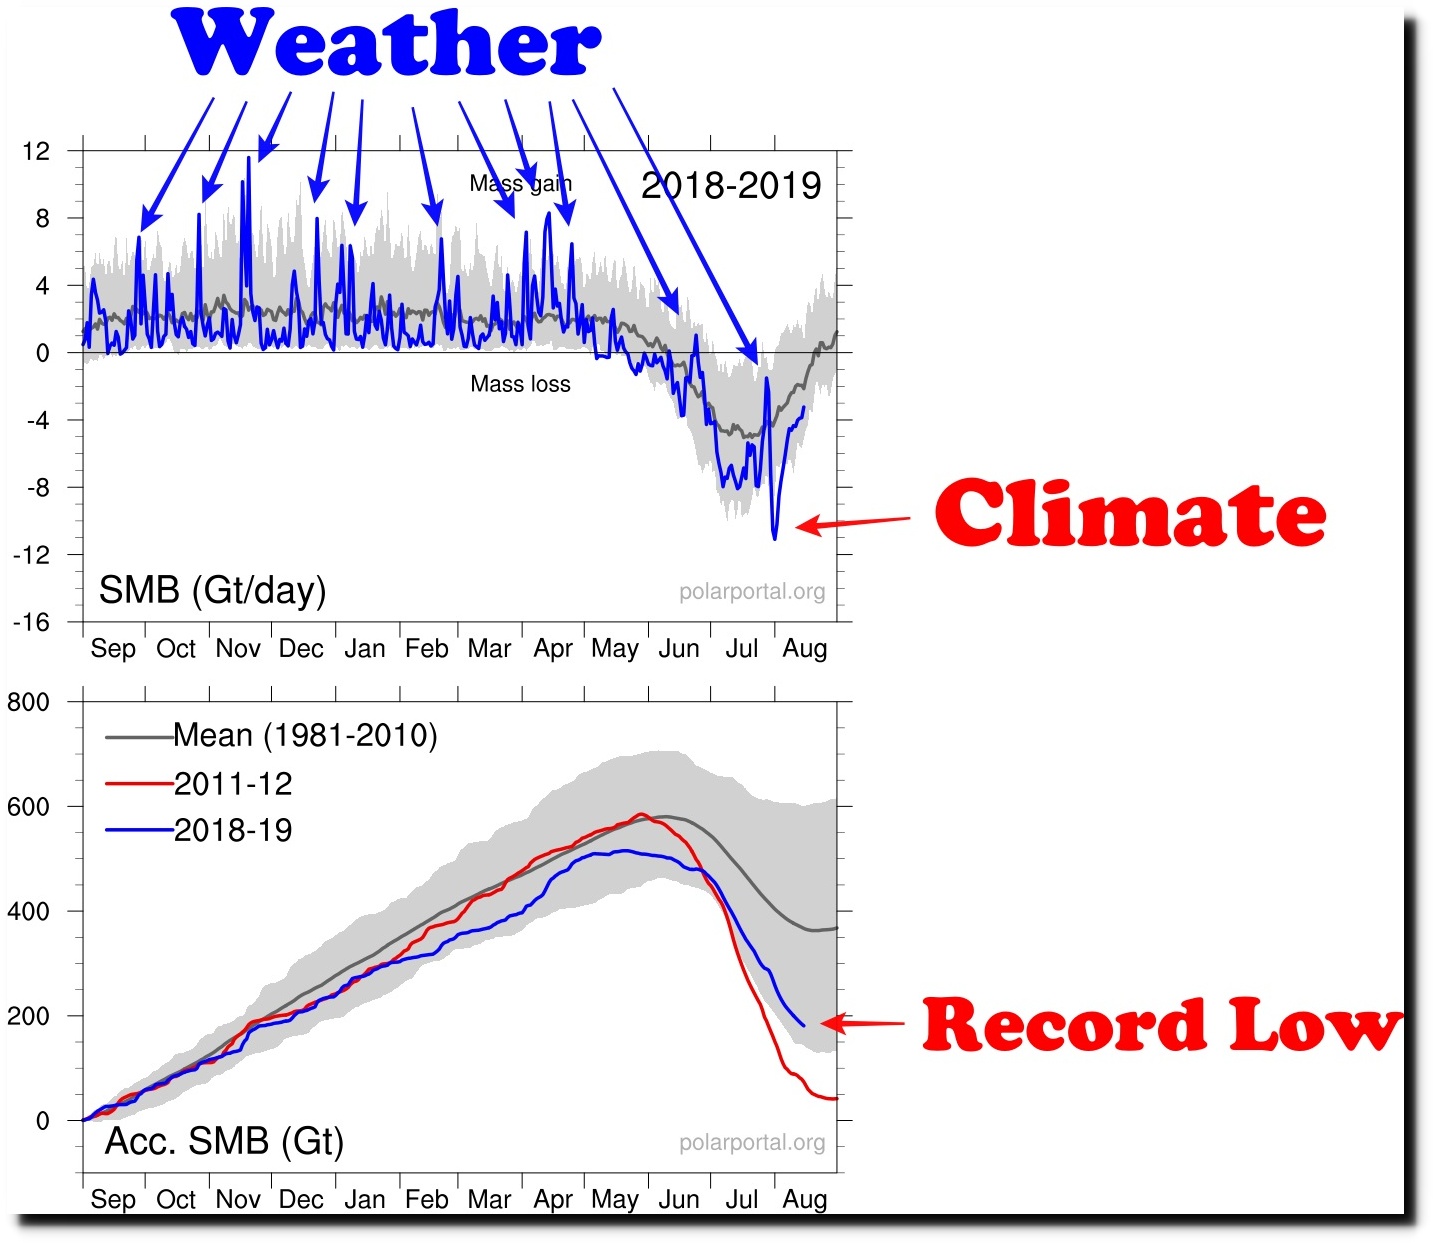
Climate Glossary
Climate science is complex, and the terminology can be tricky. I created this visual glossary of Greenland Surface Mass Balance to help guide people through it.
Posted in Uncategorized
Leave a comment