
Disrupting the Borg is expensive and time consuming!

Google Search
-
Recent Posts
- One Atomic Bomb Per Hour
- New Video : Analyzing Oil And Gas
- Is Antarctica Melting?
- High Speed Analysis And Visualization
- El Nino To The Rescue?
- Fake News Update
- Growth Of Antarctic Sea Ice
- 65 Years Of Progress!
- El Nino To The Rescue?
- Worst March Drought On Record
- ChartGL Process Control Demo
- The Biggest Money Laundering Scam
- Drought In The Headwaters Of Lake Powell
- Unrealistic Expectations Of Water Availability
- Did Bill Gates Do This?
- Worst March Drought On Record In The US
- The Real Hockey Stick Graph
- Analyzing The Western Water Crisis
- Gaslighting 1924
- “Why Do You Resist?”
- Climate Attribution Model
- Fact Checking NASA
- Fact Checking Grok
- Fact Checking The New York Times
- New Visitech Features
Recent Comments
- Gordon Vigurs on One Atomic Bomb Per Hour
- Gordon Vigurs on One Atomic Bomb Per Hour
- Gordon Vigurs on One Atomic Bomb Per Hour
- Bob G on One Atomic Bomb Per Hour
- Robertvd on One Atomic Bomb Per Hour
- czechlist on One Atomic Bomb Per Hour
- conrad ziefle on One Atomic Bomb Per Hour
- conrad ziefle on One Atomic Bomb Per Hour
- D. Boss on One Atomic Bomb Per Hour
- D. Boss on One Atomic Bomb Per Hour
August 13, 1936
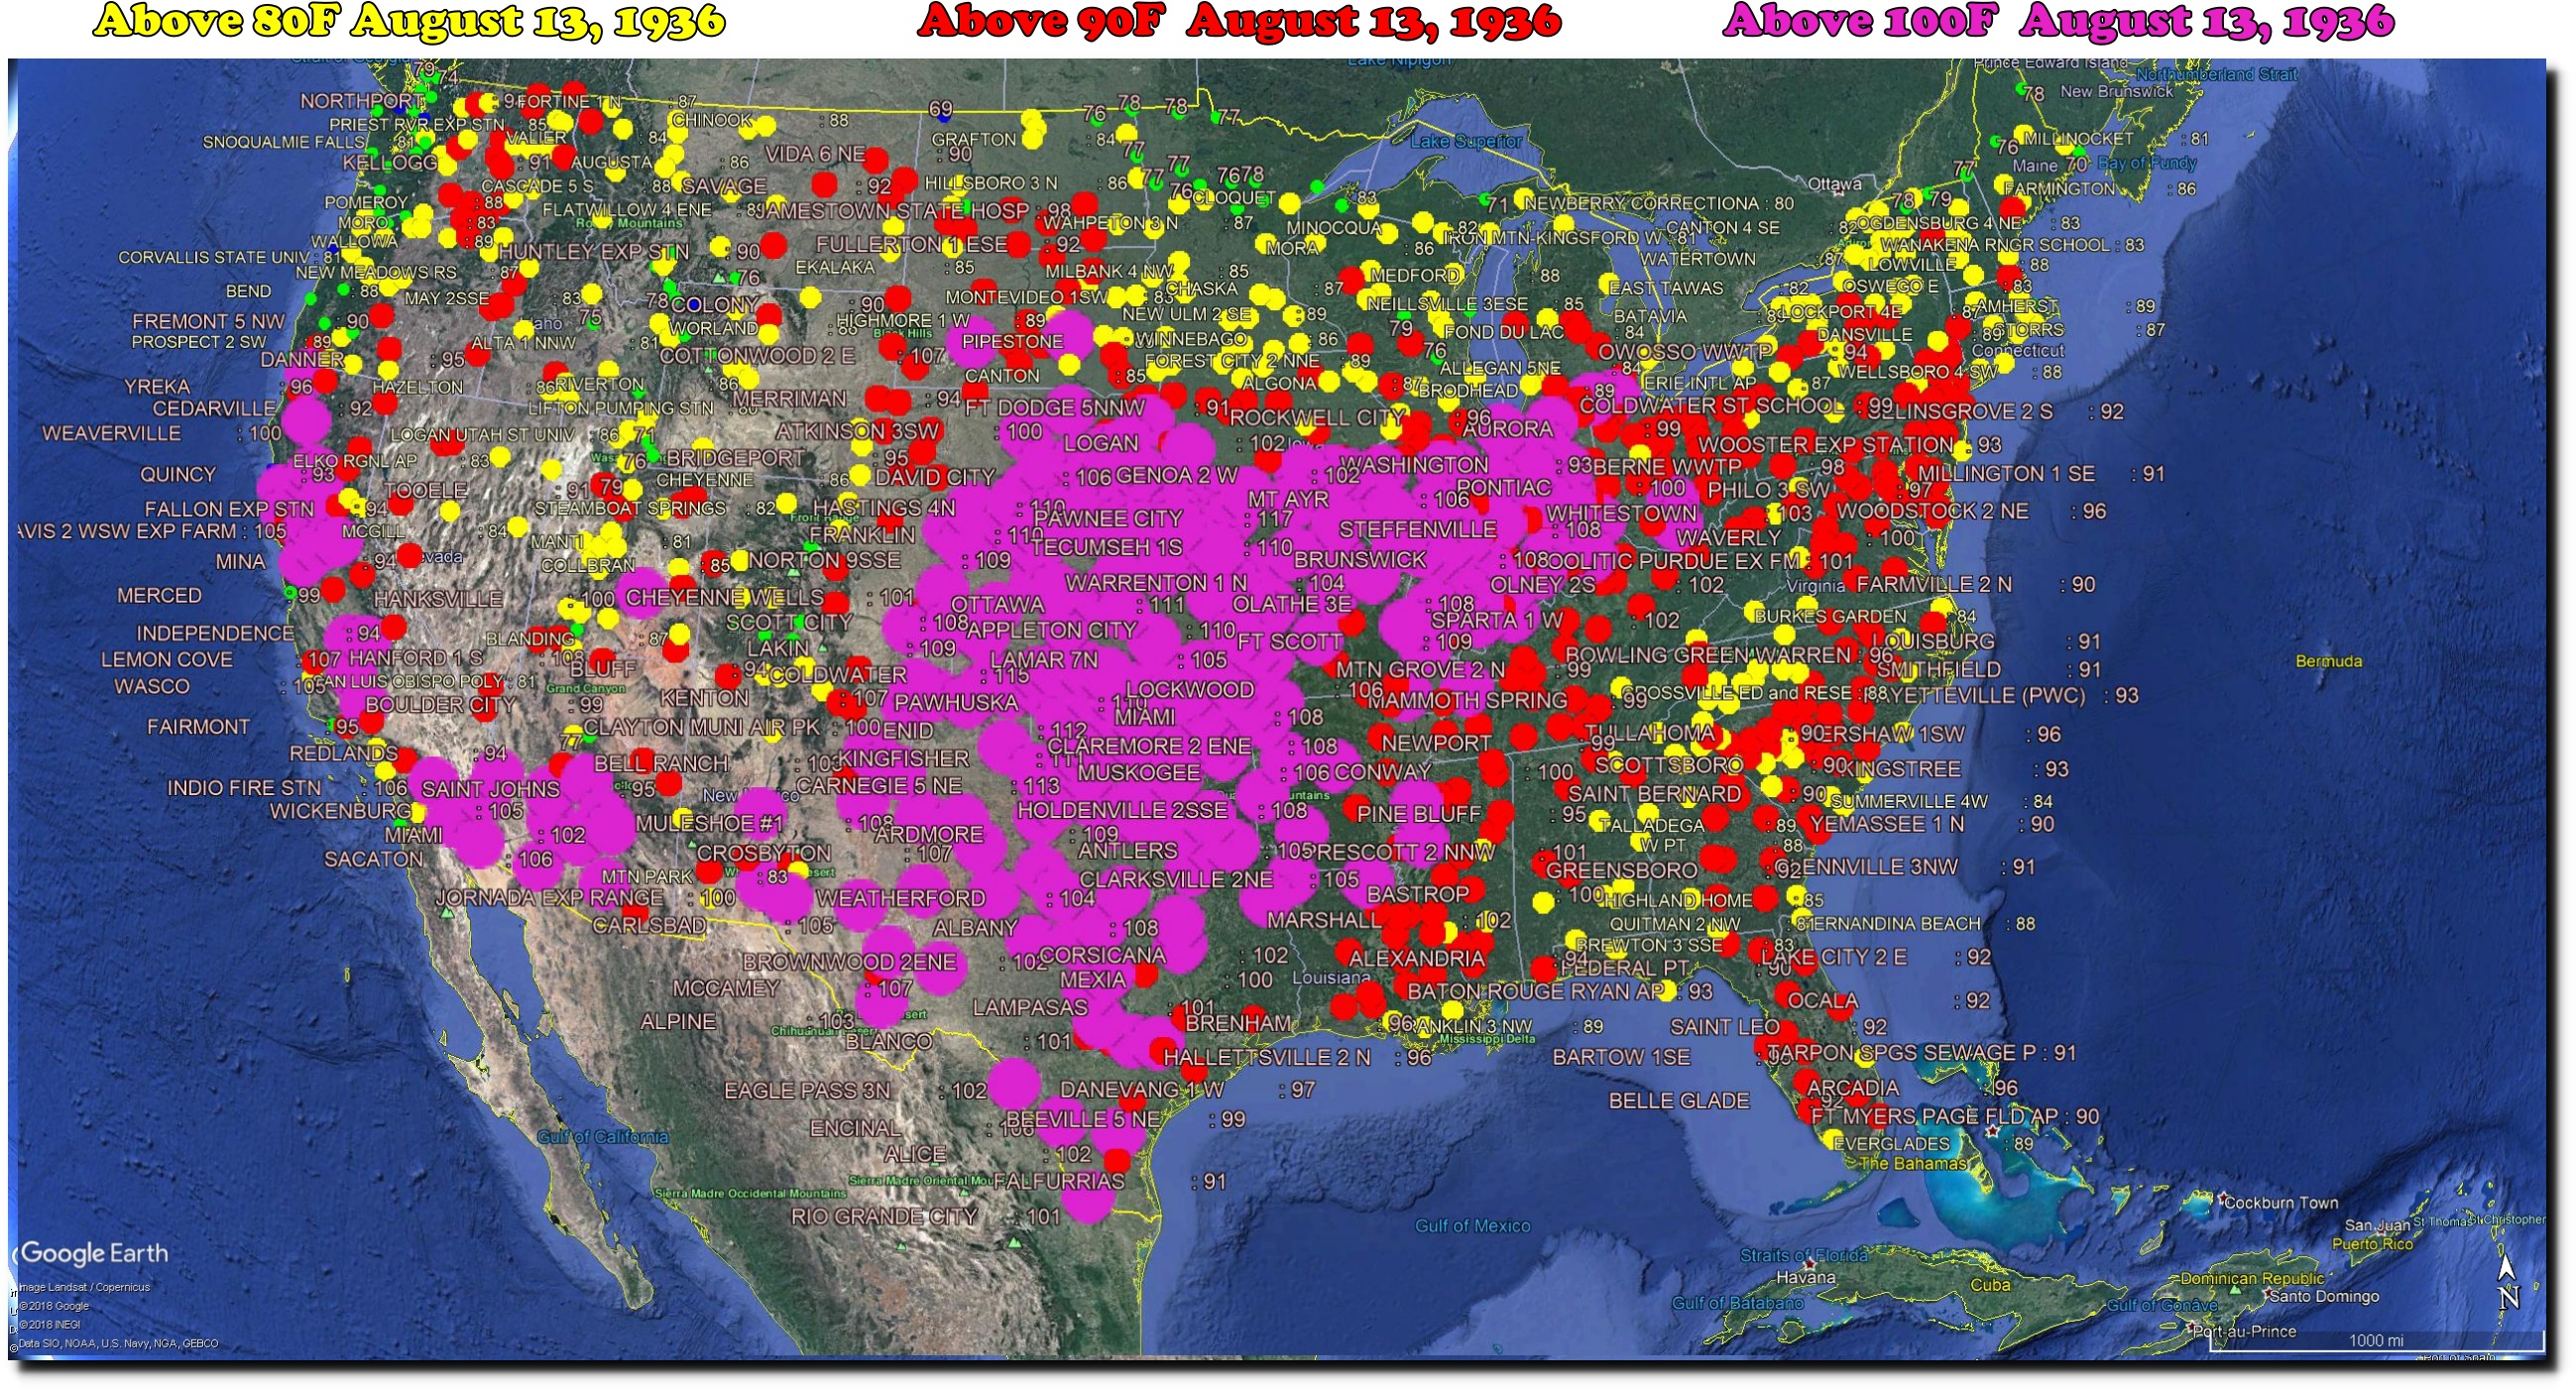
On this date in 1936 (with CO2 at 310 PPM) it was 119 degrees in Kansas and 117 degrees in Nebraska. Seven states were over 110 degrees, twenty were over 100 degrees, and all but three were over 90 degrees.
Imagine the mass hysteria if we had weather that hot now. Climate scientists would declare 100% certainty that this could not happen at lower CO2 levels.
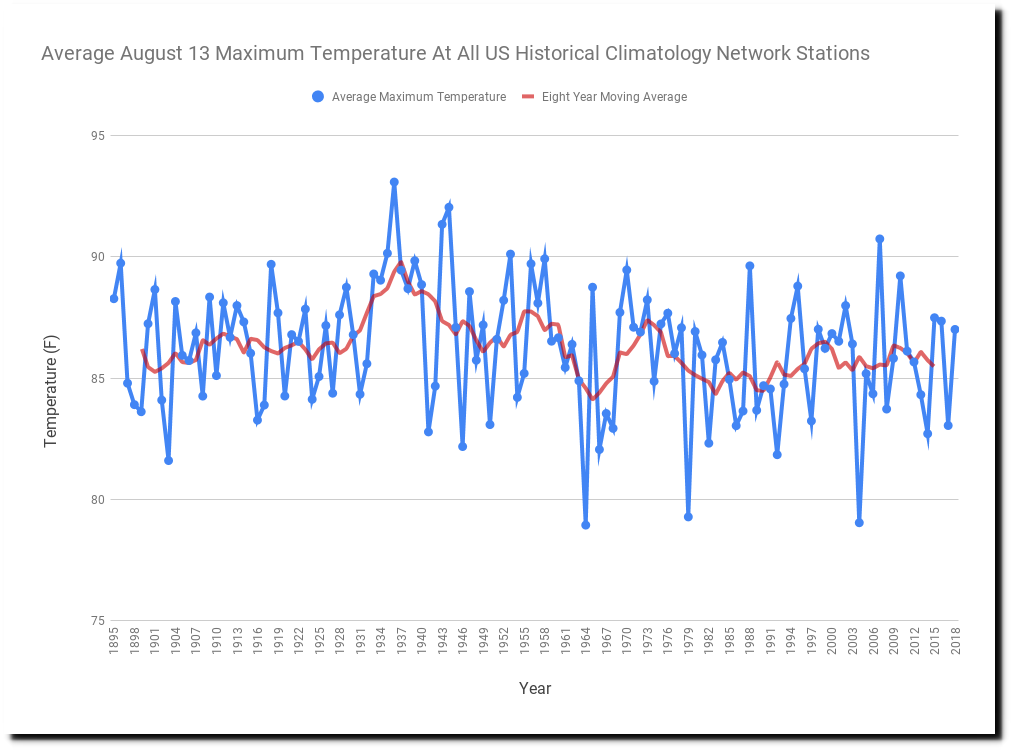
Average temperature around the US was 93 degrees. What I find remarkable in the graph below is how every year from 1933 to 1940 had extremely hot weather on this date.

State	        August 13, 1936 Highest Temperature (F)
Kansas	        119
California	118
Nebraska	117
Oklahoma	116
Arizona	        115
Texas	        114
Missouri	112
Iowa	        109
Arkansas	107
South Dakota	107
Illinois	106
Colorado	105
Indiana	        105
New Mexico	105
Louisiana	104
Kentucky	101
Mississippi	101
Ohio	        101
Michigan	100
Tennessee	100
Utah	        100
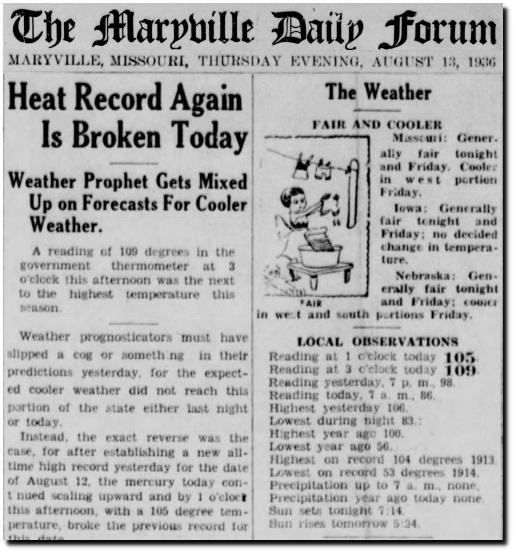
13 Aug 1936, Page 1 – The Maryville Daily Forum at Newspapers.com
Posted in Uncategorized
Leave a comment
Gun Control Works!
On November 8, 1938 German Socialists confiscated all of the Jews’ guns.
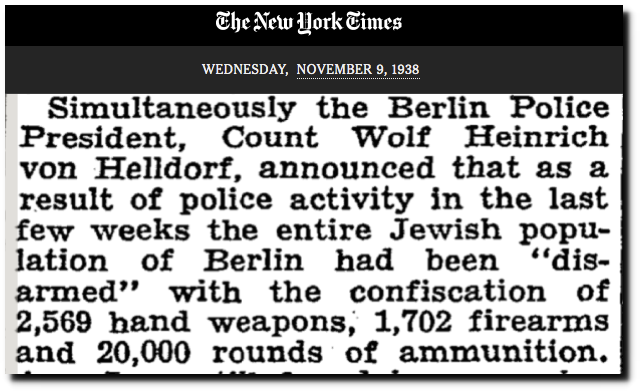
TimesMachine: November 9, 1938 – NYTimes.com
The Holocaust began the next day.

Posted in Uncategorized
Leave a comment
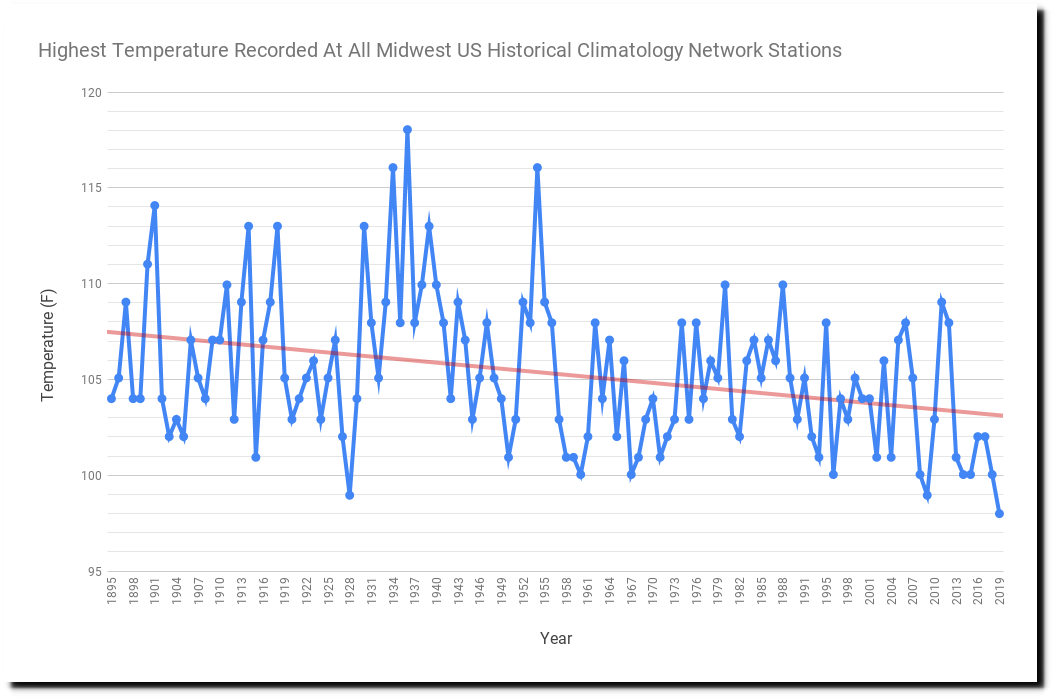
Peak Temperatures In The Midwest Down 20 Degrees
Peak temperatures in the Midwest have plummeted since the 19th century. This is the first year the Midwest did not make it up to 99 degrees, with a peak of 98 degrees on 7/21/2019 at station PALESTINE IL USC00116558. That is down 20 degrees from the peak in 1936.
Posted in Uncategorized
Leave a comment
Banned For Posting Temperature Data
As I predicted last week, I have been censored from the climate discussion for posting temperature data.

Posted in Uncategorized
Leave a comment
Toto’s Latest Software Release
I put together a new python script for analyzing US temperature data. The code is much smaller than what I have previously released, but it is just as powerful for the most commonly used statistics. It also includes analysis of the new USHCN daily TOBS data – which is a complete mess. I will be blogging about it shortly.
You can get the code here, There are only three files :
get, USHCNDaily.py and US.list
After you download the code :
chmod 755 get
./get
That will download the entire US daily temperature record from NOAA USHCN. Then execute the program with commands like :
python3 USHCNDaily.py US.list states=MNIAMOWIILINOHMI months=05060708 max_target=89
That will calculate the temperature record for the Midwest (Minnesota, Iowa, etc.) , from May to August, with a target of 89 degrees (F) for calculating statistics. After it has completed, you will find a descriptively named csv file in the same directory – which you can then load into a spreadsheet.
I’m not planning on doing any python tutorials, but the code is very simple and is going to make life tough for people tampering with data and lying about the climate. If you don’t know how to install and run python, look here.
Posted in Uncategorized
Leave a comment
Canada’s Finest Scientists At Work
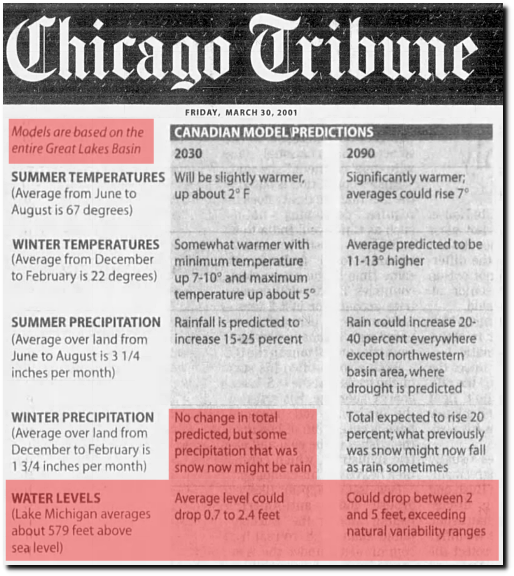
Canada’s top scientific minds have determined that all the cold, snow, rain and high water levels on the Great Lakes are due to global warming.
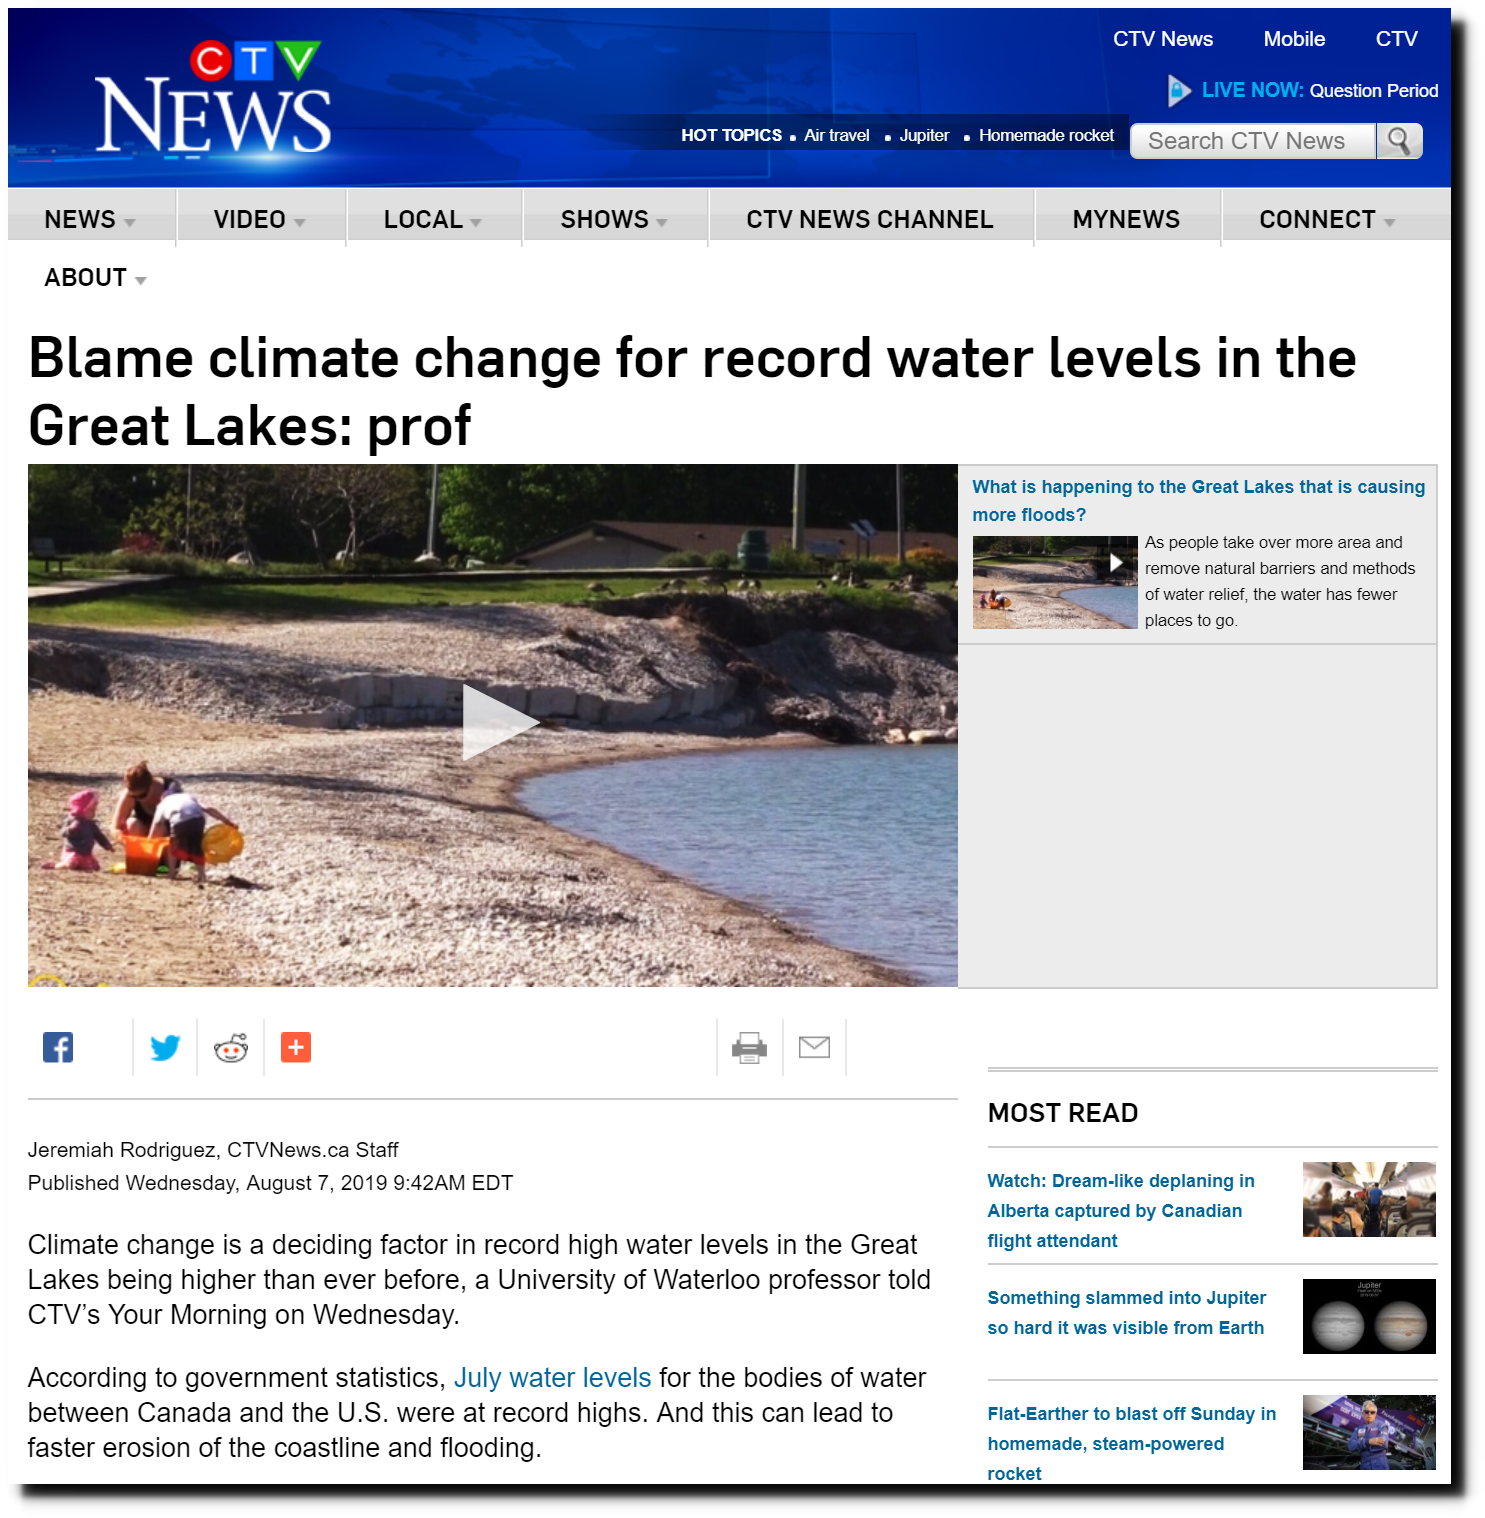
Blame climate change for record water levels in the Great Lakes: prof | CTV News
This comes almost twenty years after they predicted heat, drought, falling water levels and the demise of snow around the Great Lakes.
Posted in Uncategorized
Leave a comment
“Democracy Dies In Darkness”
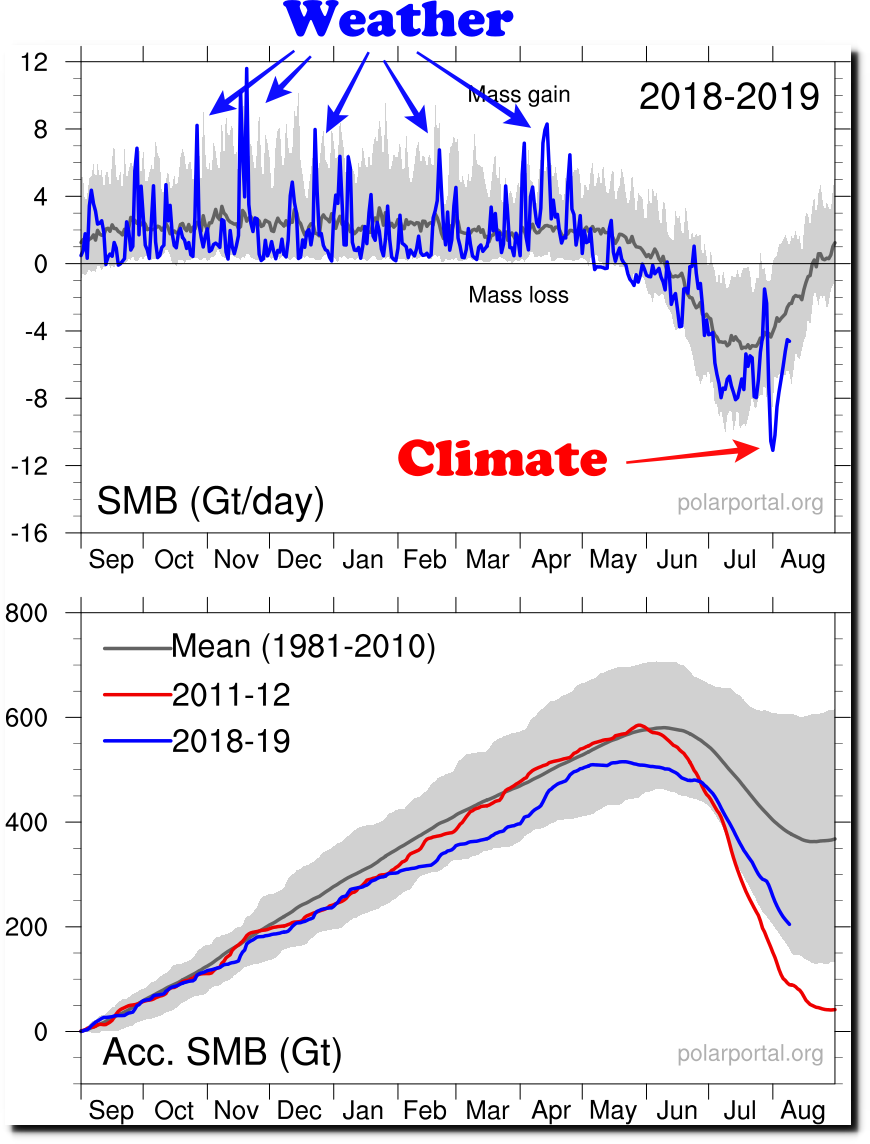
Climate experts have informed us that three days of warm weather in Greenland last month is climate.
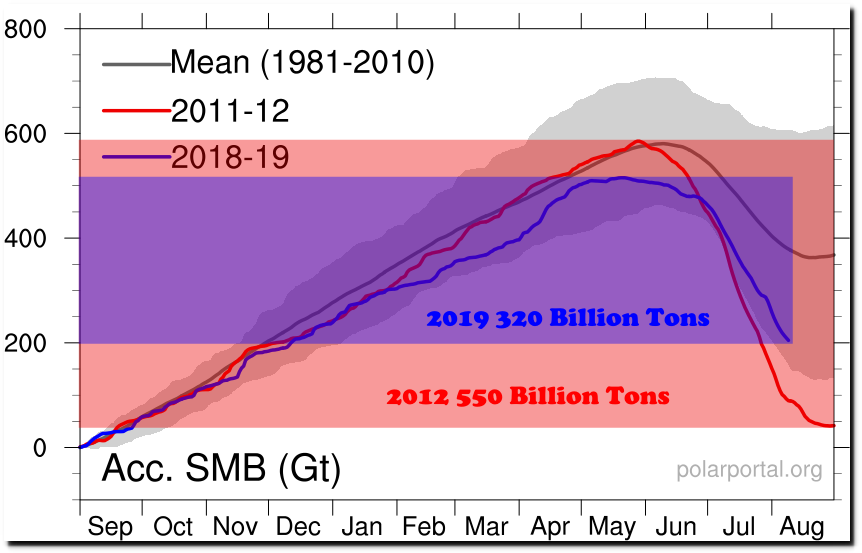
Surface Conditions: Polar Portal
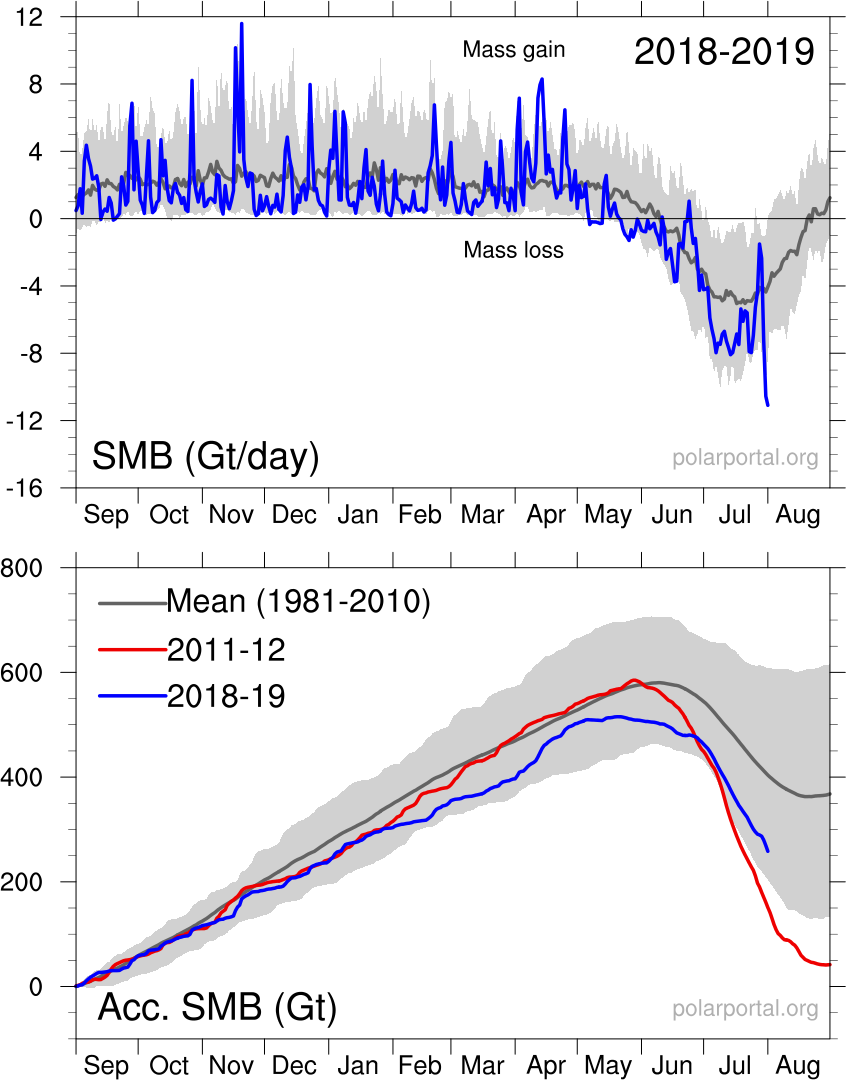
They have also determined that a 200 billion ton gain in ice since September is actually a loss, and that about half as much melt as 2012 is the largest on record.
Greenland’s surface has gained 1,250 billion tons of ice over the past three years, about 250 billion tons above the 1981-2010 mean. How surprising that the world’s leading papers failed to mention this. “Democracy Dies in Darkness”
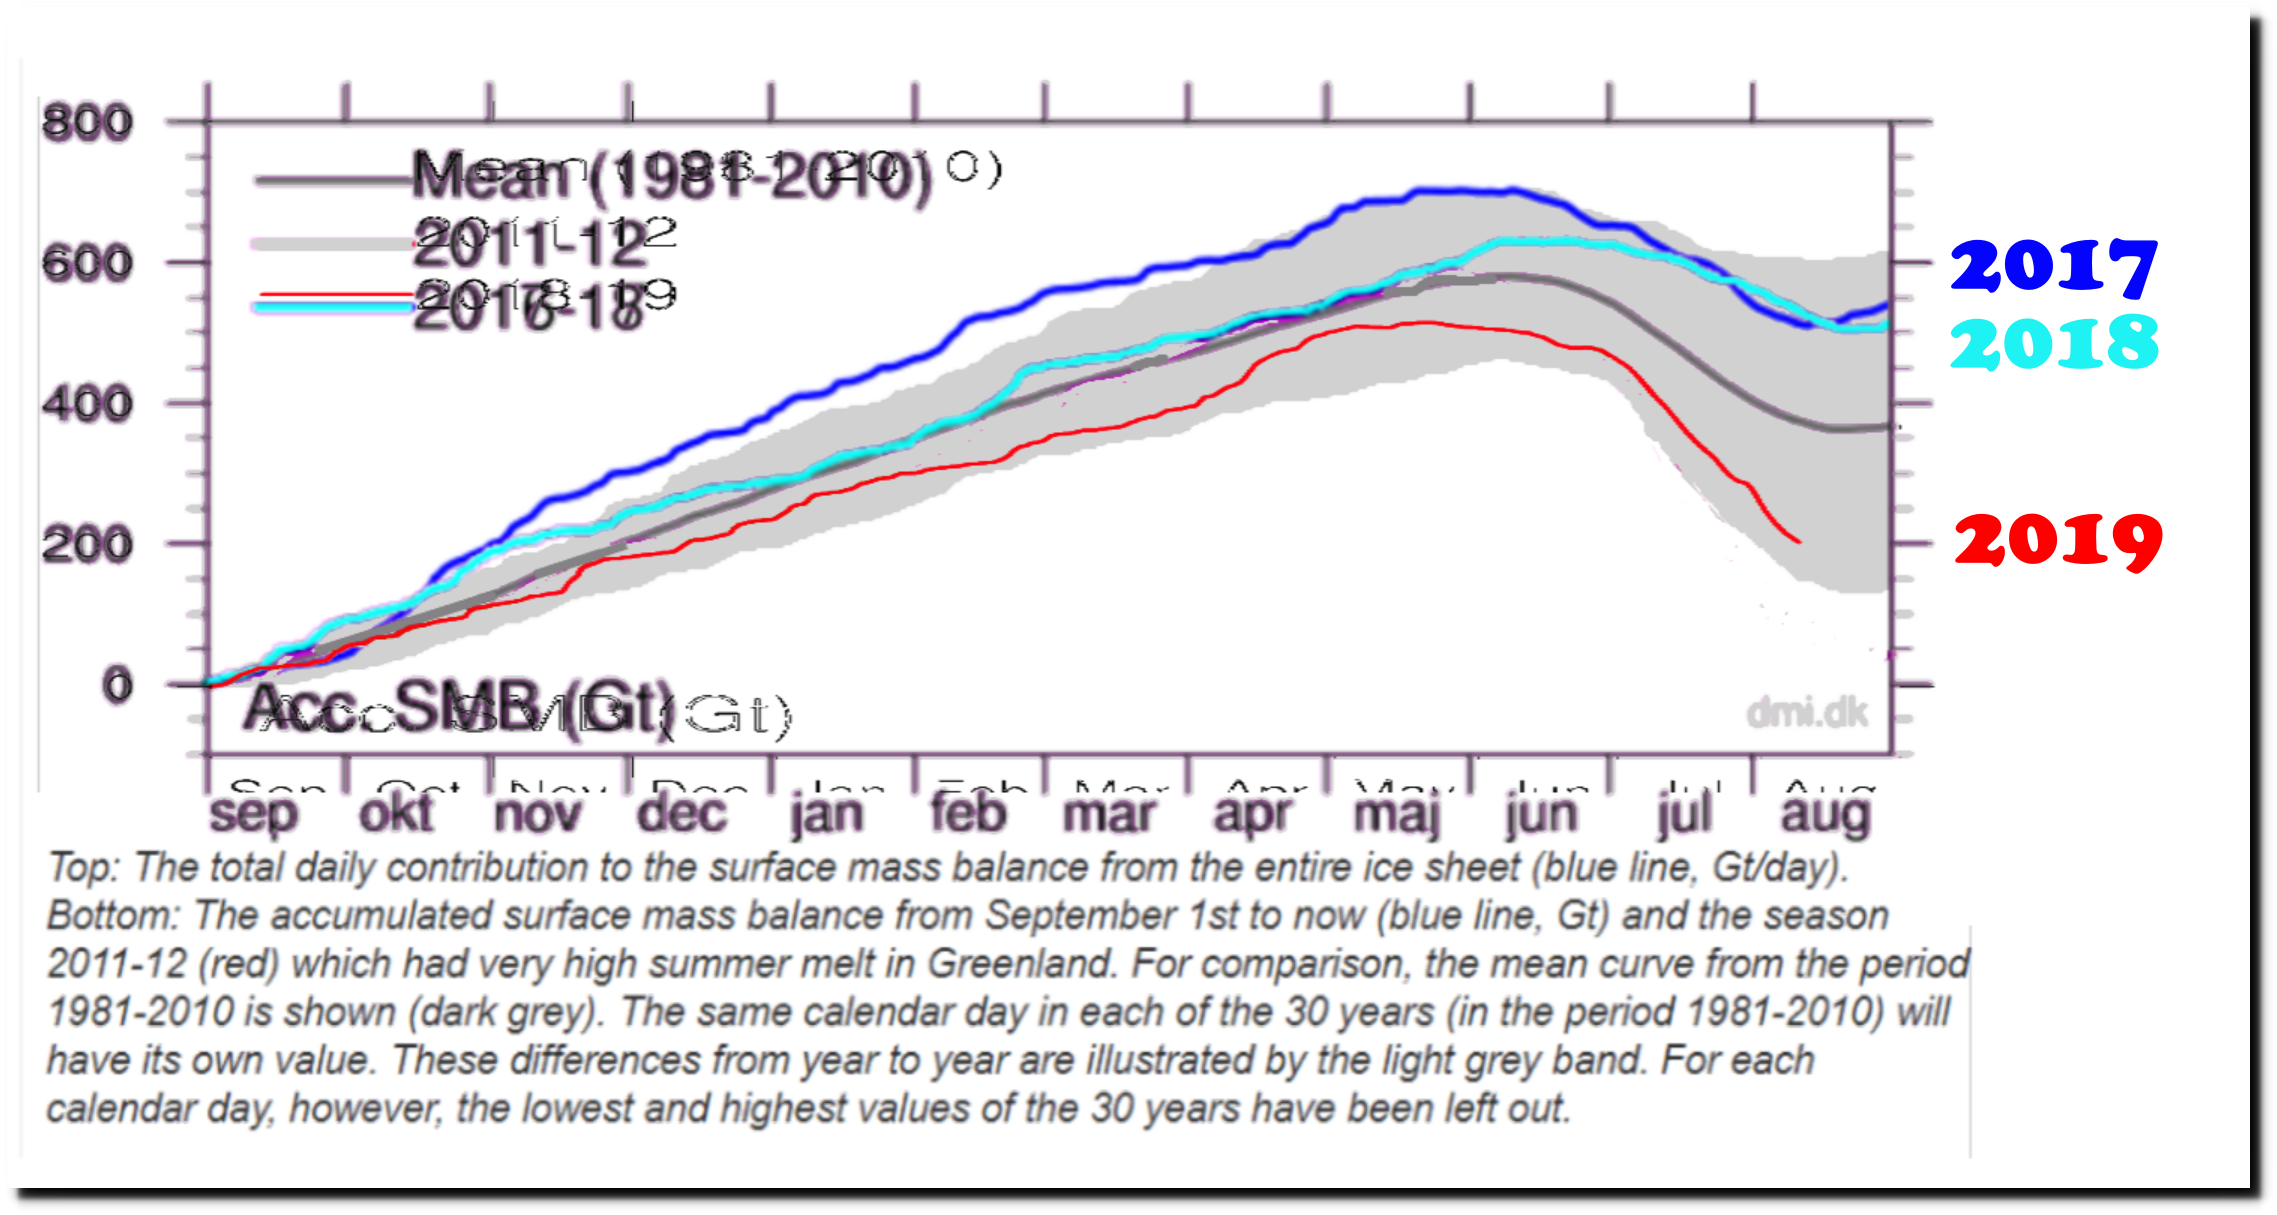
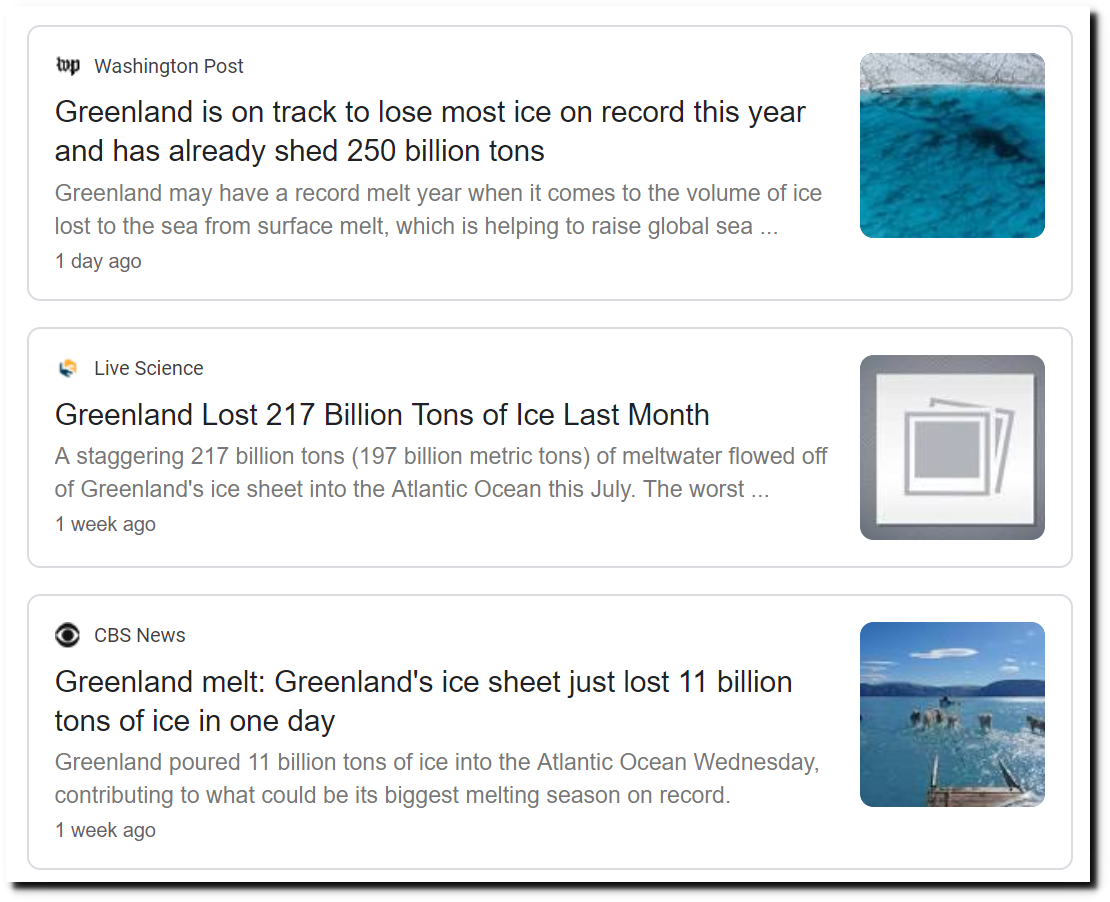
Melt this year has been just over half of 2012. The Washington Post says this year is on track to be the largest on record.
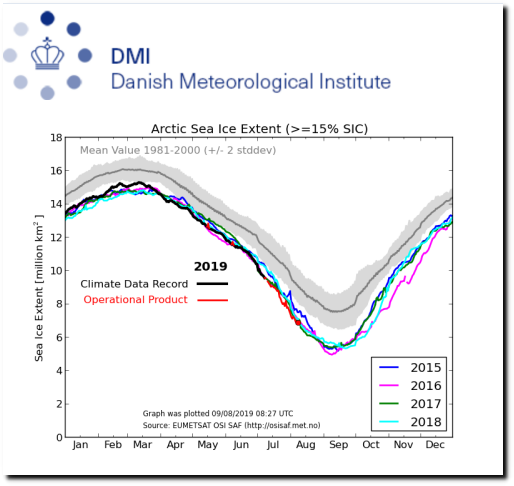
The Washington Post also says Arctic sea ice is at a record low.
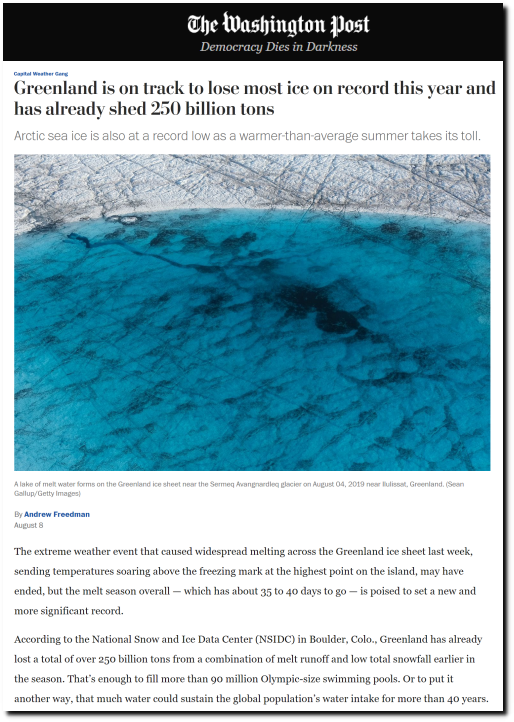
Greenland could set a record for the most ice lost in a single melt season – The Washington Post
Arctic sea ice is nowhere near a record low, and is melting slowly. This summer is likely to finish highest in the past five years.

Posted in Uncategorized
Leave a comment