
Disrupting the Borg is expensive and time consuming!

Google Search
-
Recent Posts
- One Atomic Bomb Per Hour
- New Video : Analyzing Oil And Gas
- Is Antarctica Melting?
- High Speed Analysis And Visualization
- El Nino To The Rescue?
- Fake News Update
- Growth Of Antarctic Sea Ice
- 65 Years Of Progress!
- El Nino To The Rescue?
- Worst March Drought On Record
- ChartGL Process Control Demo
- The Biggest Money Laundering Scam
- Drought In The Headwaters Of Lake Powell
- Unrealistic Expectations Of Water Availability
- Did Bill Gates Do This?
- Worst March Drought On Record In The US
- The Real Hockey Stick Graph
- Analyzing The Western Water Crisis
- Gaslighting 1924
- “Why Do You Resist?”
- Climate Attribution Model
- Fact Checking NASA
- Fact Checking Grok
- Fact Checking The New York Times
- New Visitech Features
Recent Comments
- Gordon Vigurs on One Atomic Bomb Per Hour
- Gordon Vigurs on One Atomic Bomb Per Hour
- Gordon Vigurs on One Atomic Bomb Per Hour
- Bob G on One Atomic Bomb Per Hour
- Robertvd on One Atomic Bomb Per Hour
- czechlist on One Atomic Bomb Per Hour
- conrad ziefle on One Atomic Bomb Per Hour
- conrad ziefle on One Atomic Bomb Per Hour
- D. Boss on One Atomic Bomb Per Hour
- D. Boss on One Atomic Bomb Per Hour
New Video : 1918 – When People Didn’t Have To Manufacture Crises
Posted in Uncategorized
Leave a comment
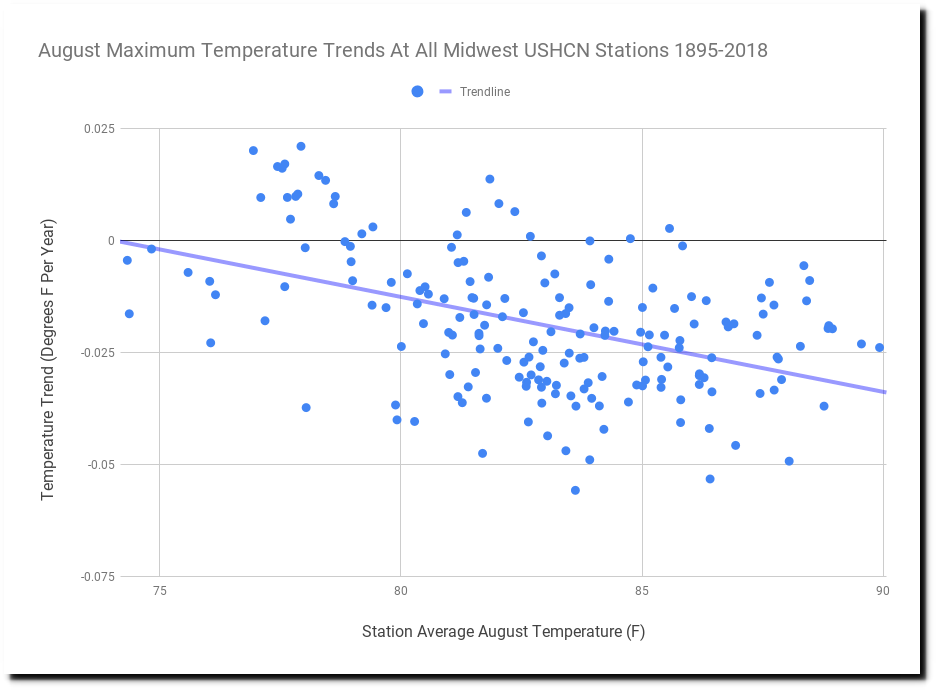
84% Of Midwest Stations Cooling During Summer
The graph below plots all 1,999,843 summer maximum temperature readings at all 191 Midwest USHCN stations since 1895, with trend lines.
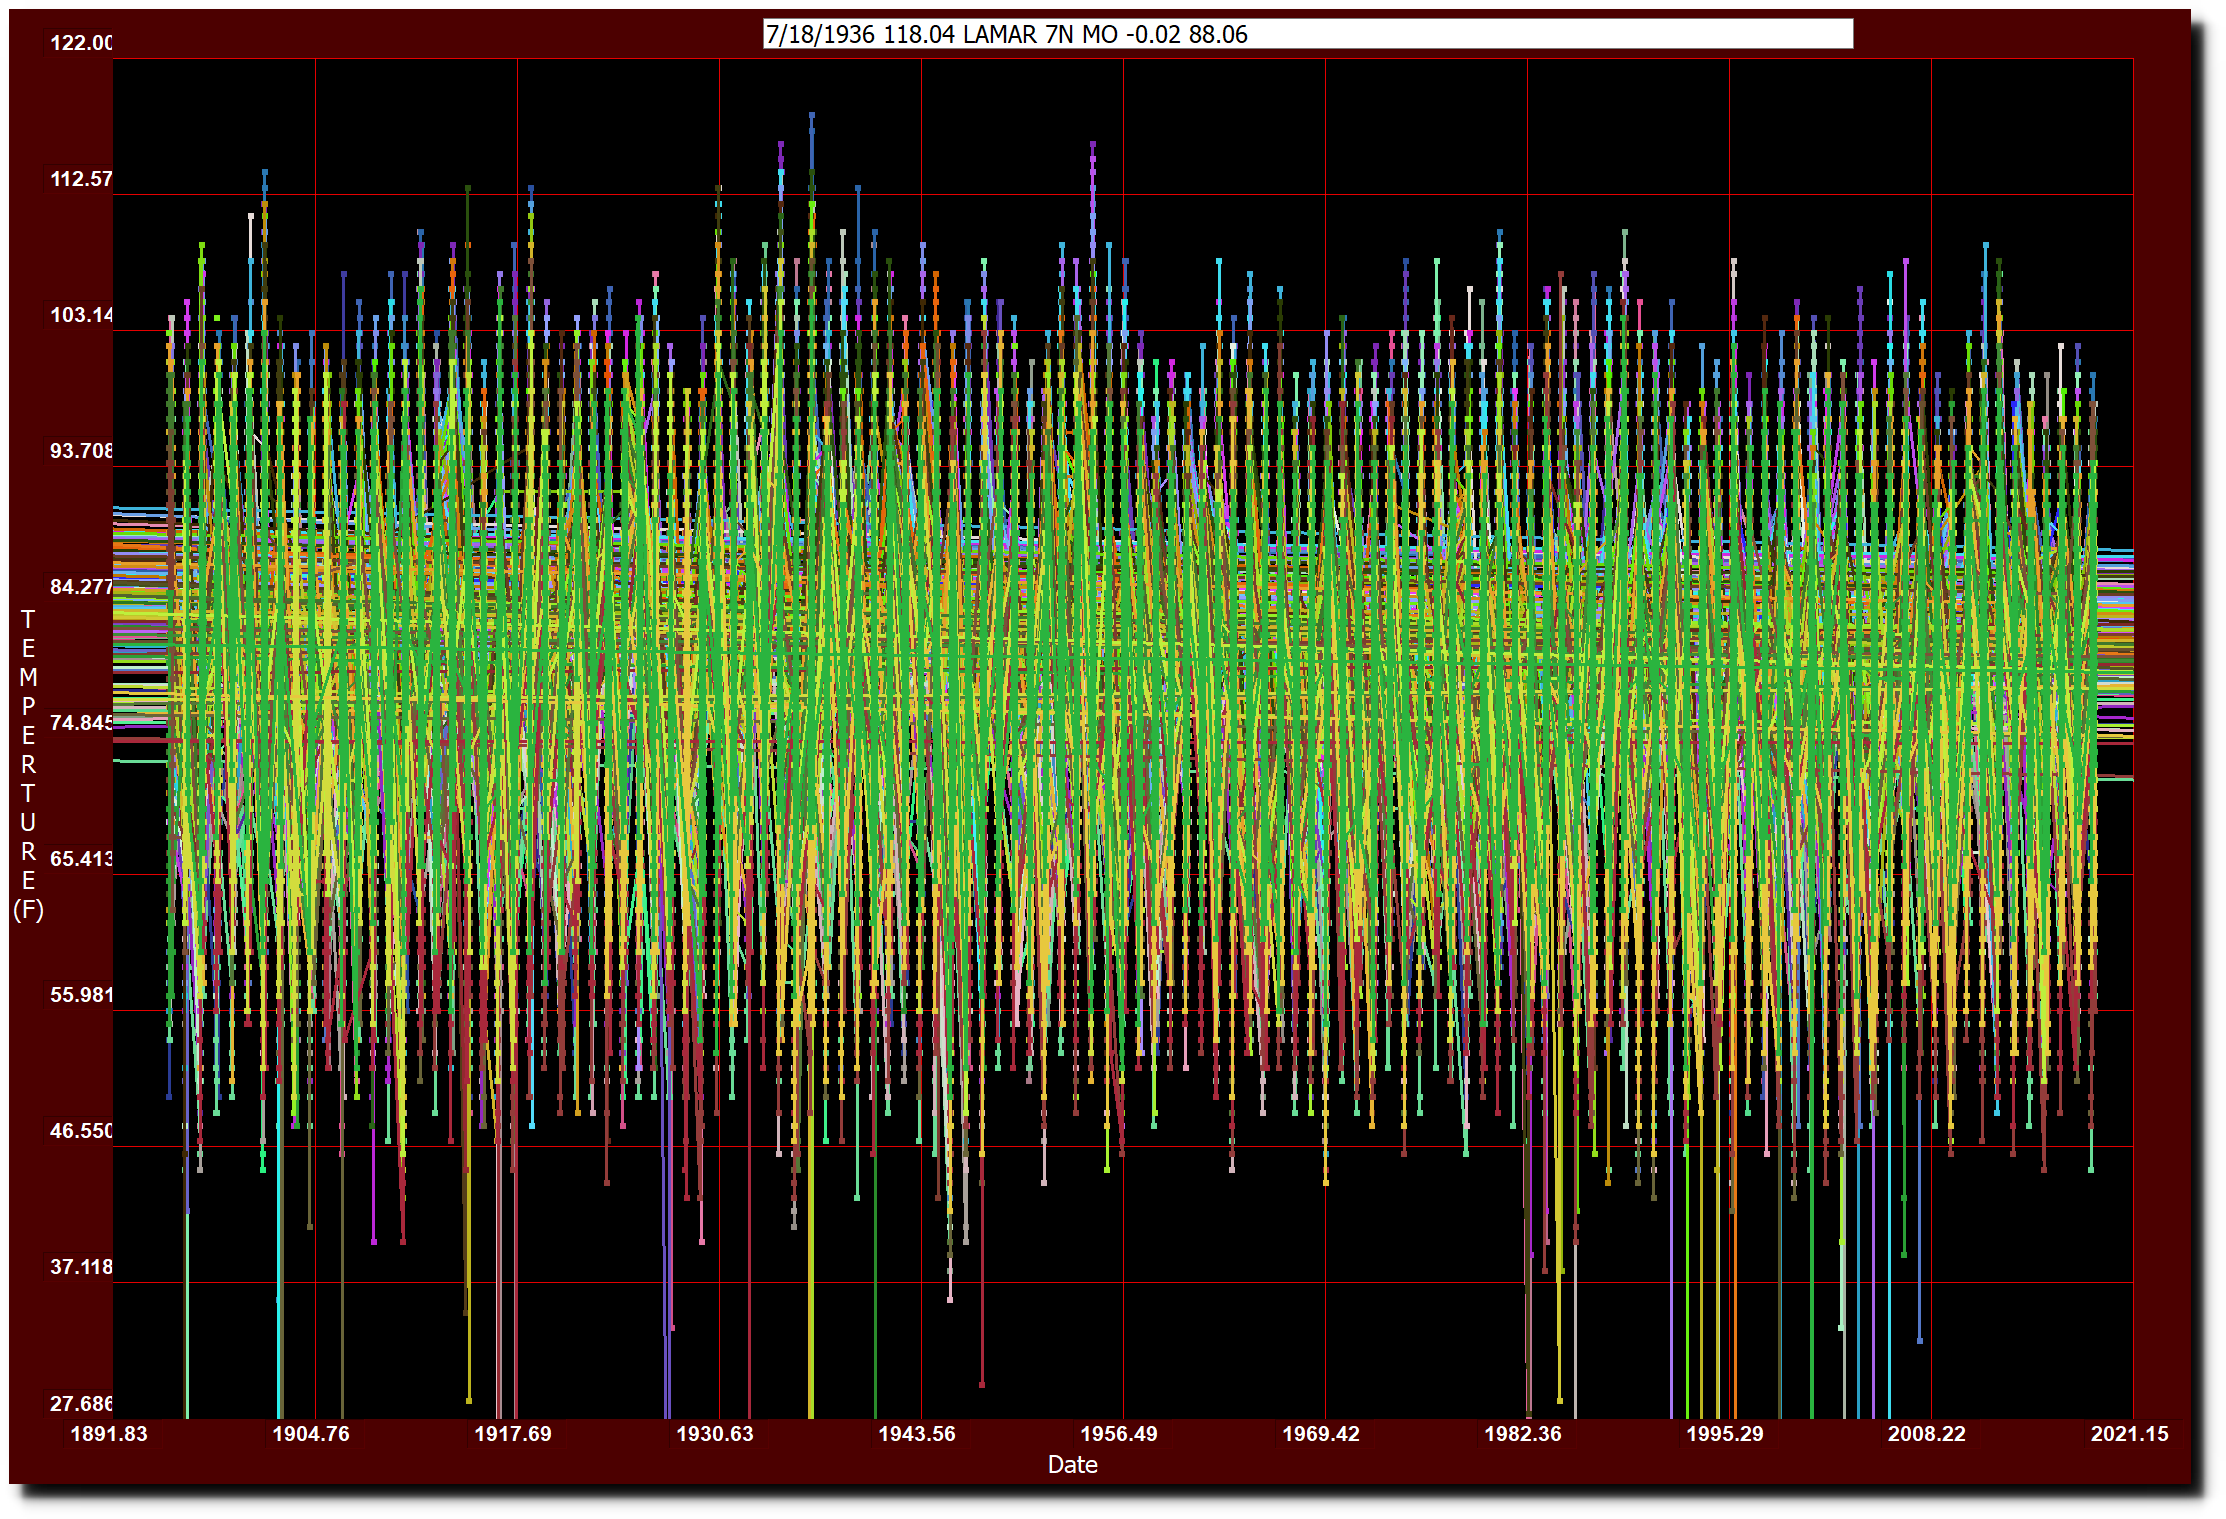
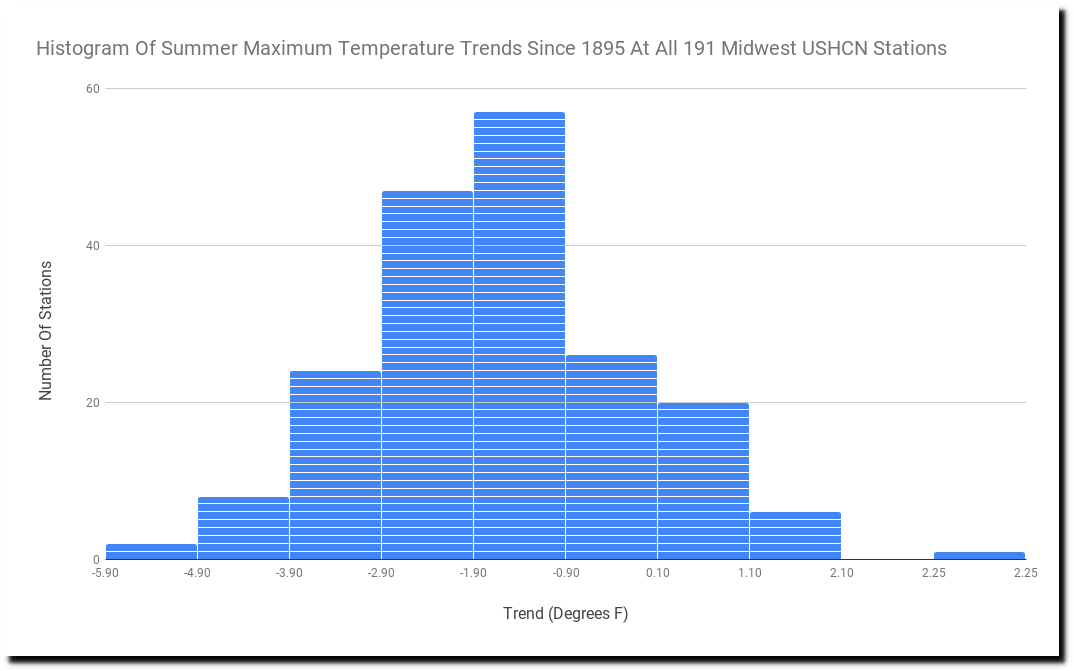
Eighty-four percent of the stations are cooling. Ohio and Indiana are cooling the fastest.
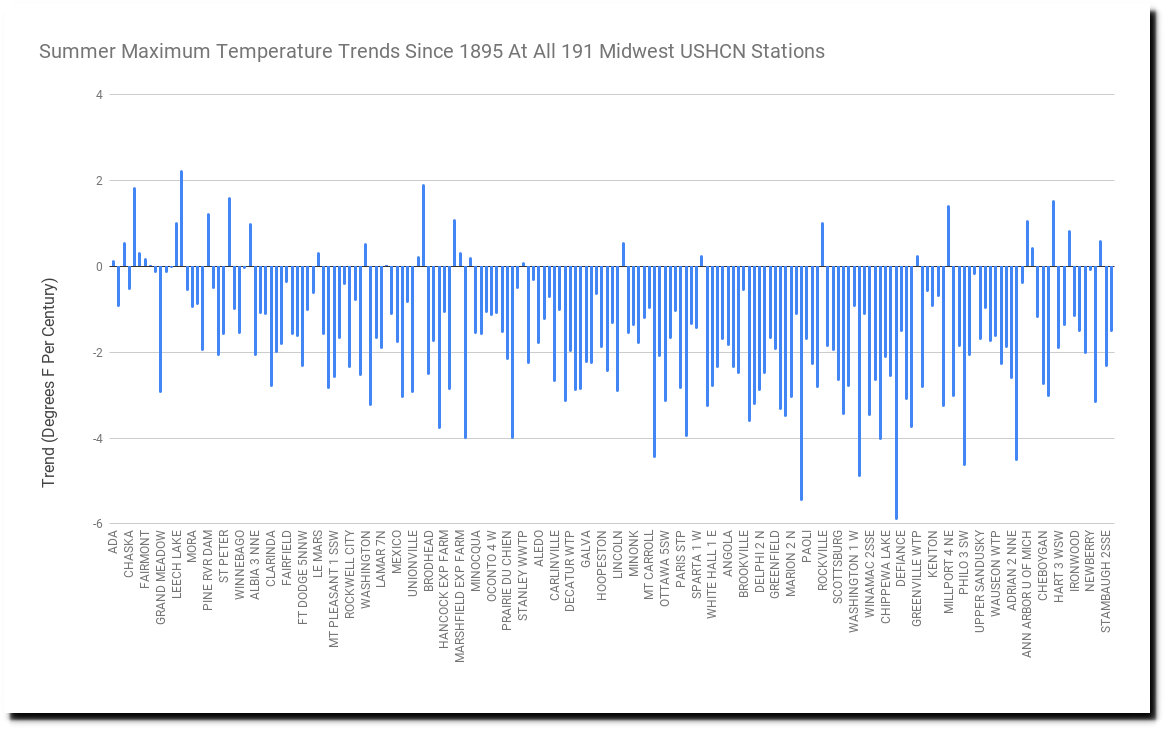
The center of the histogram is around a cooling rate of 1.9 degrees F per century.
Warmer stations are cooling faster than cooler stations.
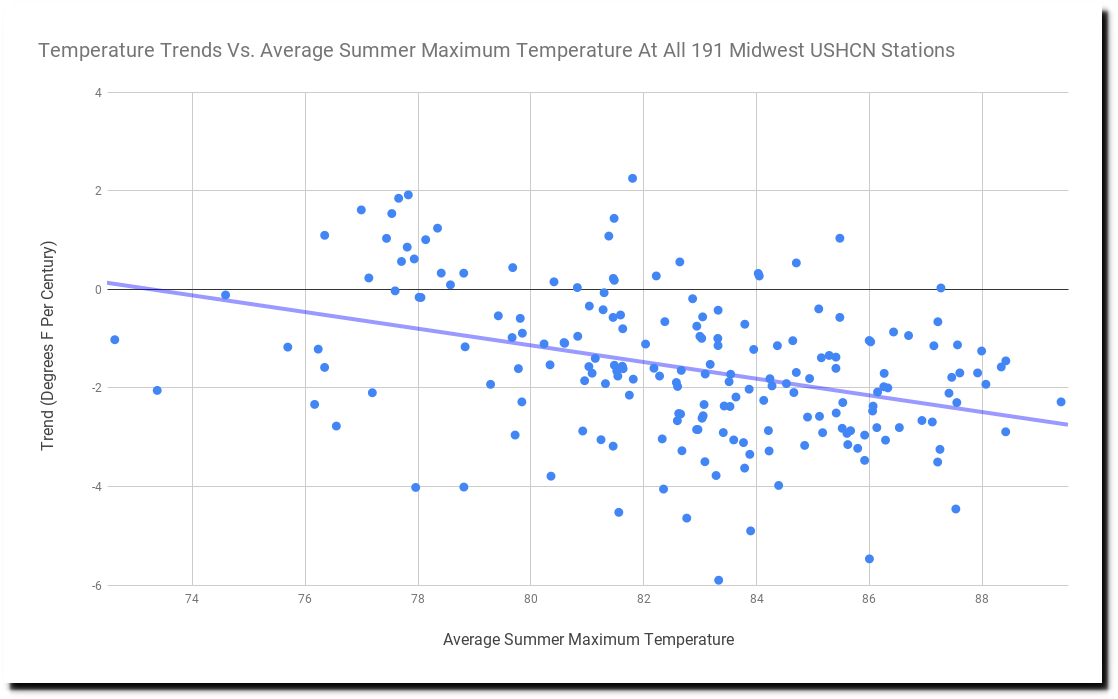
The warmest stations are in Illinois, Indiana and Missouri, and they are all cooling rapidly.
State	Station	        Average	 Trend (degrees F/century)
IL	HARRISBURG	89.3976	-2.28345
IL	SPARTA 1 W	88.4185	-1.45161
IL	DU QUOIN 4 SE	88.416	-2.89015
IL	MCLEANSBORO	88.3372	-1.57476
MO	LAMAR 7N	88.0649	-1.92598
IL	ANNA 2 NNE	87.9895	-1.25118
MO	JEFFERSON CITY  87.9181	-1.69554
IL	PALESTINE	87.6027	-1.6959
MO	LEXINGTON 3E	87.5619	-1.12669
IN	PRINCETON 1 W	87.5496	-2.29688
IL	MT VERNON 3 NE	87.5322	-4.45588
MO	MEXICO	        87.4598	-1.78494
Meanwhile, the criminals at the Union of Concerned Scientists have raised millions of dollars by lying about this.
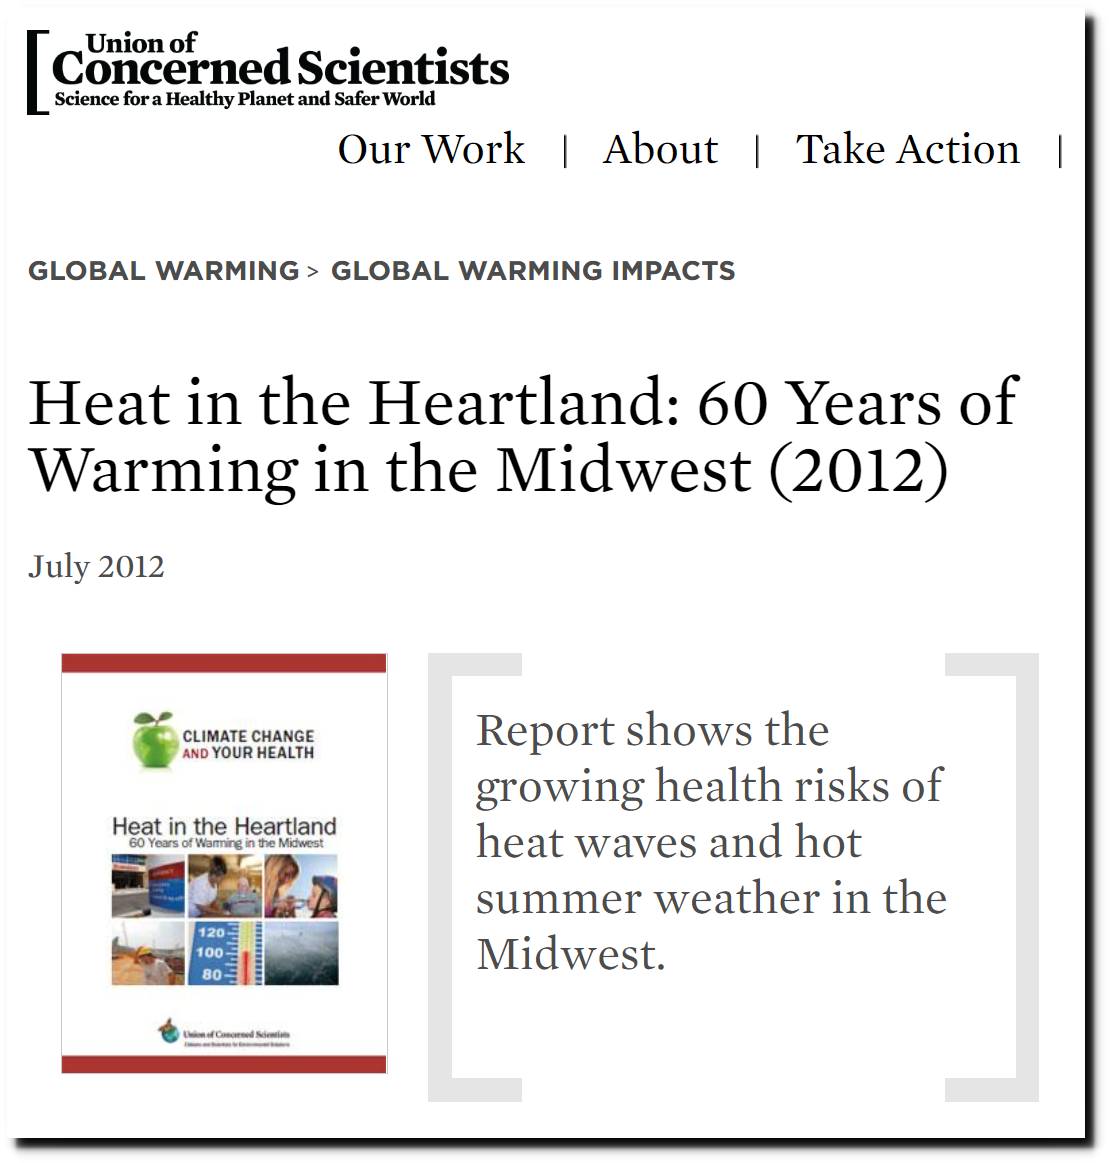
Heat in the Heartland: 60 Years of Warming in the Midwest (2012) | Union of Concerned Scientists
Posted in Uncategorized
Leave a comment
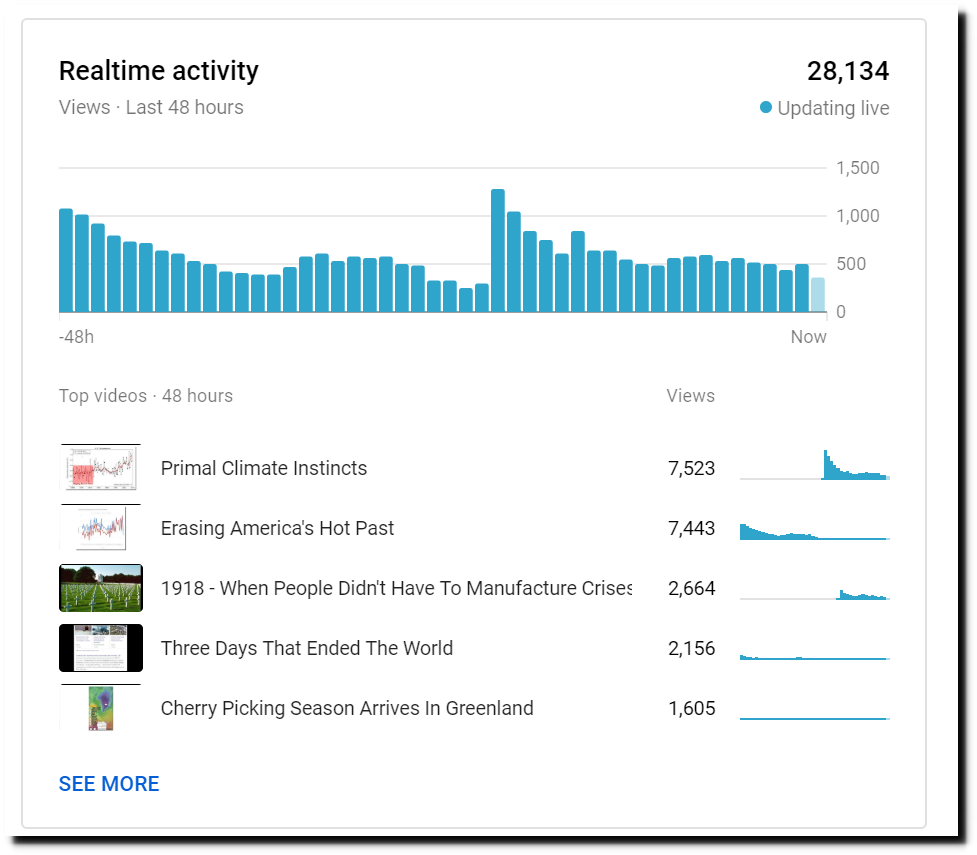
YouTube Suppressing My Stats Nearly 50%
These two videos have had at least 18,000 views – probably a lot more.
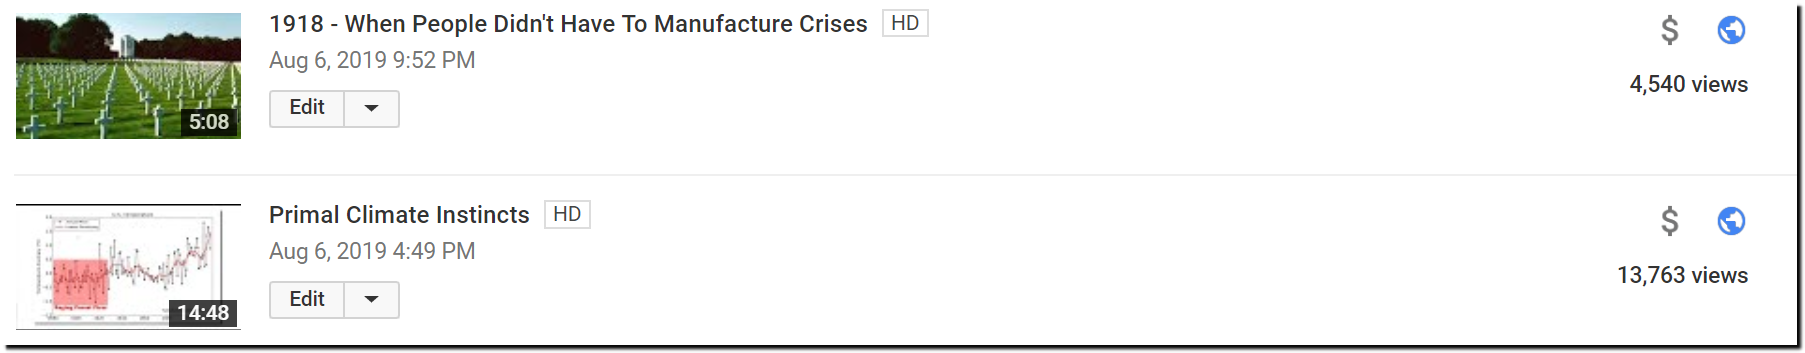
YouTube shows them just over 10,000 views in my analytics.
Posted in Uncategorized
Leave a comment
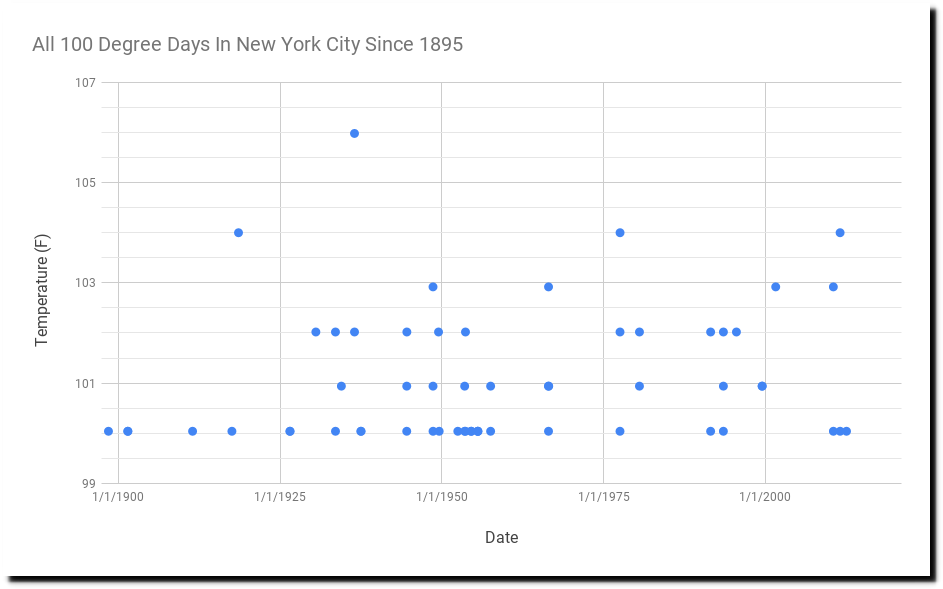
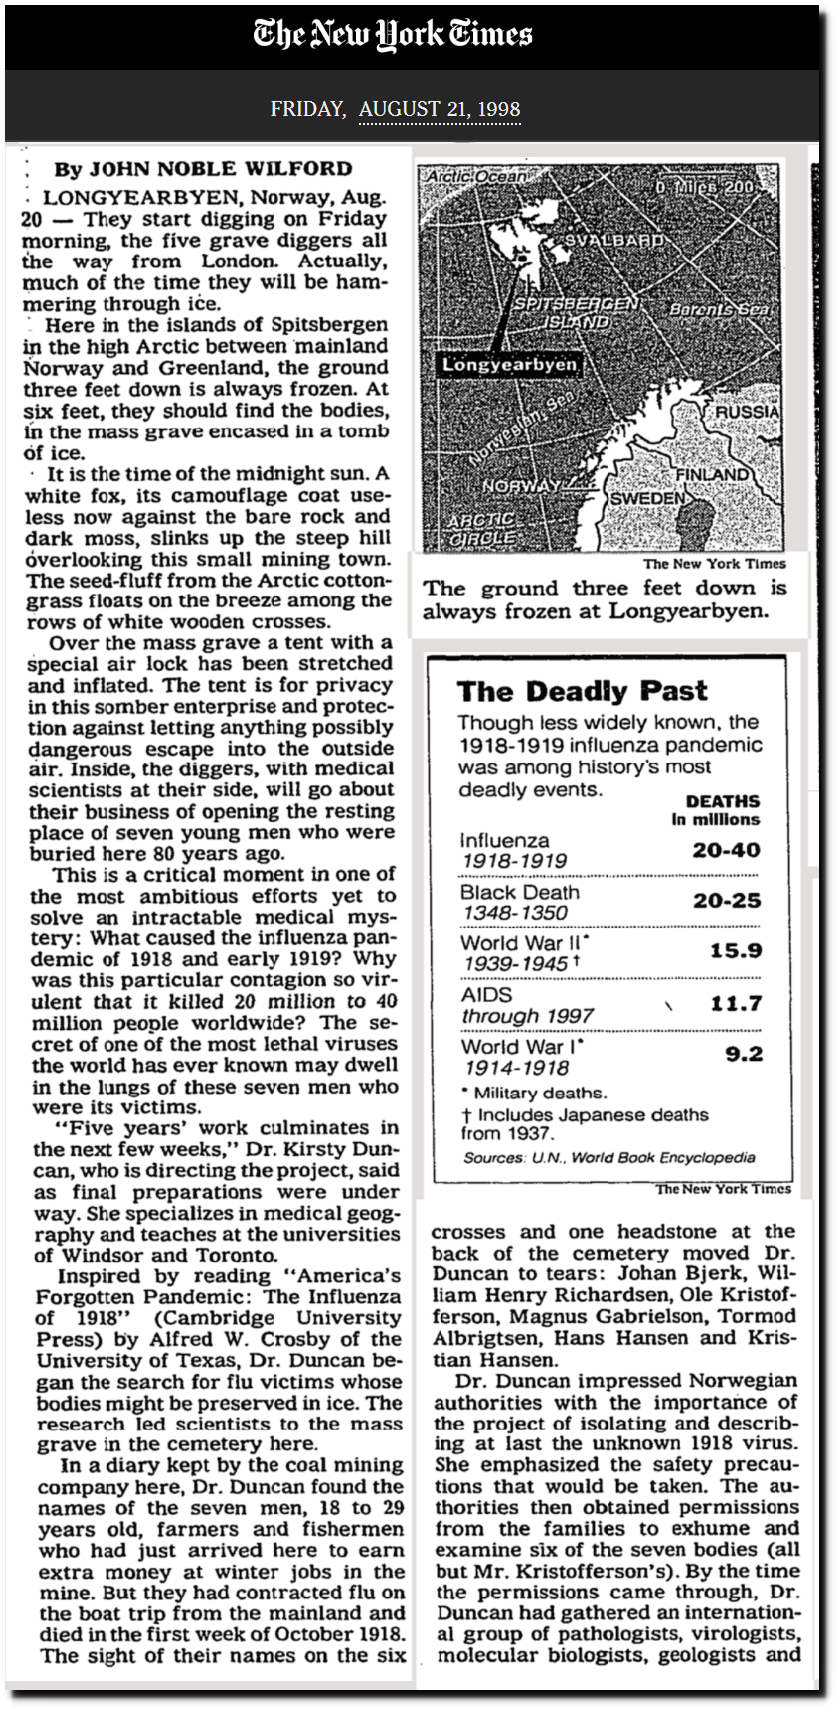
August 7, 1918 – Second Hottest Day On Record In New York
New York City has had 59 days over 100F (38C) since 1895. Three quarters of those days occurred with CO2 below 350 PPM. The hottest day was 106F on July 9, 1936. The second hottest was August 7, 1918 – which was tied on July 21, 1977 and July 22, 2011.
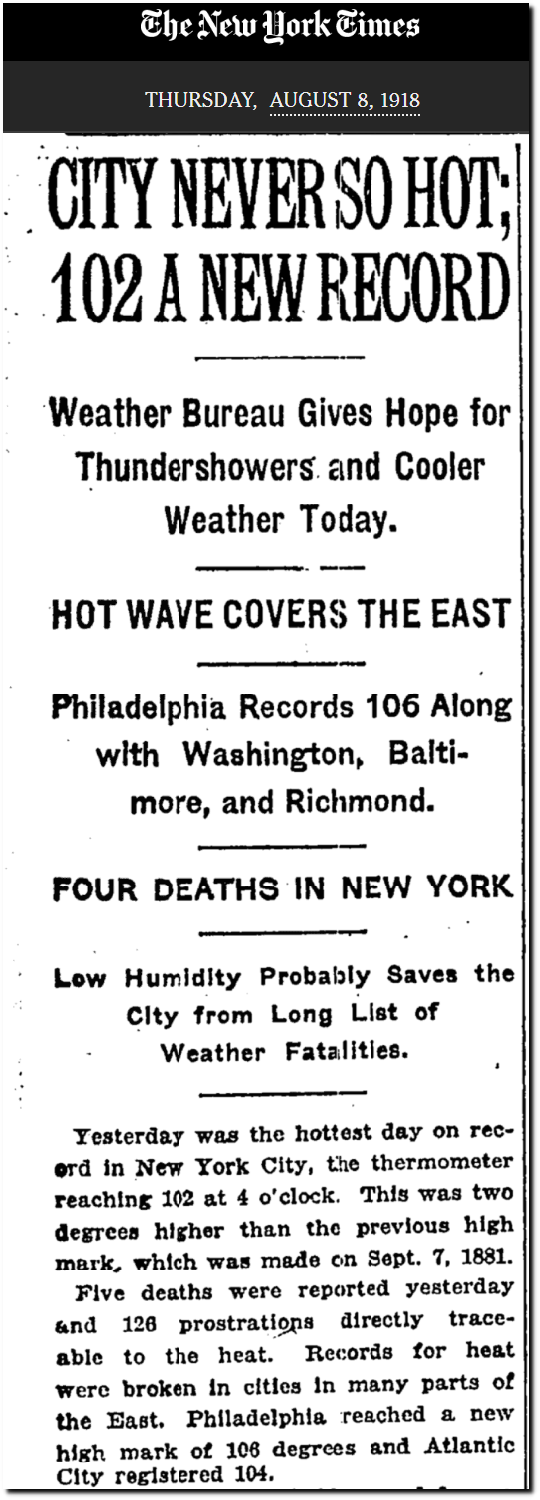
TimesMachine: August 8, 1918 – NYTimes.com
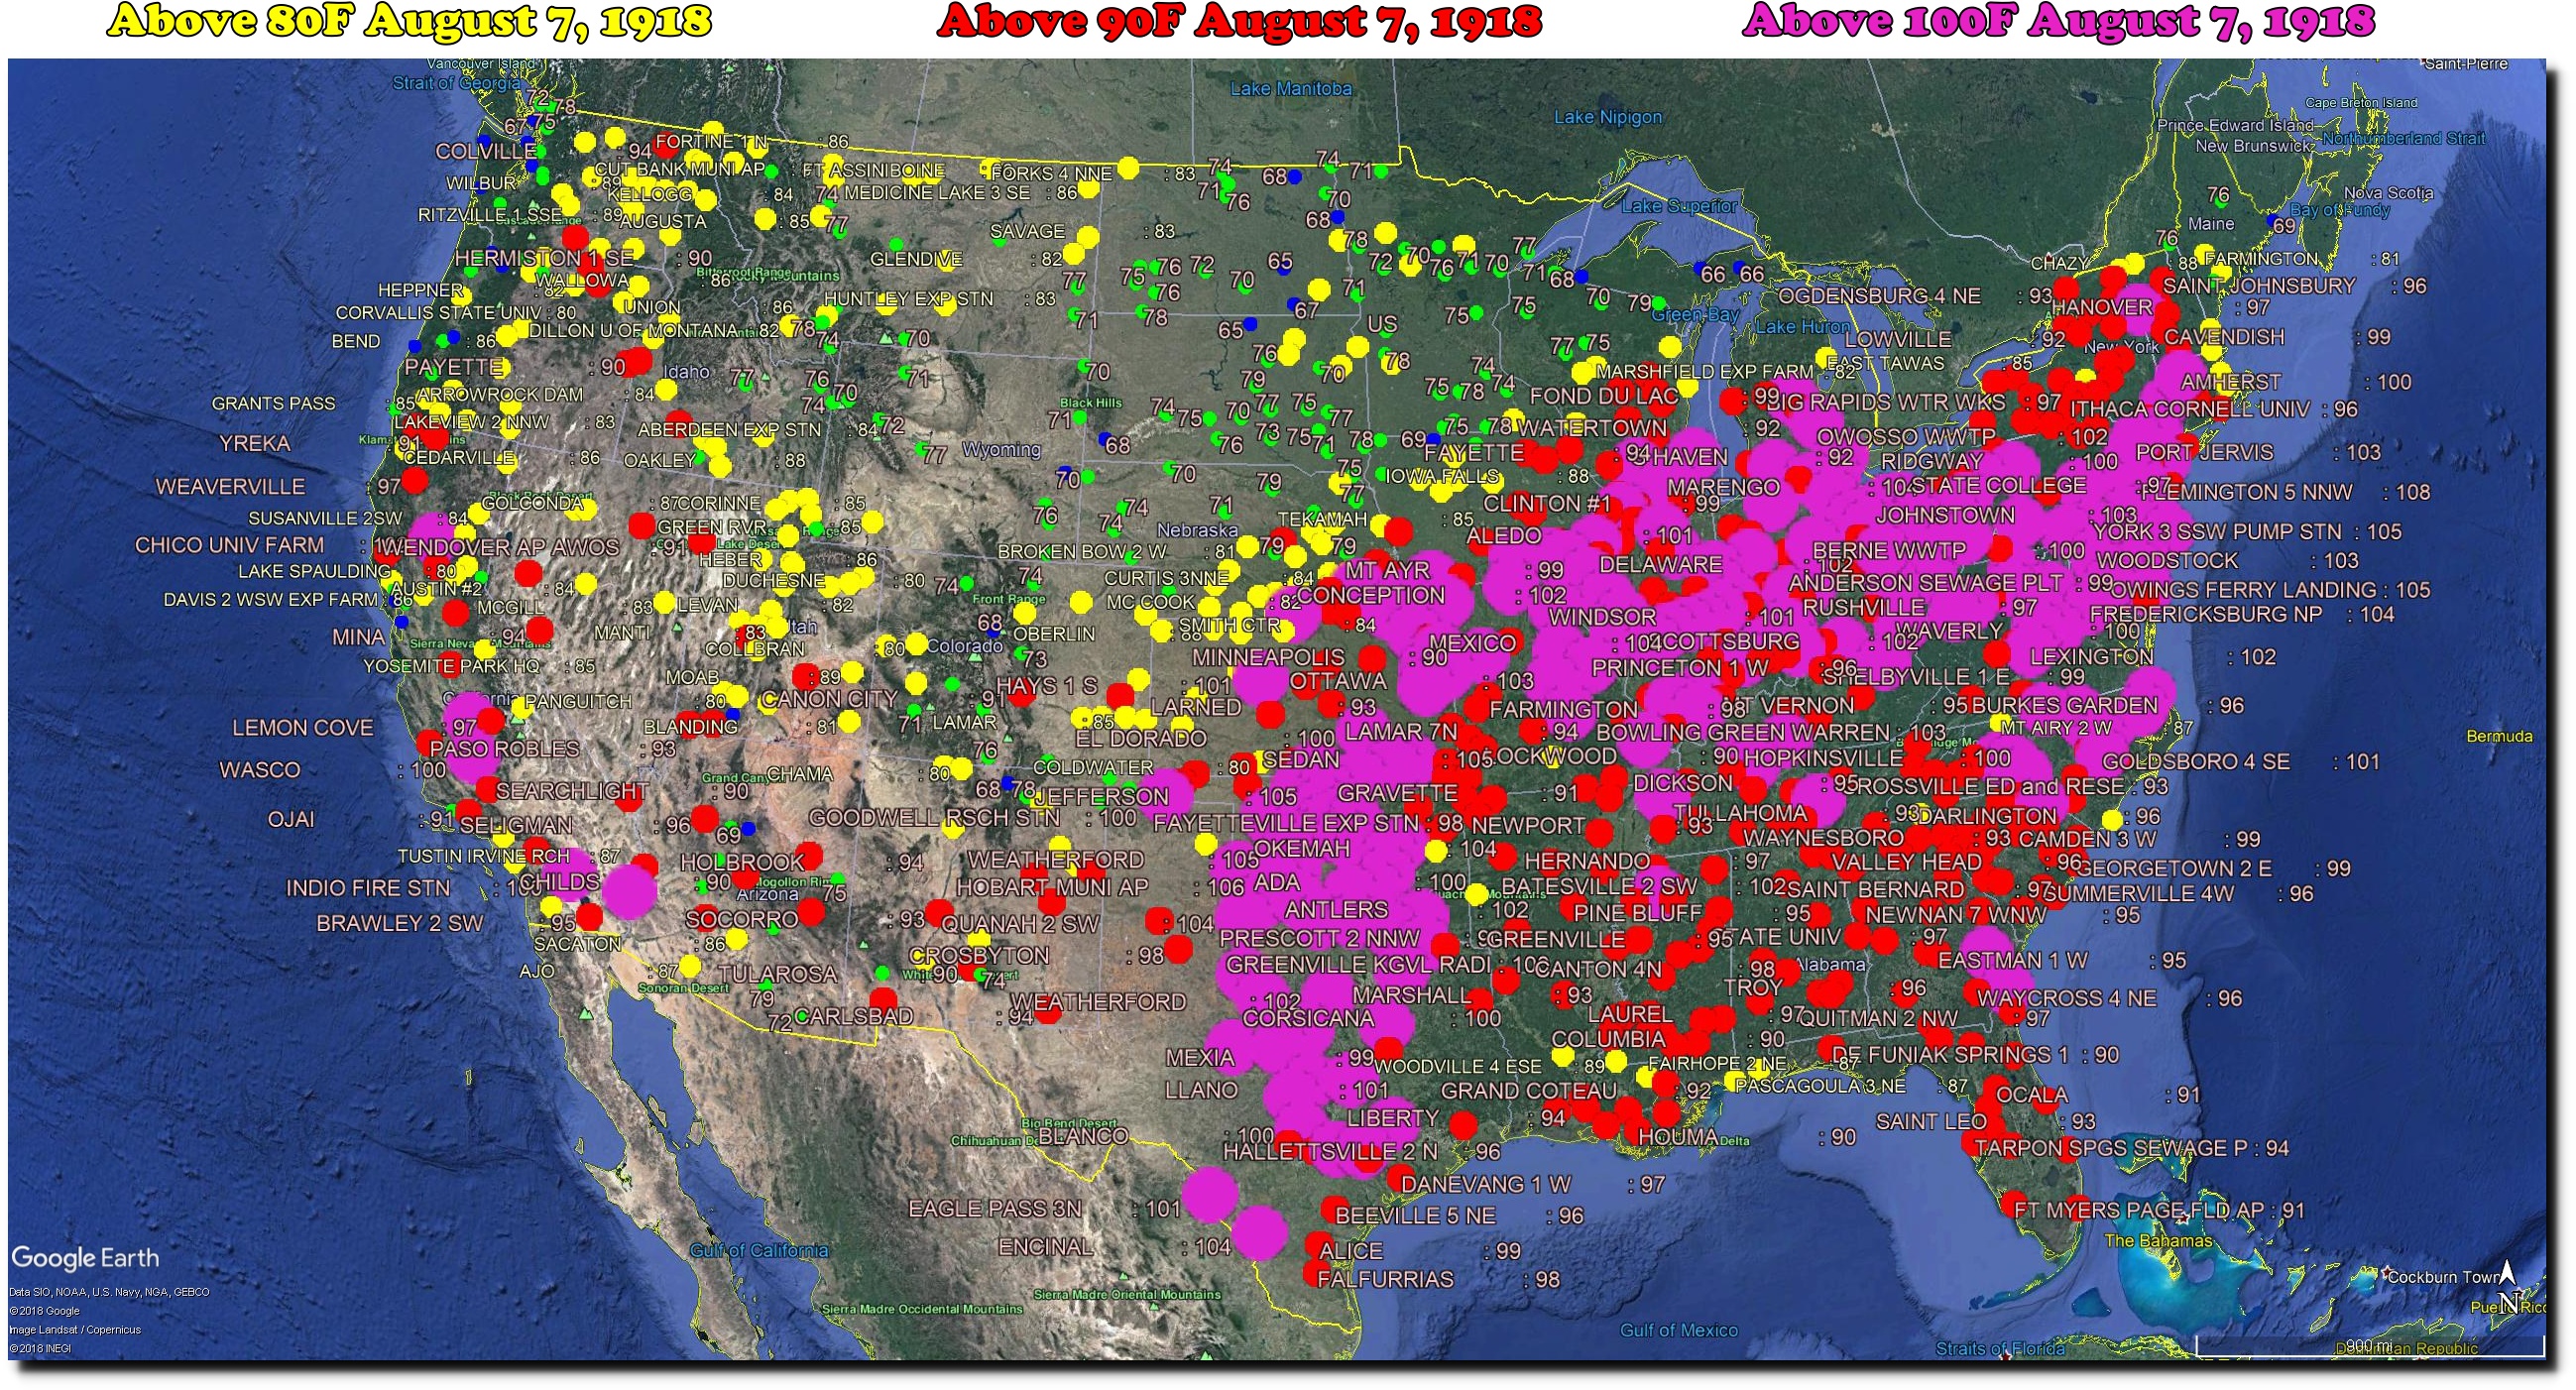
There was an incredible heatwave going on in the US that month – one of the worst on record, but it got little attention because of WWI.
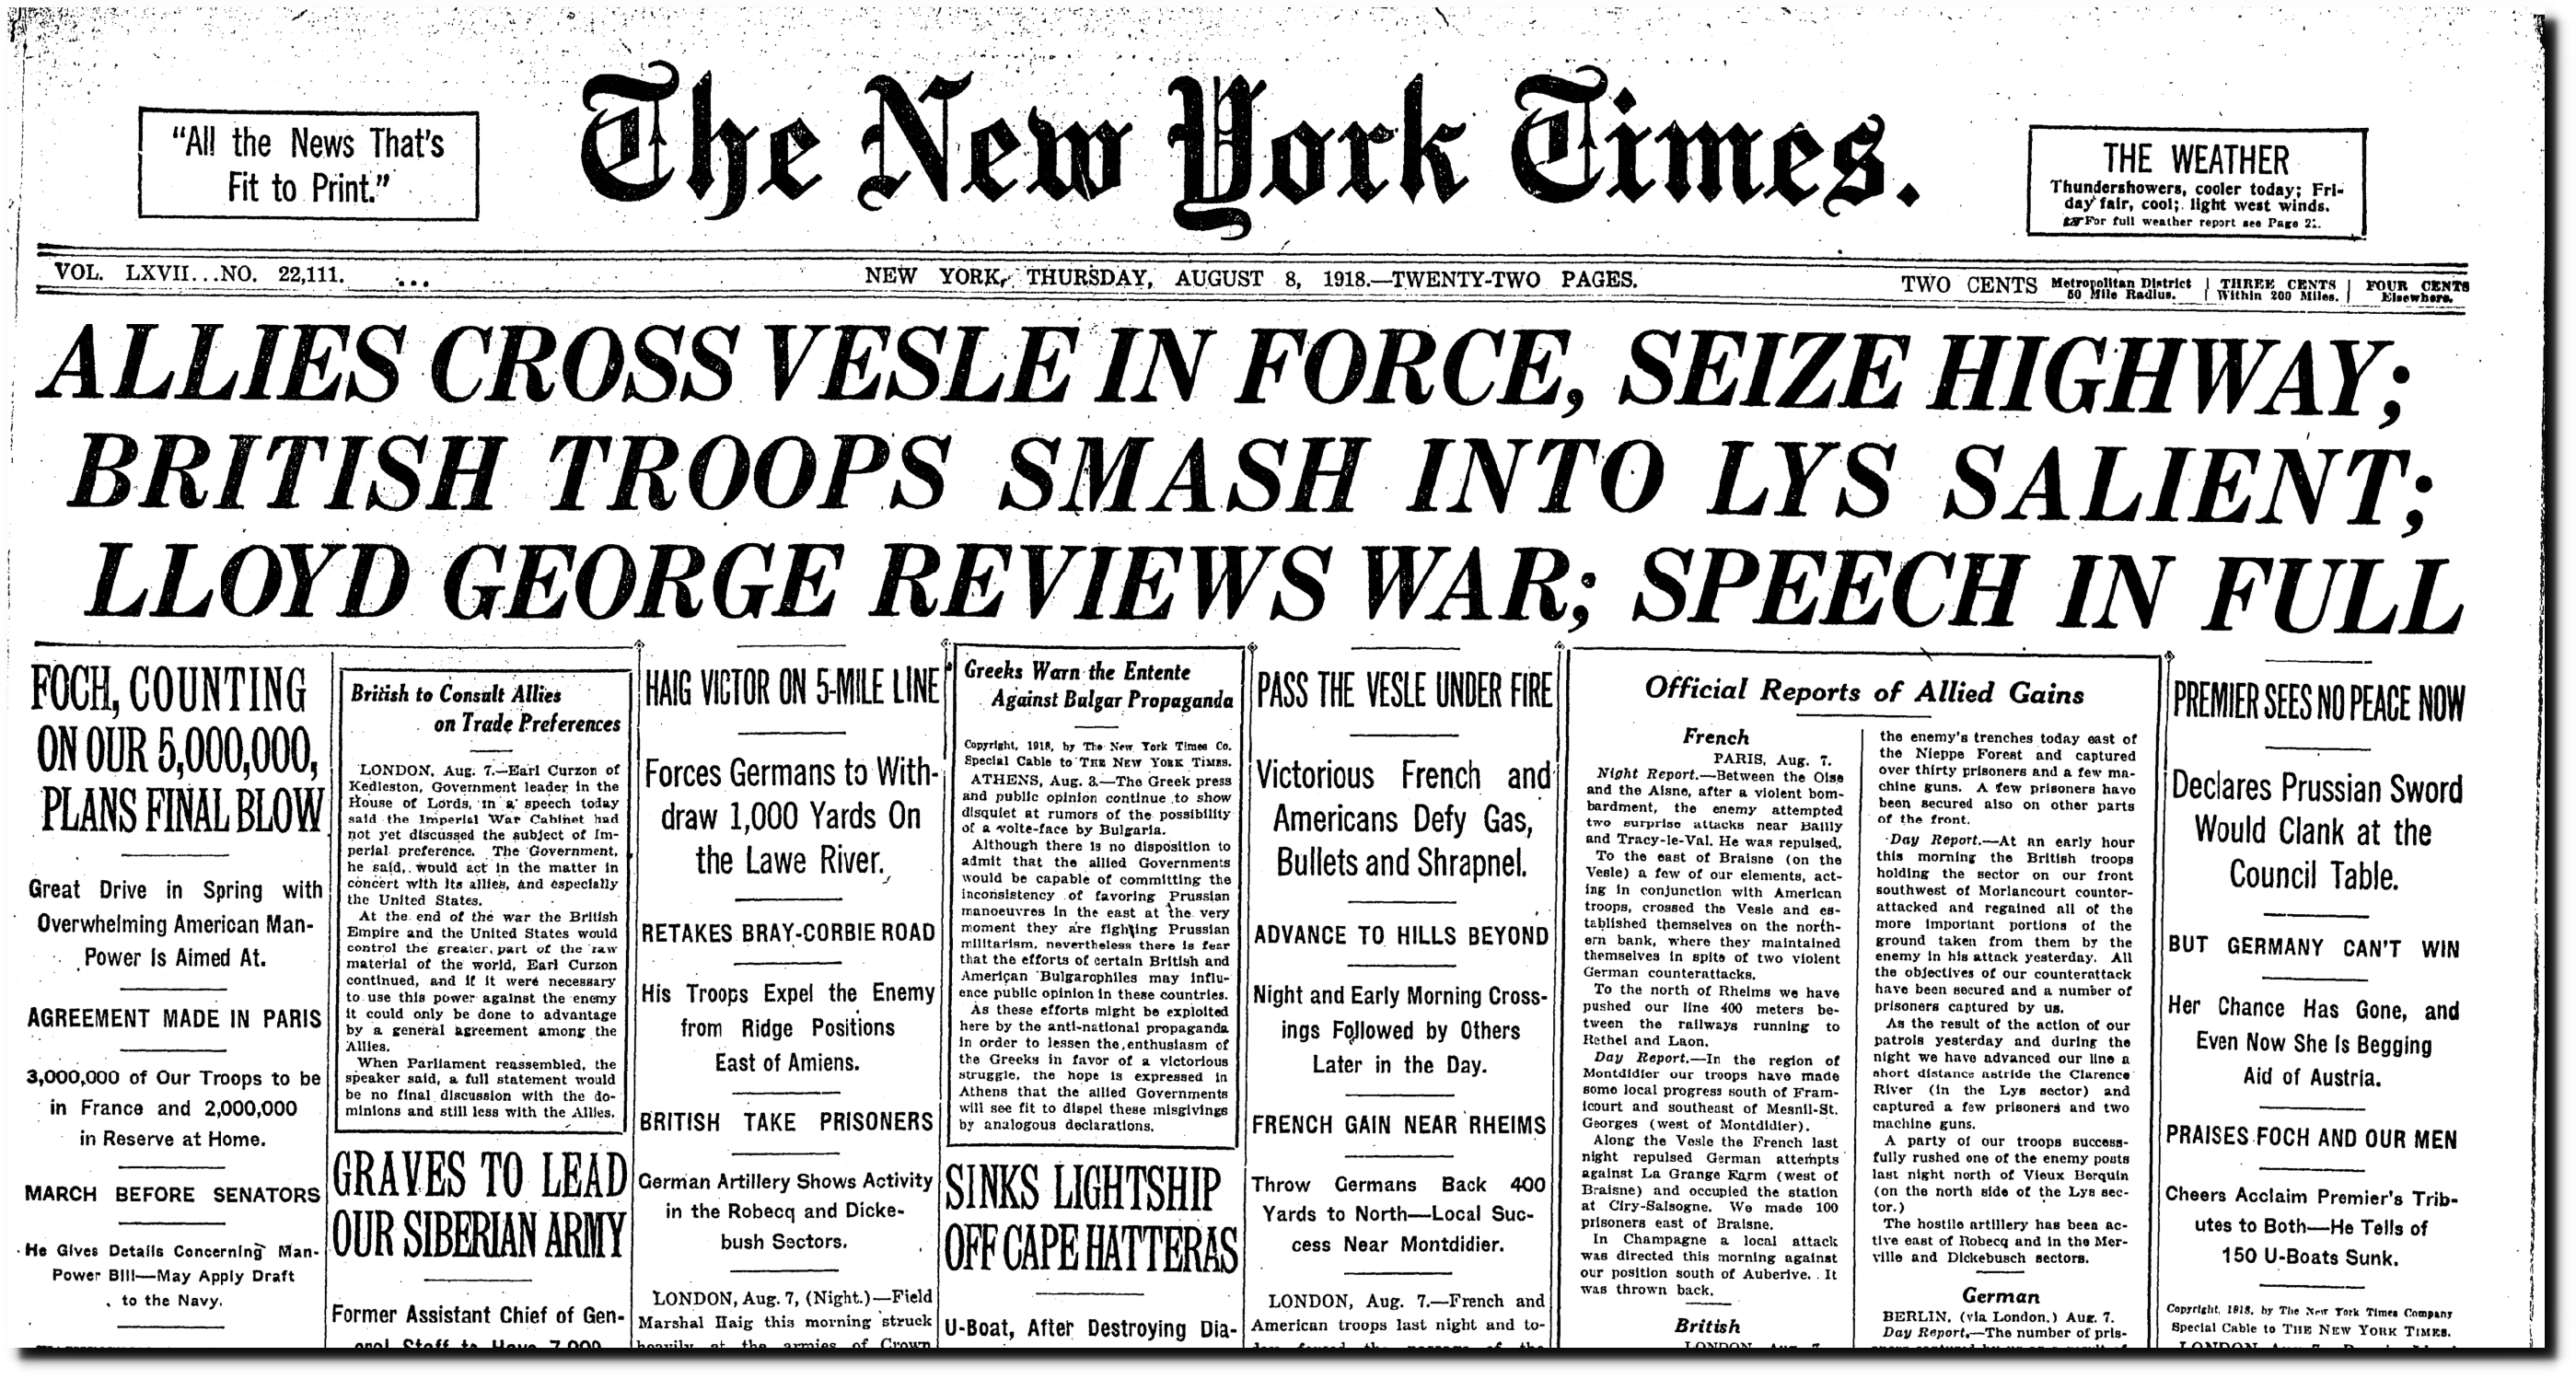
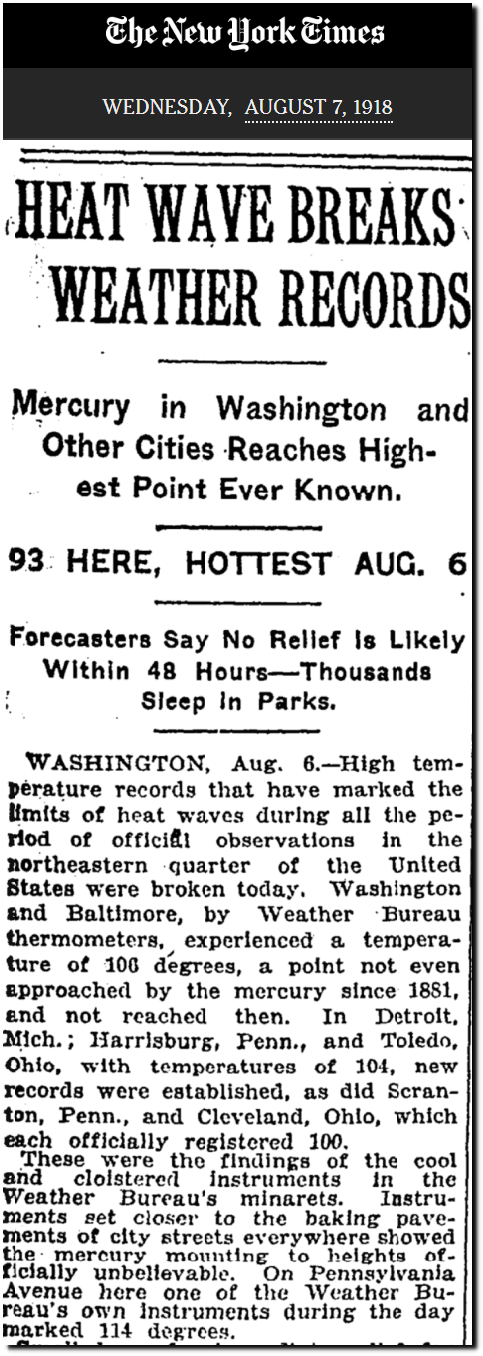
TimesMachine: Wednesday August 7, 1918 – NYTimes.com
Later that year came the worst pandemic in history, with 20-40 million people dying from the flu.
Posted in Uncategorized
Leave a comment
Warmest Midwest Stations Cooling The Fastest
The graph below plots every August daily maximum temperature at all 189 USHCN Midwest stations since 1895 (666,188 readings) – with trendlines for each station.
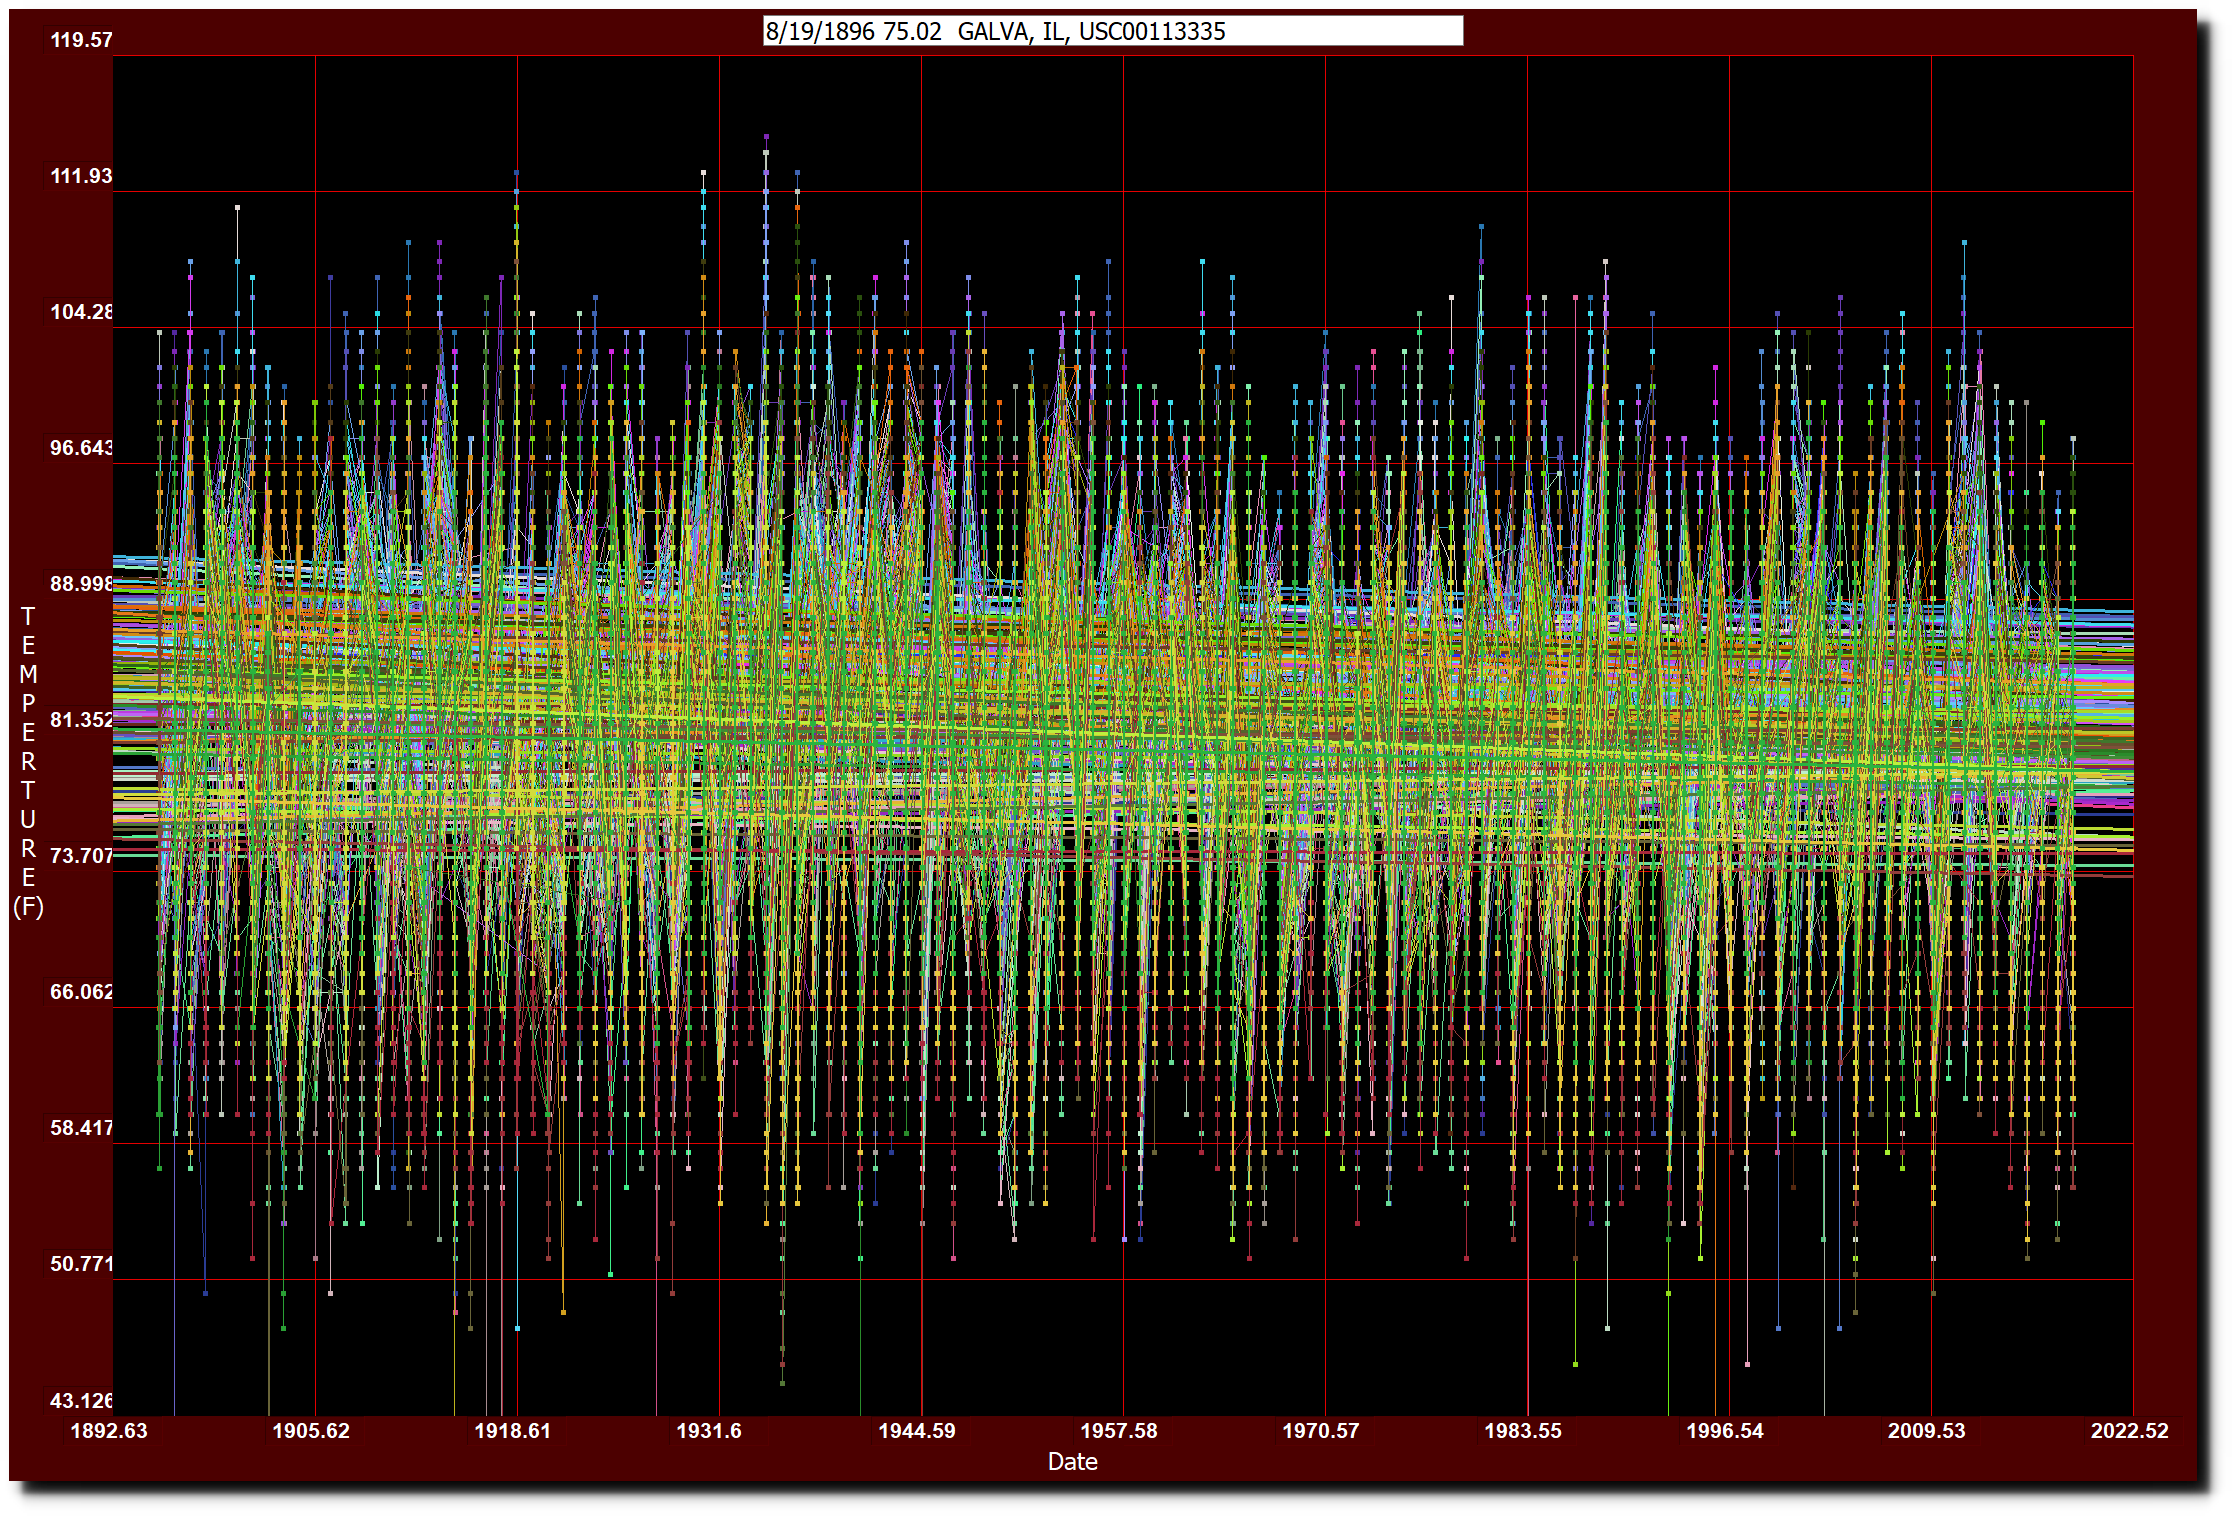
Eighty-eight percent of the stations are cooling, with the warmest stations cooling the fastest
Posted in Uncategorized
Leave a comment
“Woefully Unprepared” For The Barrage Of Junk Science
A new article saying that the Pacific Northwest used to be “too-wet-to-burn” – but global warming is changing that.
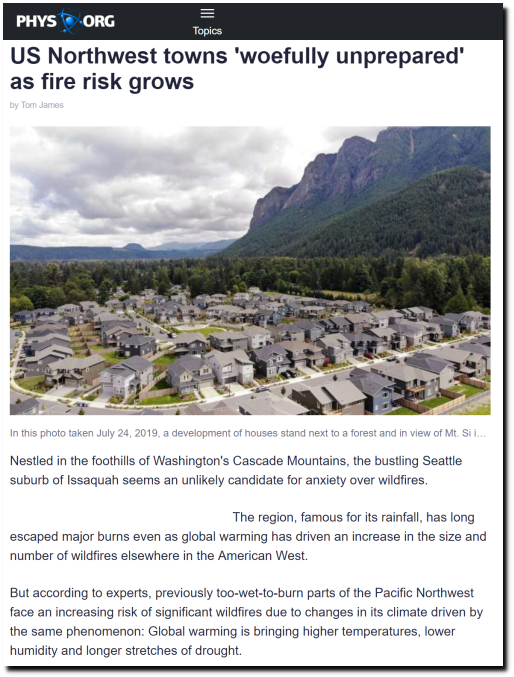
US Northwest towns ‘woefully unprepared’ as fire risk grows
The largest fires in US history occurred in the Pacific Northwest in 1910.
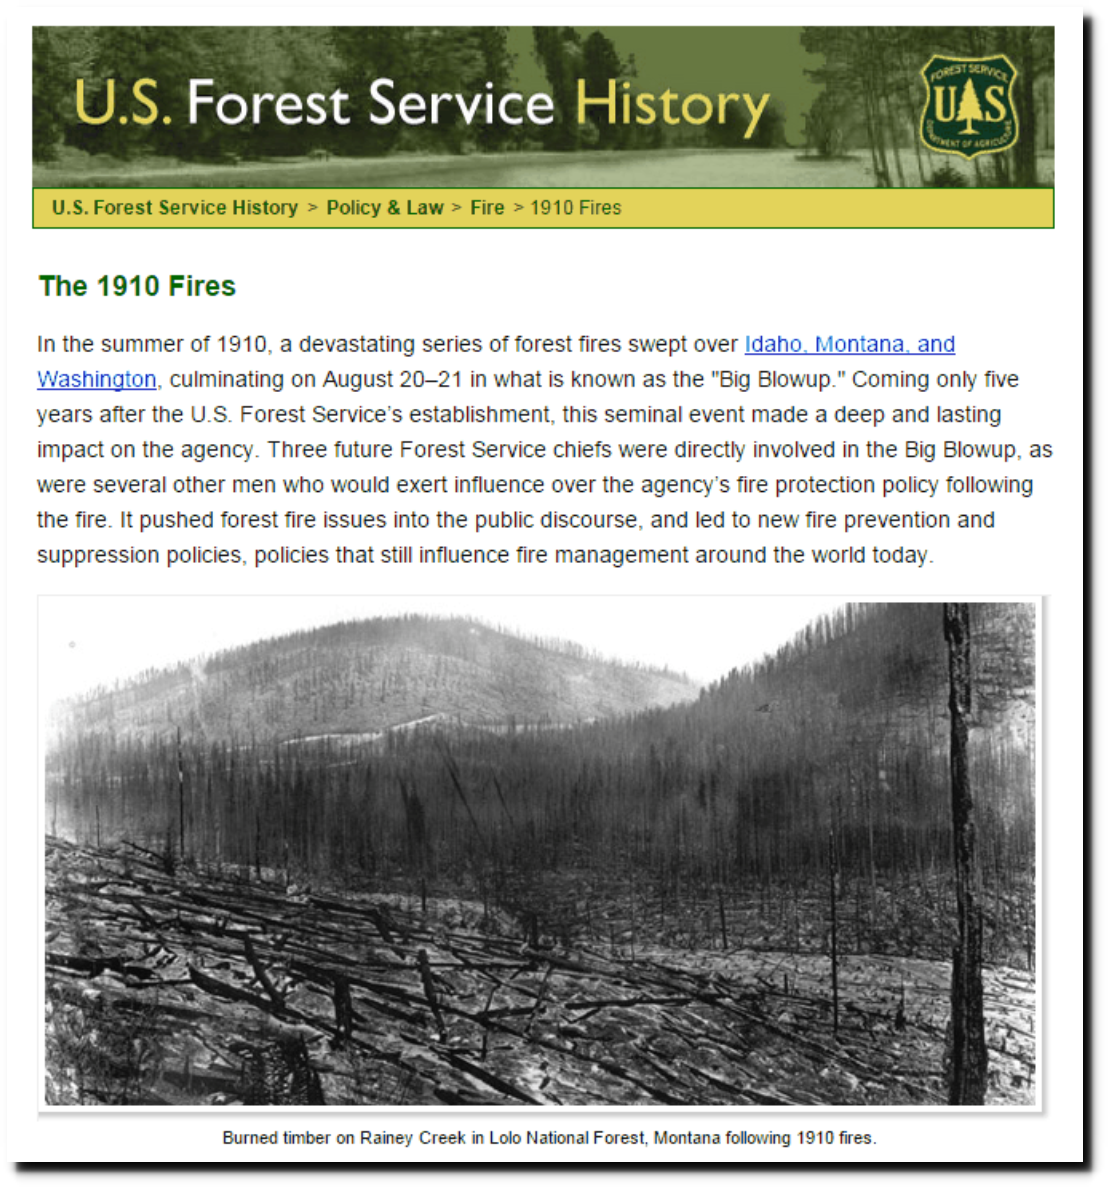
1910 Fires – USFS History – Forest History Society
The 1880s brought massive fires to the Cascade Mountains.
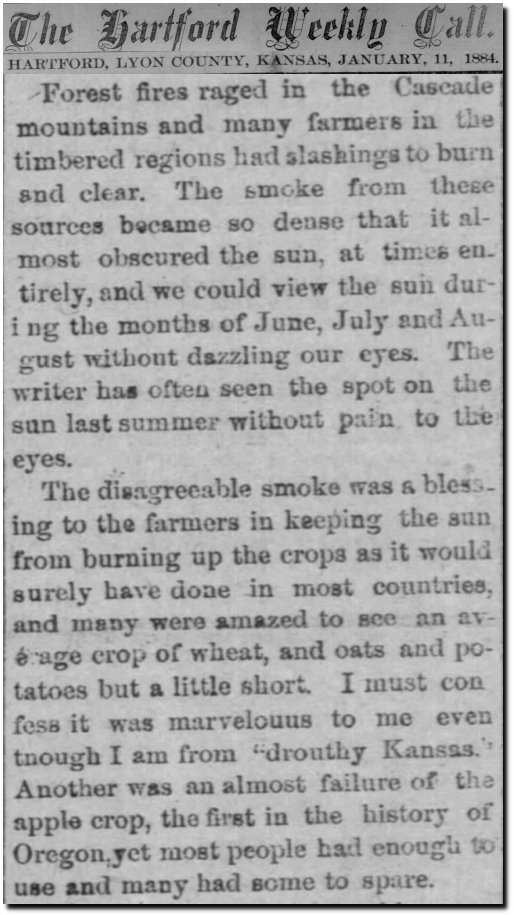
11 Jan 1884, 1 – The Hartford Call at Newspapers.com
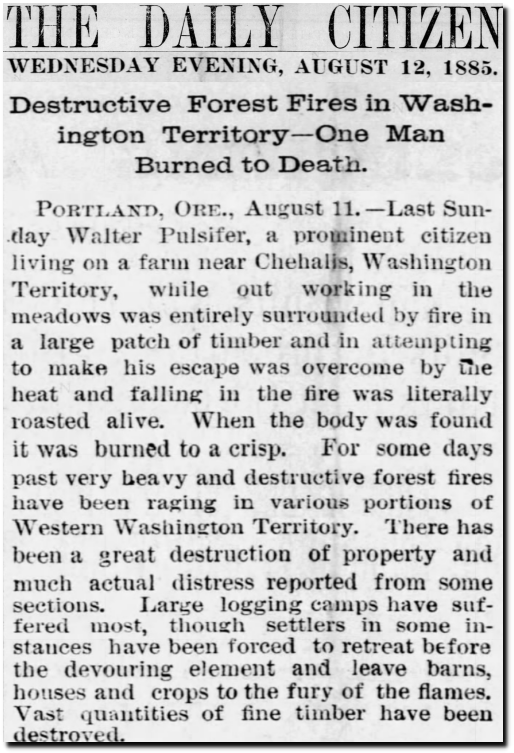
12 Aug 1885, 1 – The Citizen at Newspapers.com
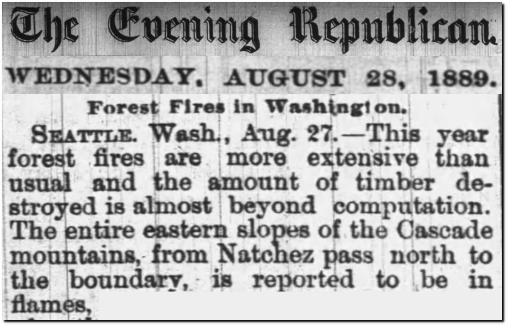
28 Aug 1889, Page 1 – The Republic at Newspapers.com
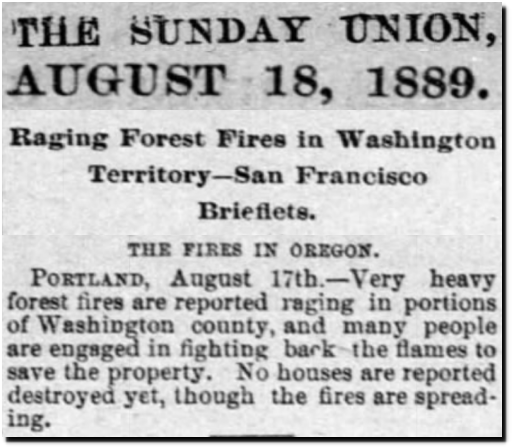
18 Aug 1889, Page 4 – The Record-Union at Newspapers.com
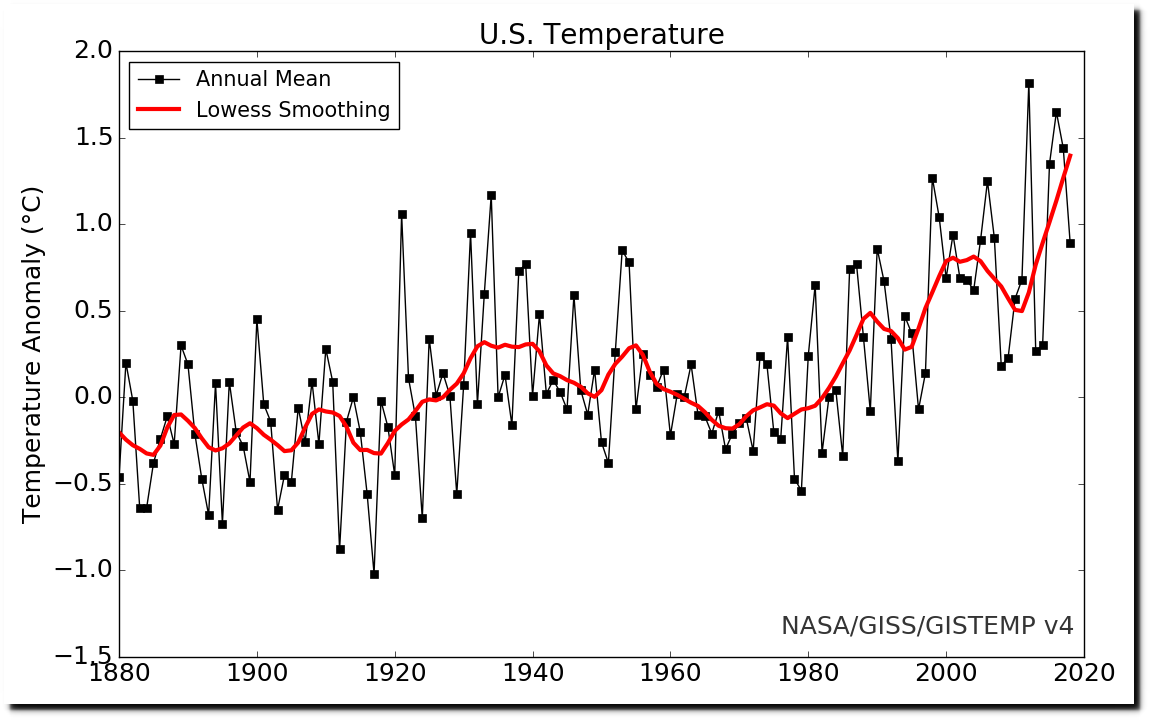
According to NASA, all of these fires occurred during the coldest years on record.
There were many other low-CO2 fires in the Cascade Mountains.
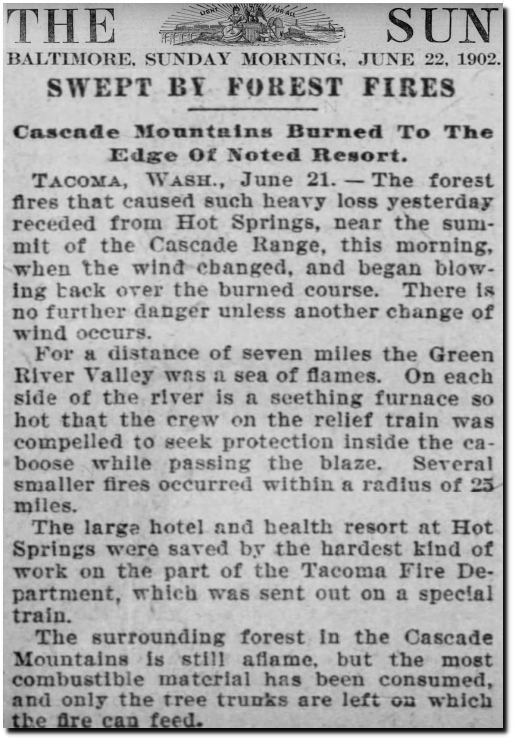
22 Jun 1902, 1 – The Baltimore Sun at Newspapers.com
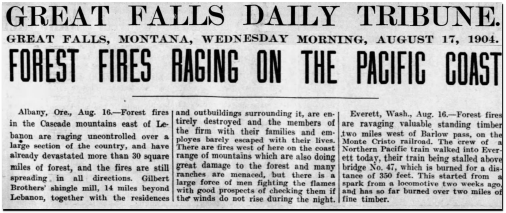
17 Aug 1904, Page 1 – Great Falls Tribune at Newspapers.com
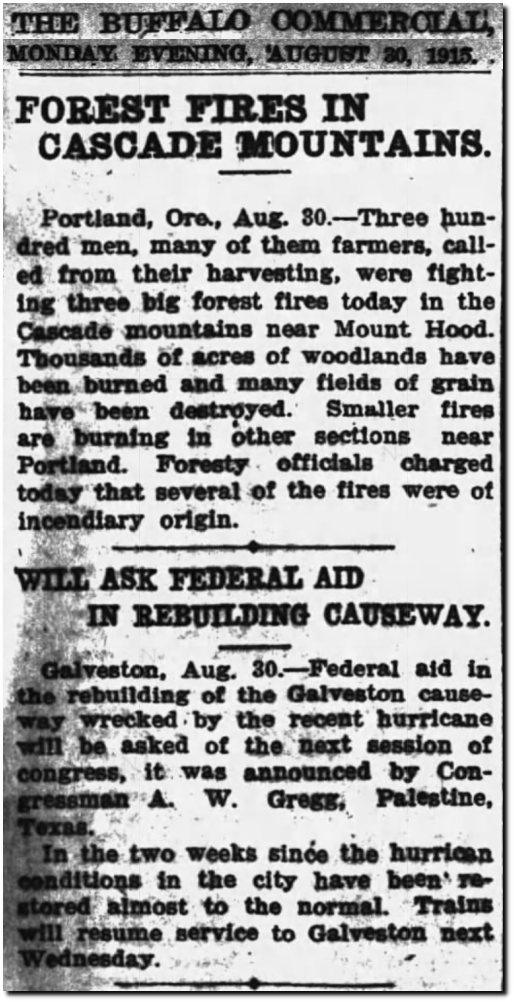
30 Aug 1915, 9 – The Buffalo Commercial at Newspapers.com
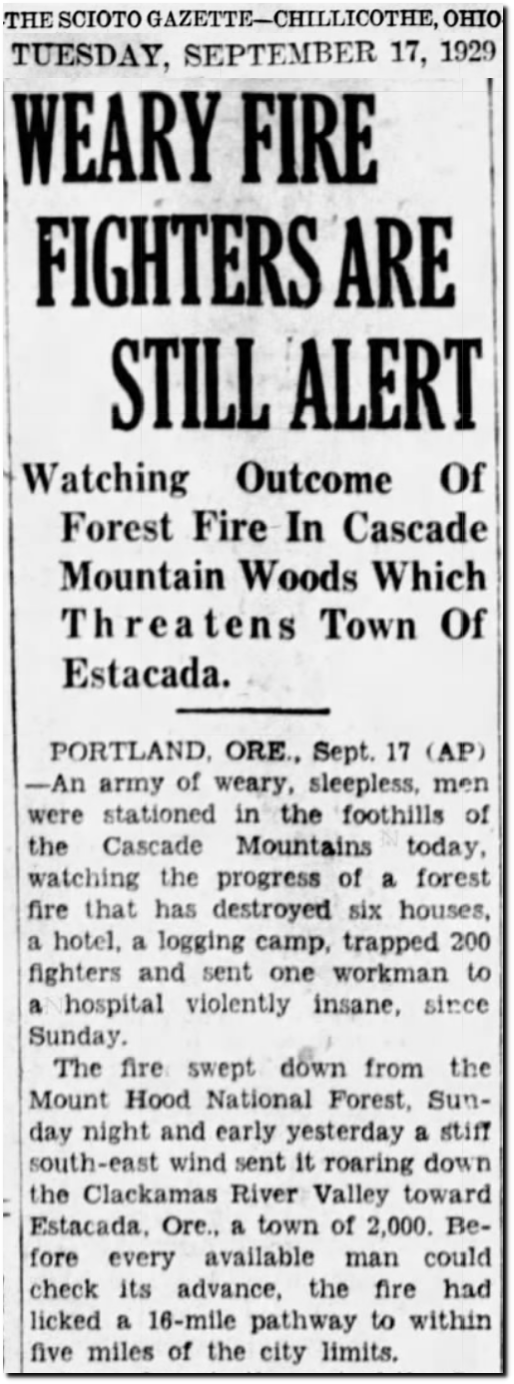
17 Sep 1929, 12 – Chillicothe Gazette at Newspapers.com
Forest fire burn acreage has plummeted in the US, even as NASA claims temperatures are skyrocketing.
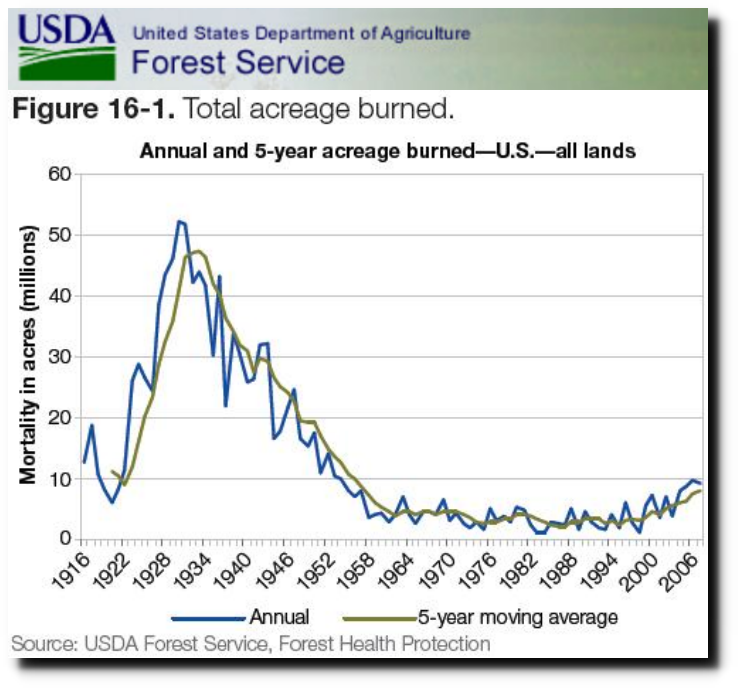
Indicator 3.16: Area and percent of forest affected by abiotic agents
We have far fewer fires than we used to.
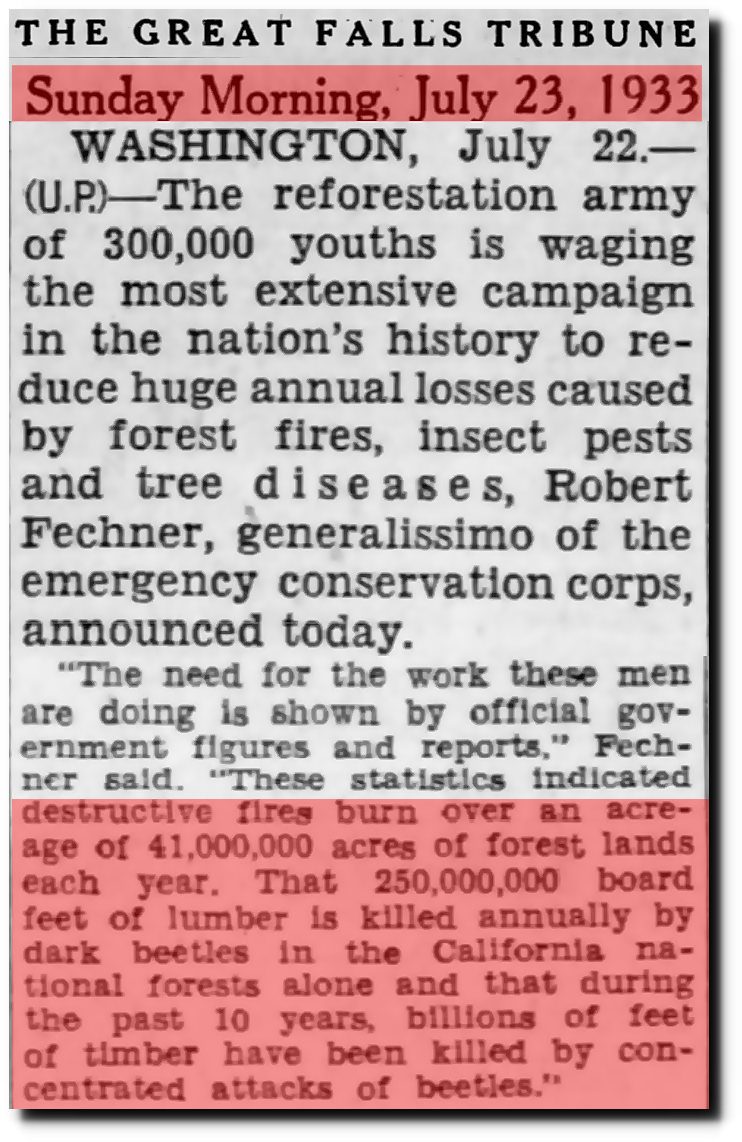
23 Jul 1933, Page 12 – Great Falls Tribune at Newspapers.com
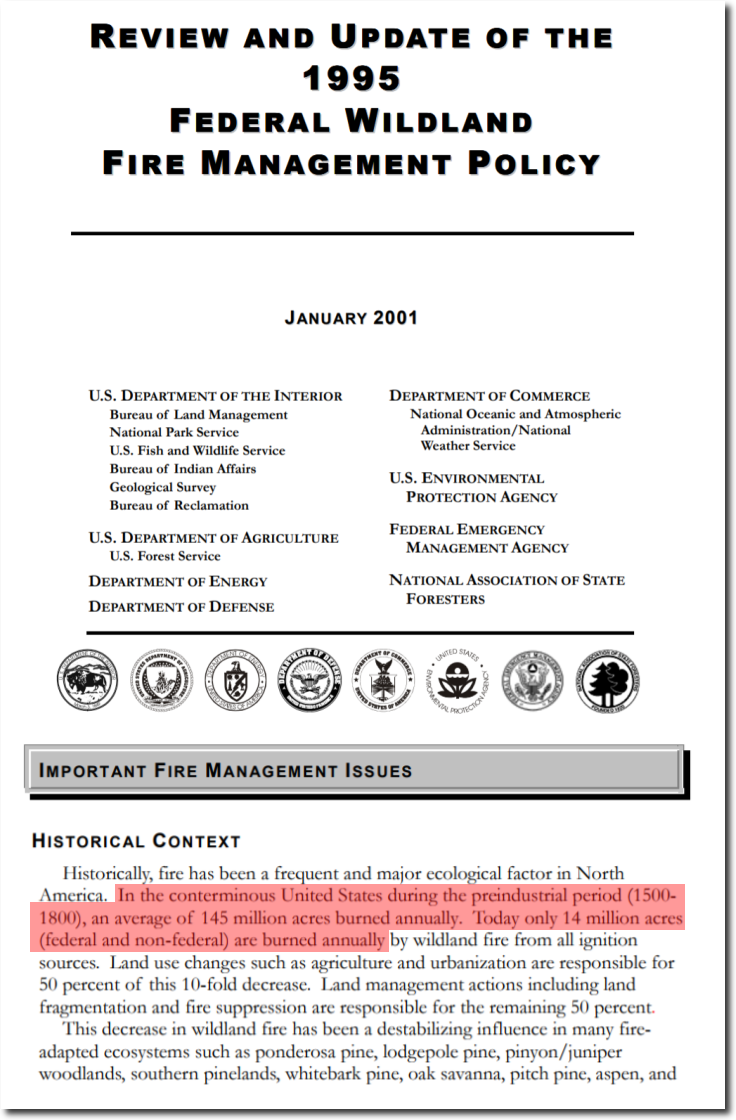
In pre-industrial times, when CO2 was below 280 PPM, burn acreage in the US was ten times larger than now.
This year has been very cool and wet in the western US, and we are having a record quiet fore season.
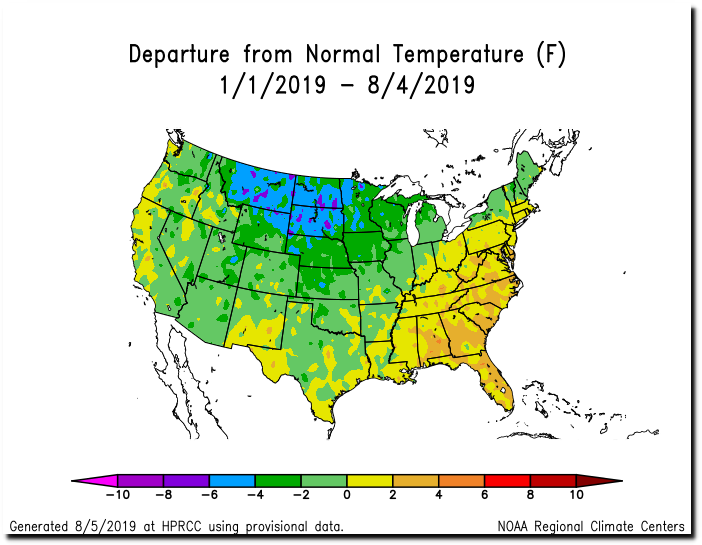
https://hprcc.unl.edu/products/maps/acis/YearTDeptUS.png
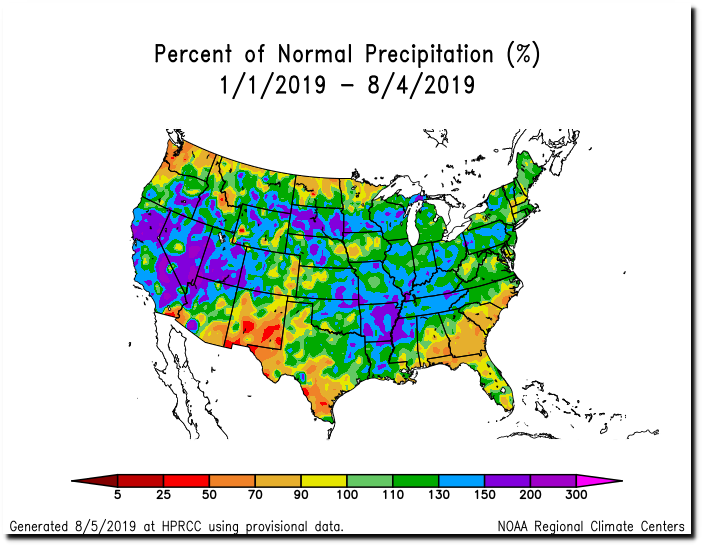
https://hprcc.unl.edu/products/maps/acis/YearPNormUS.png
Climate alarm is dependent on an ignorance of history, academics, journalists and politicians who are willing to lie, and a public which is willing to be misled.
Posted in Uncategorized
Leave a comment
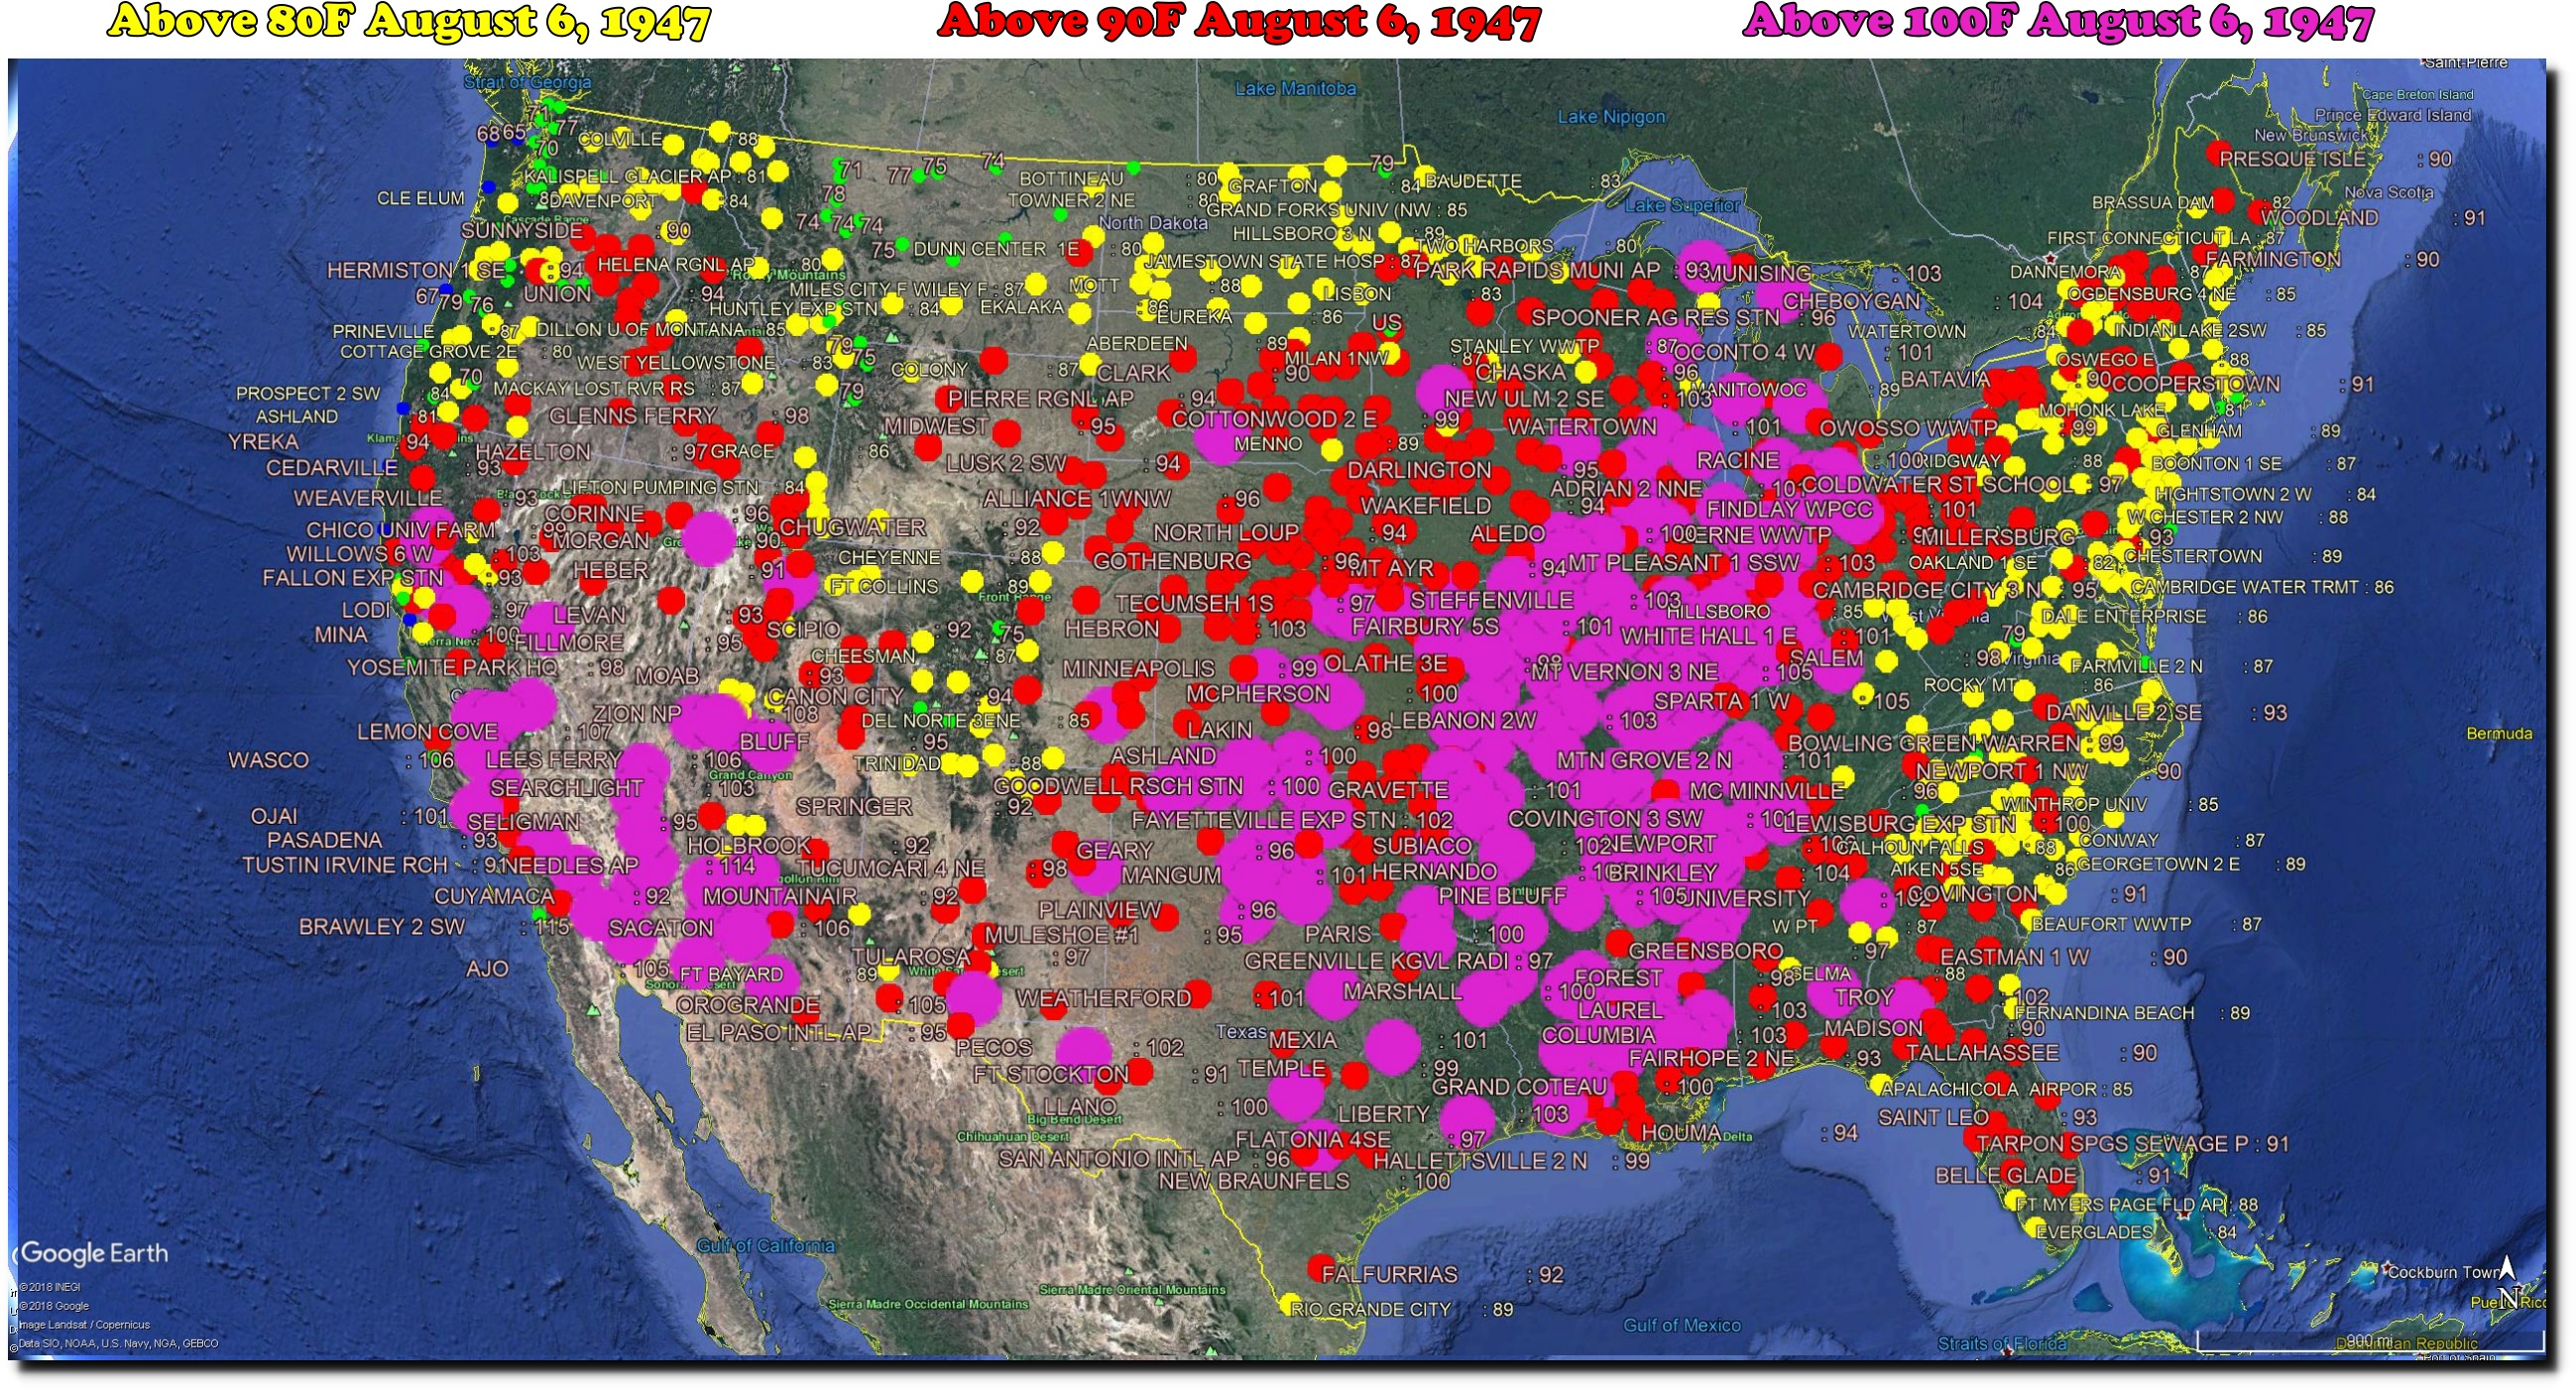
Low CO2 August 6 Heatwaves
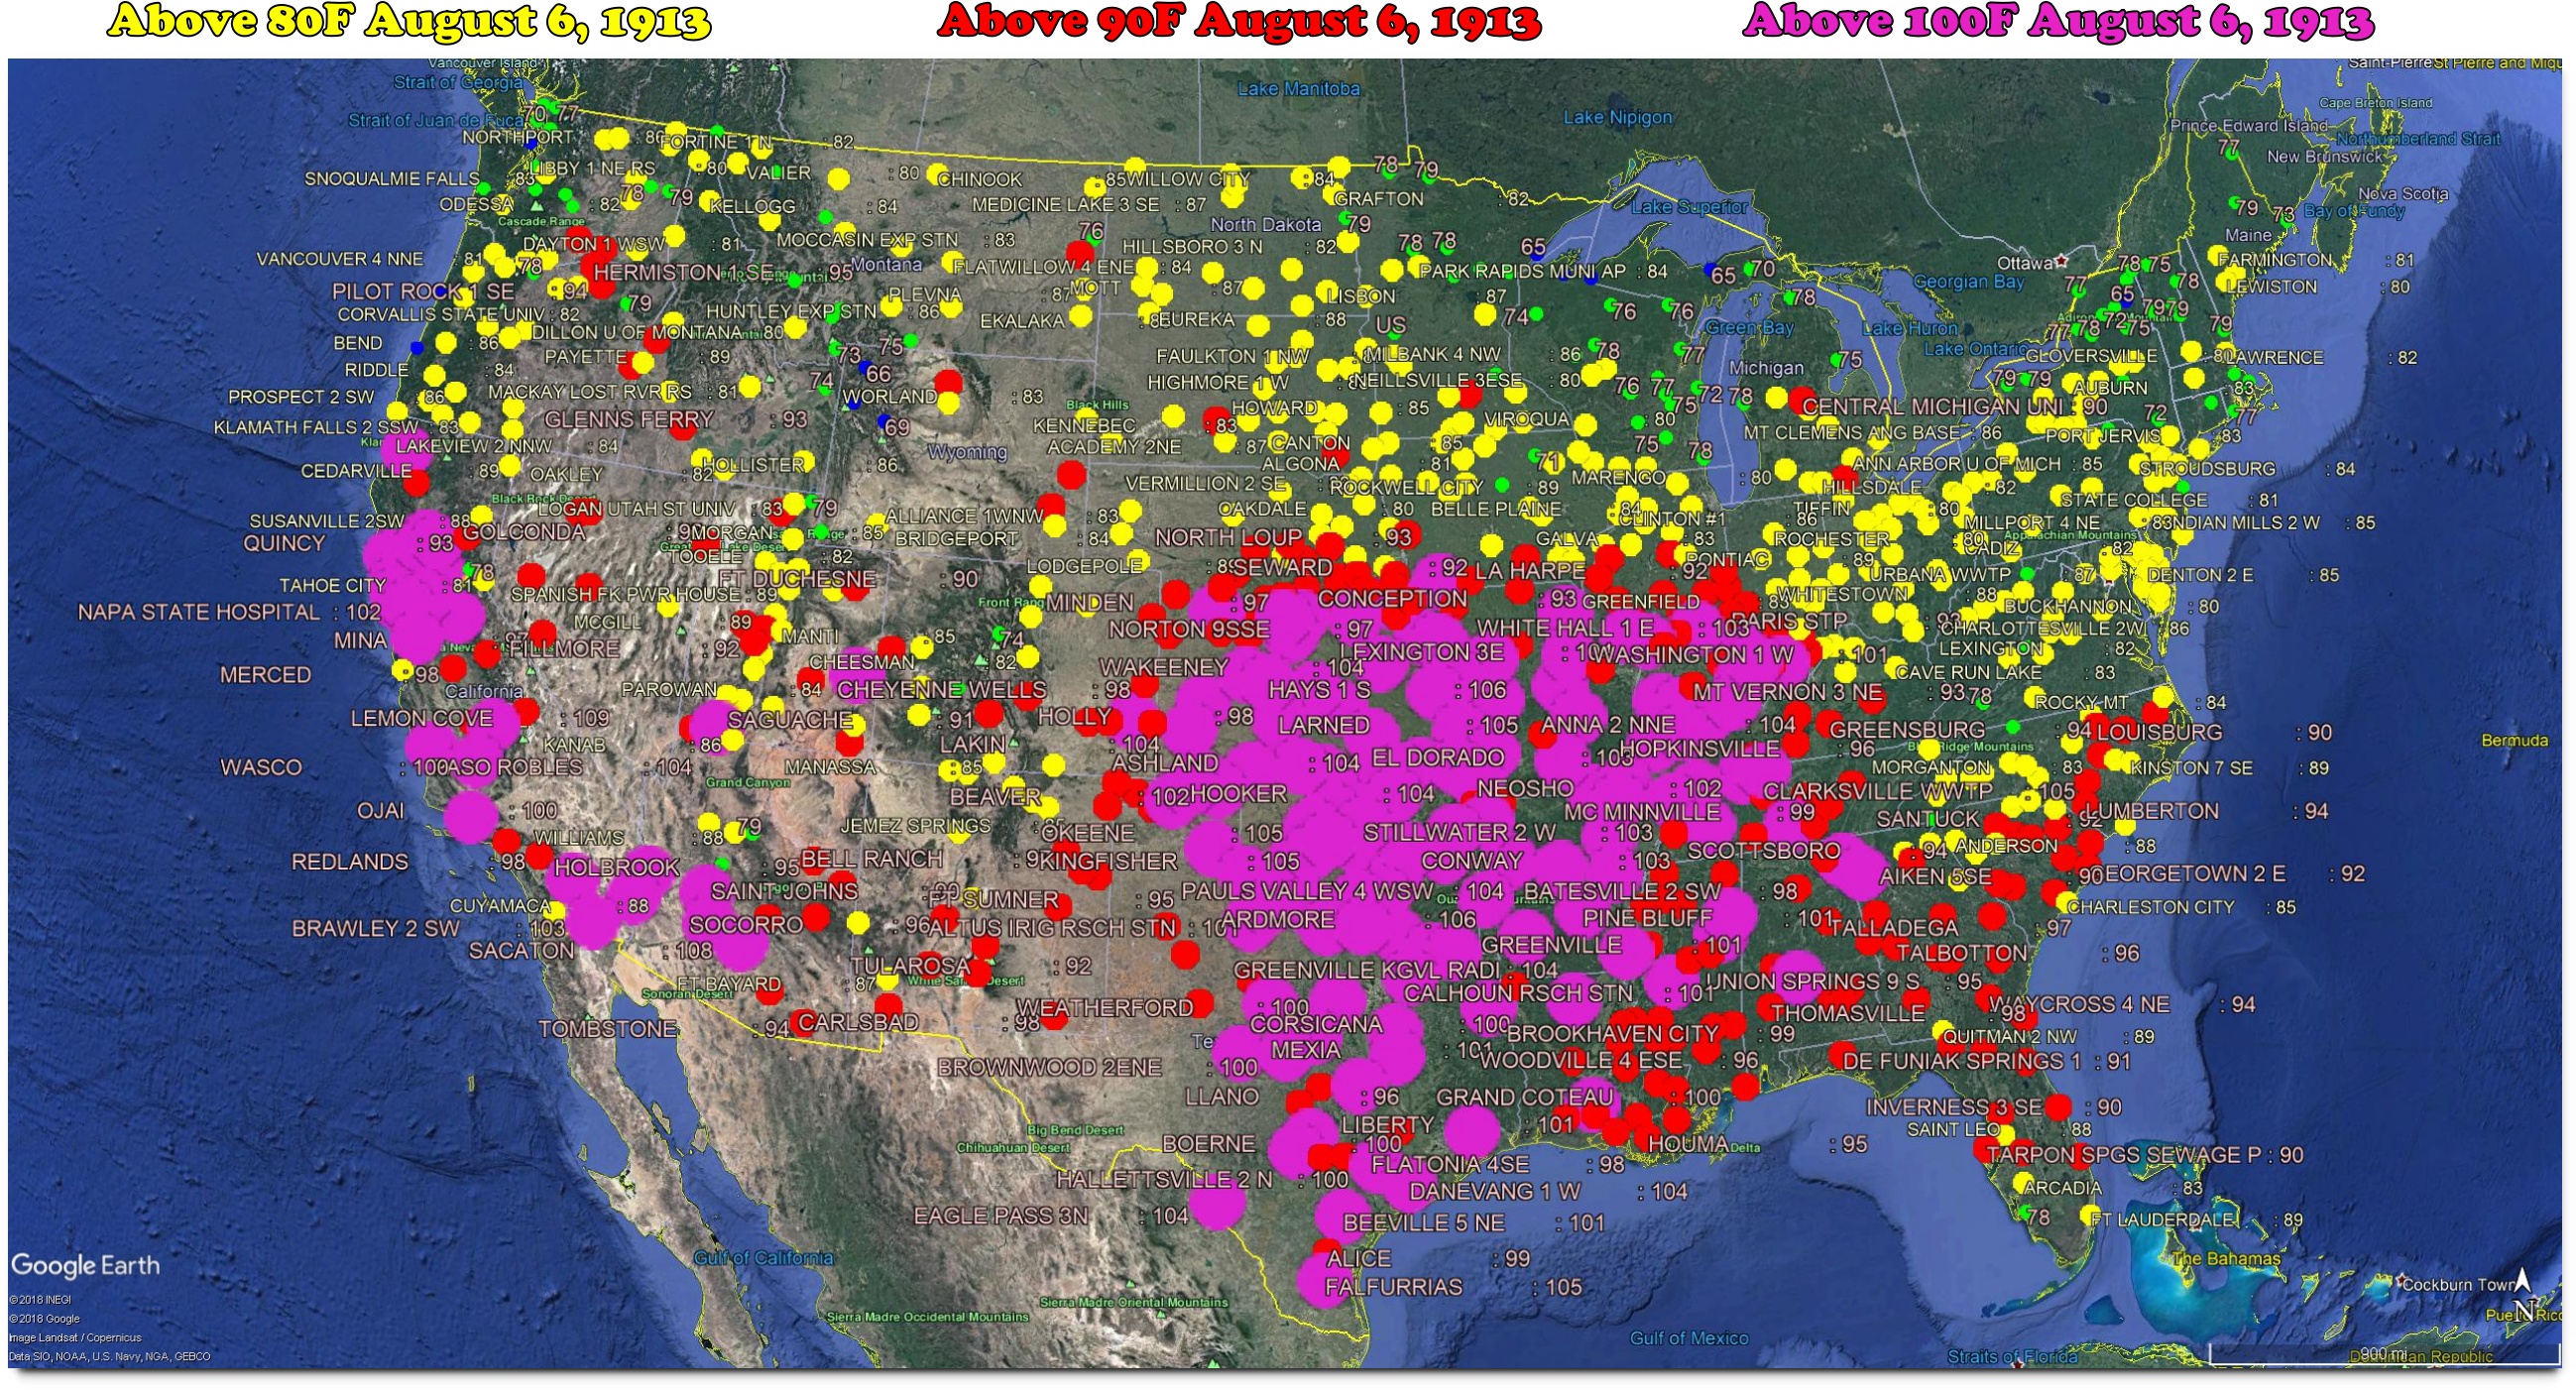
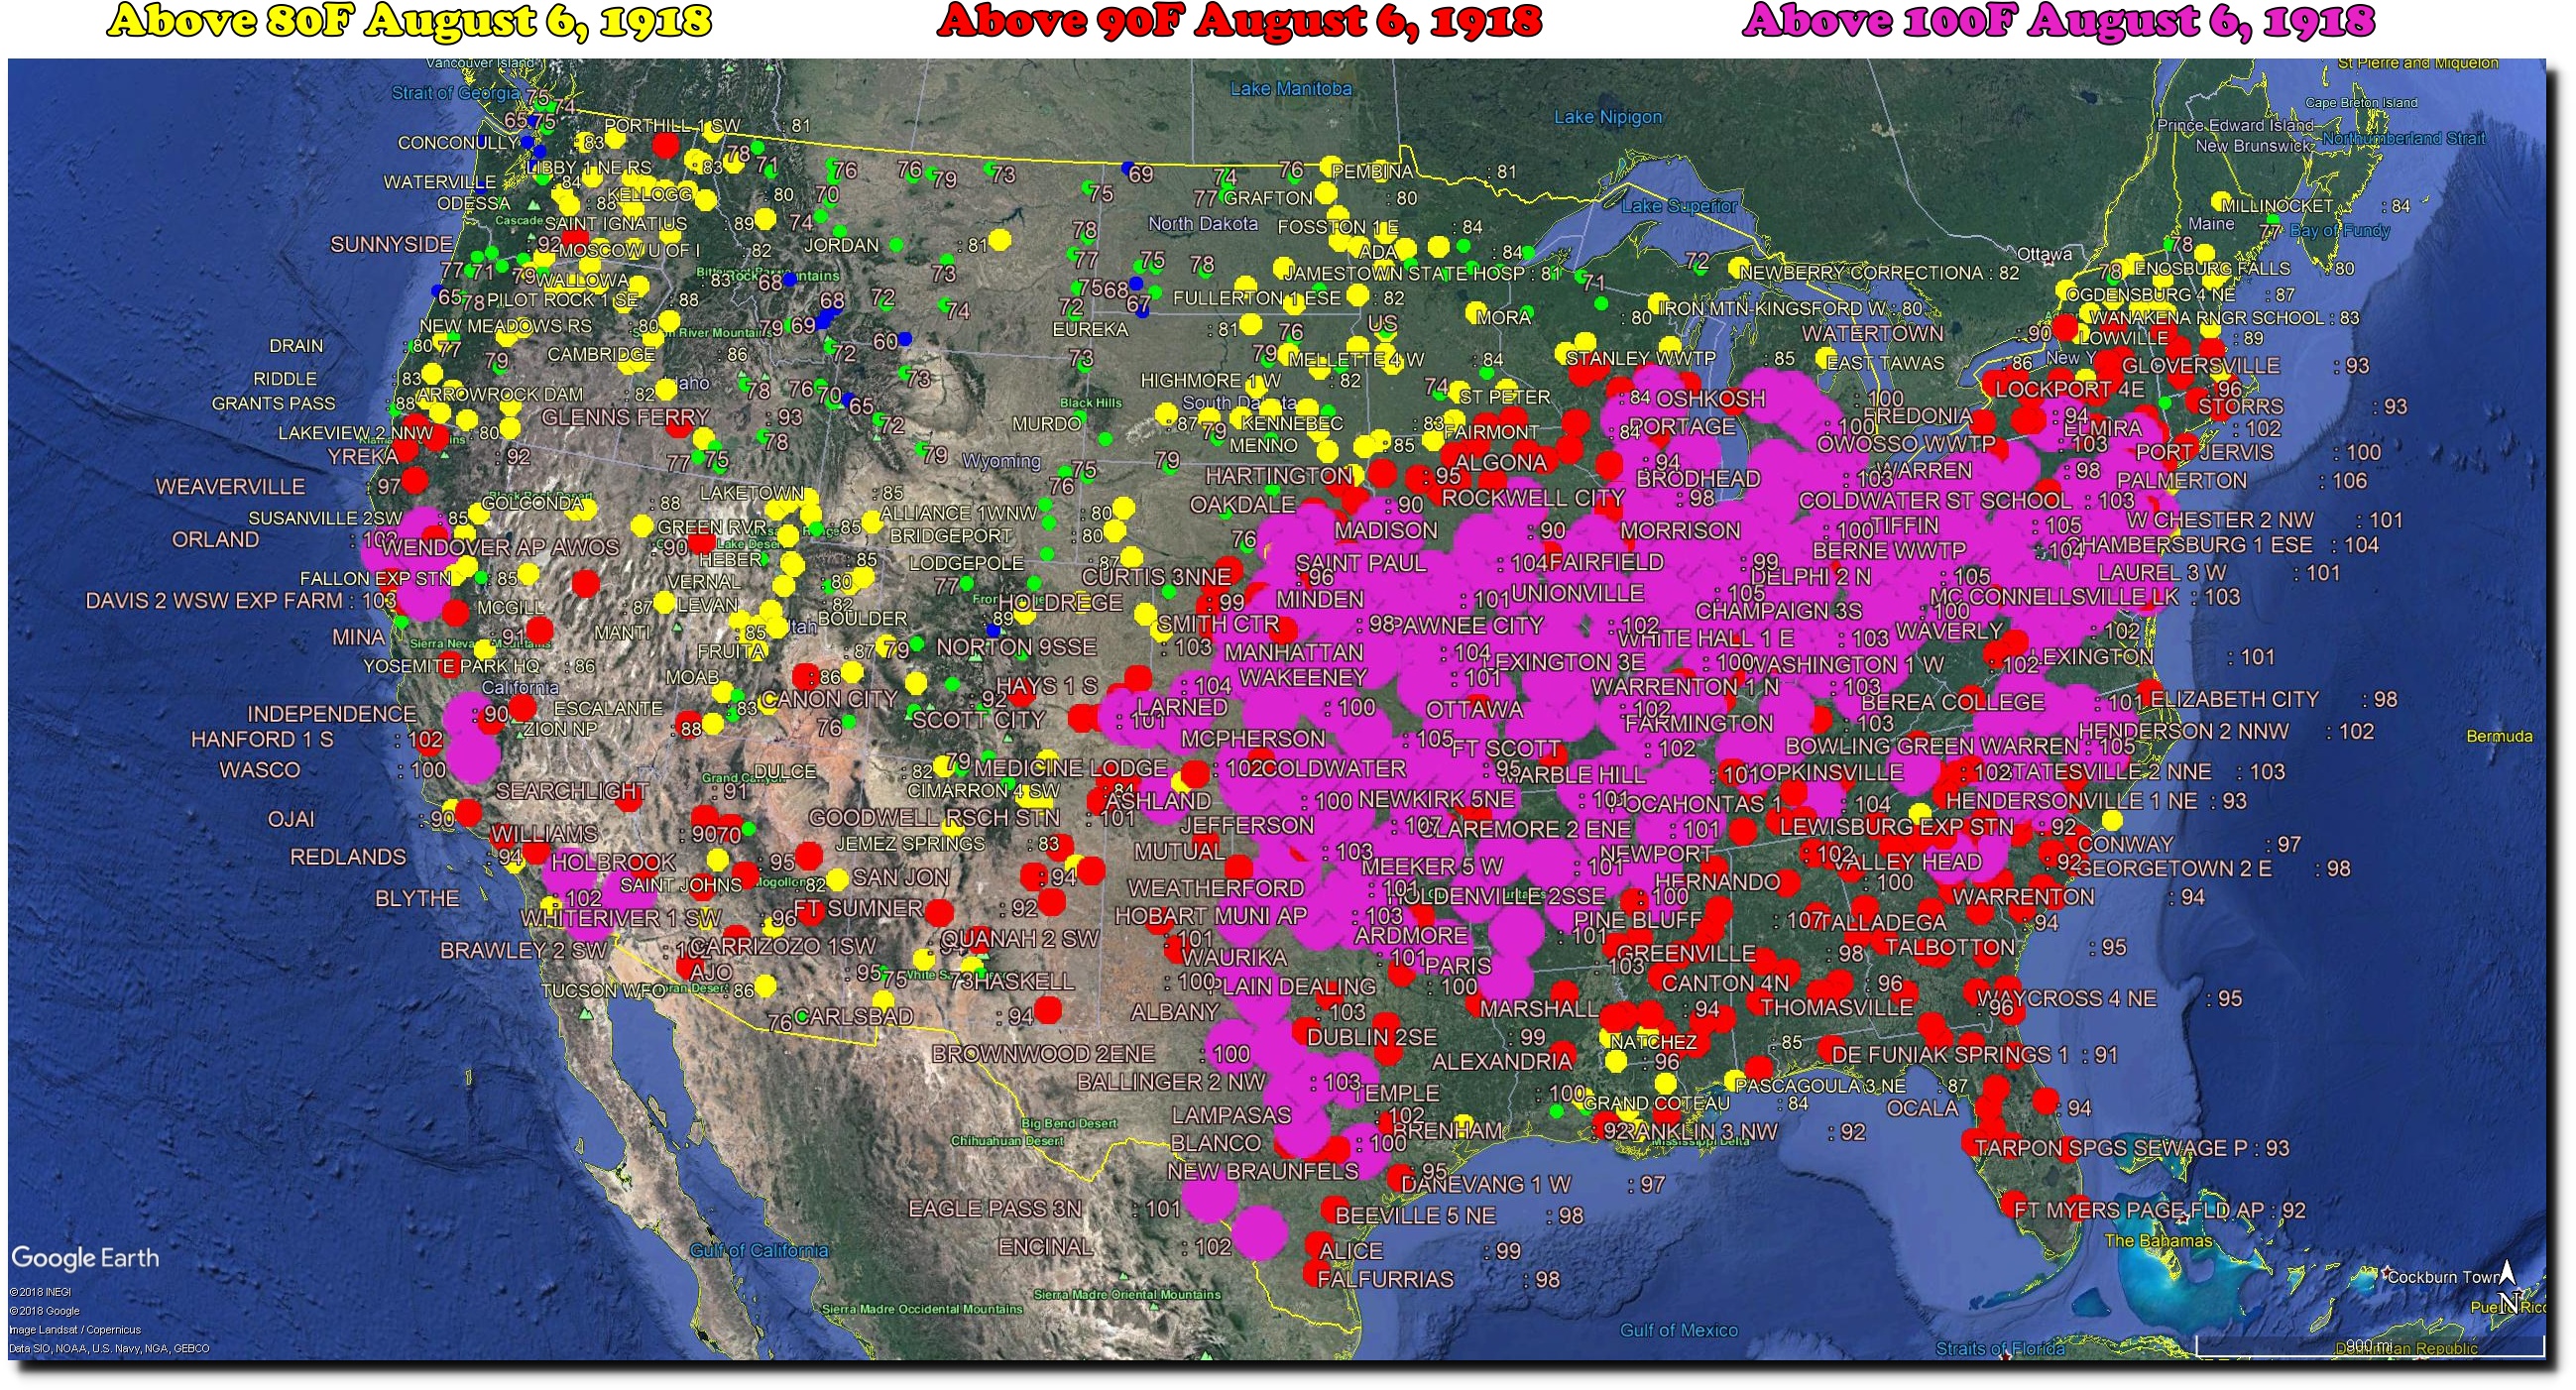
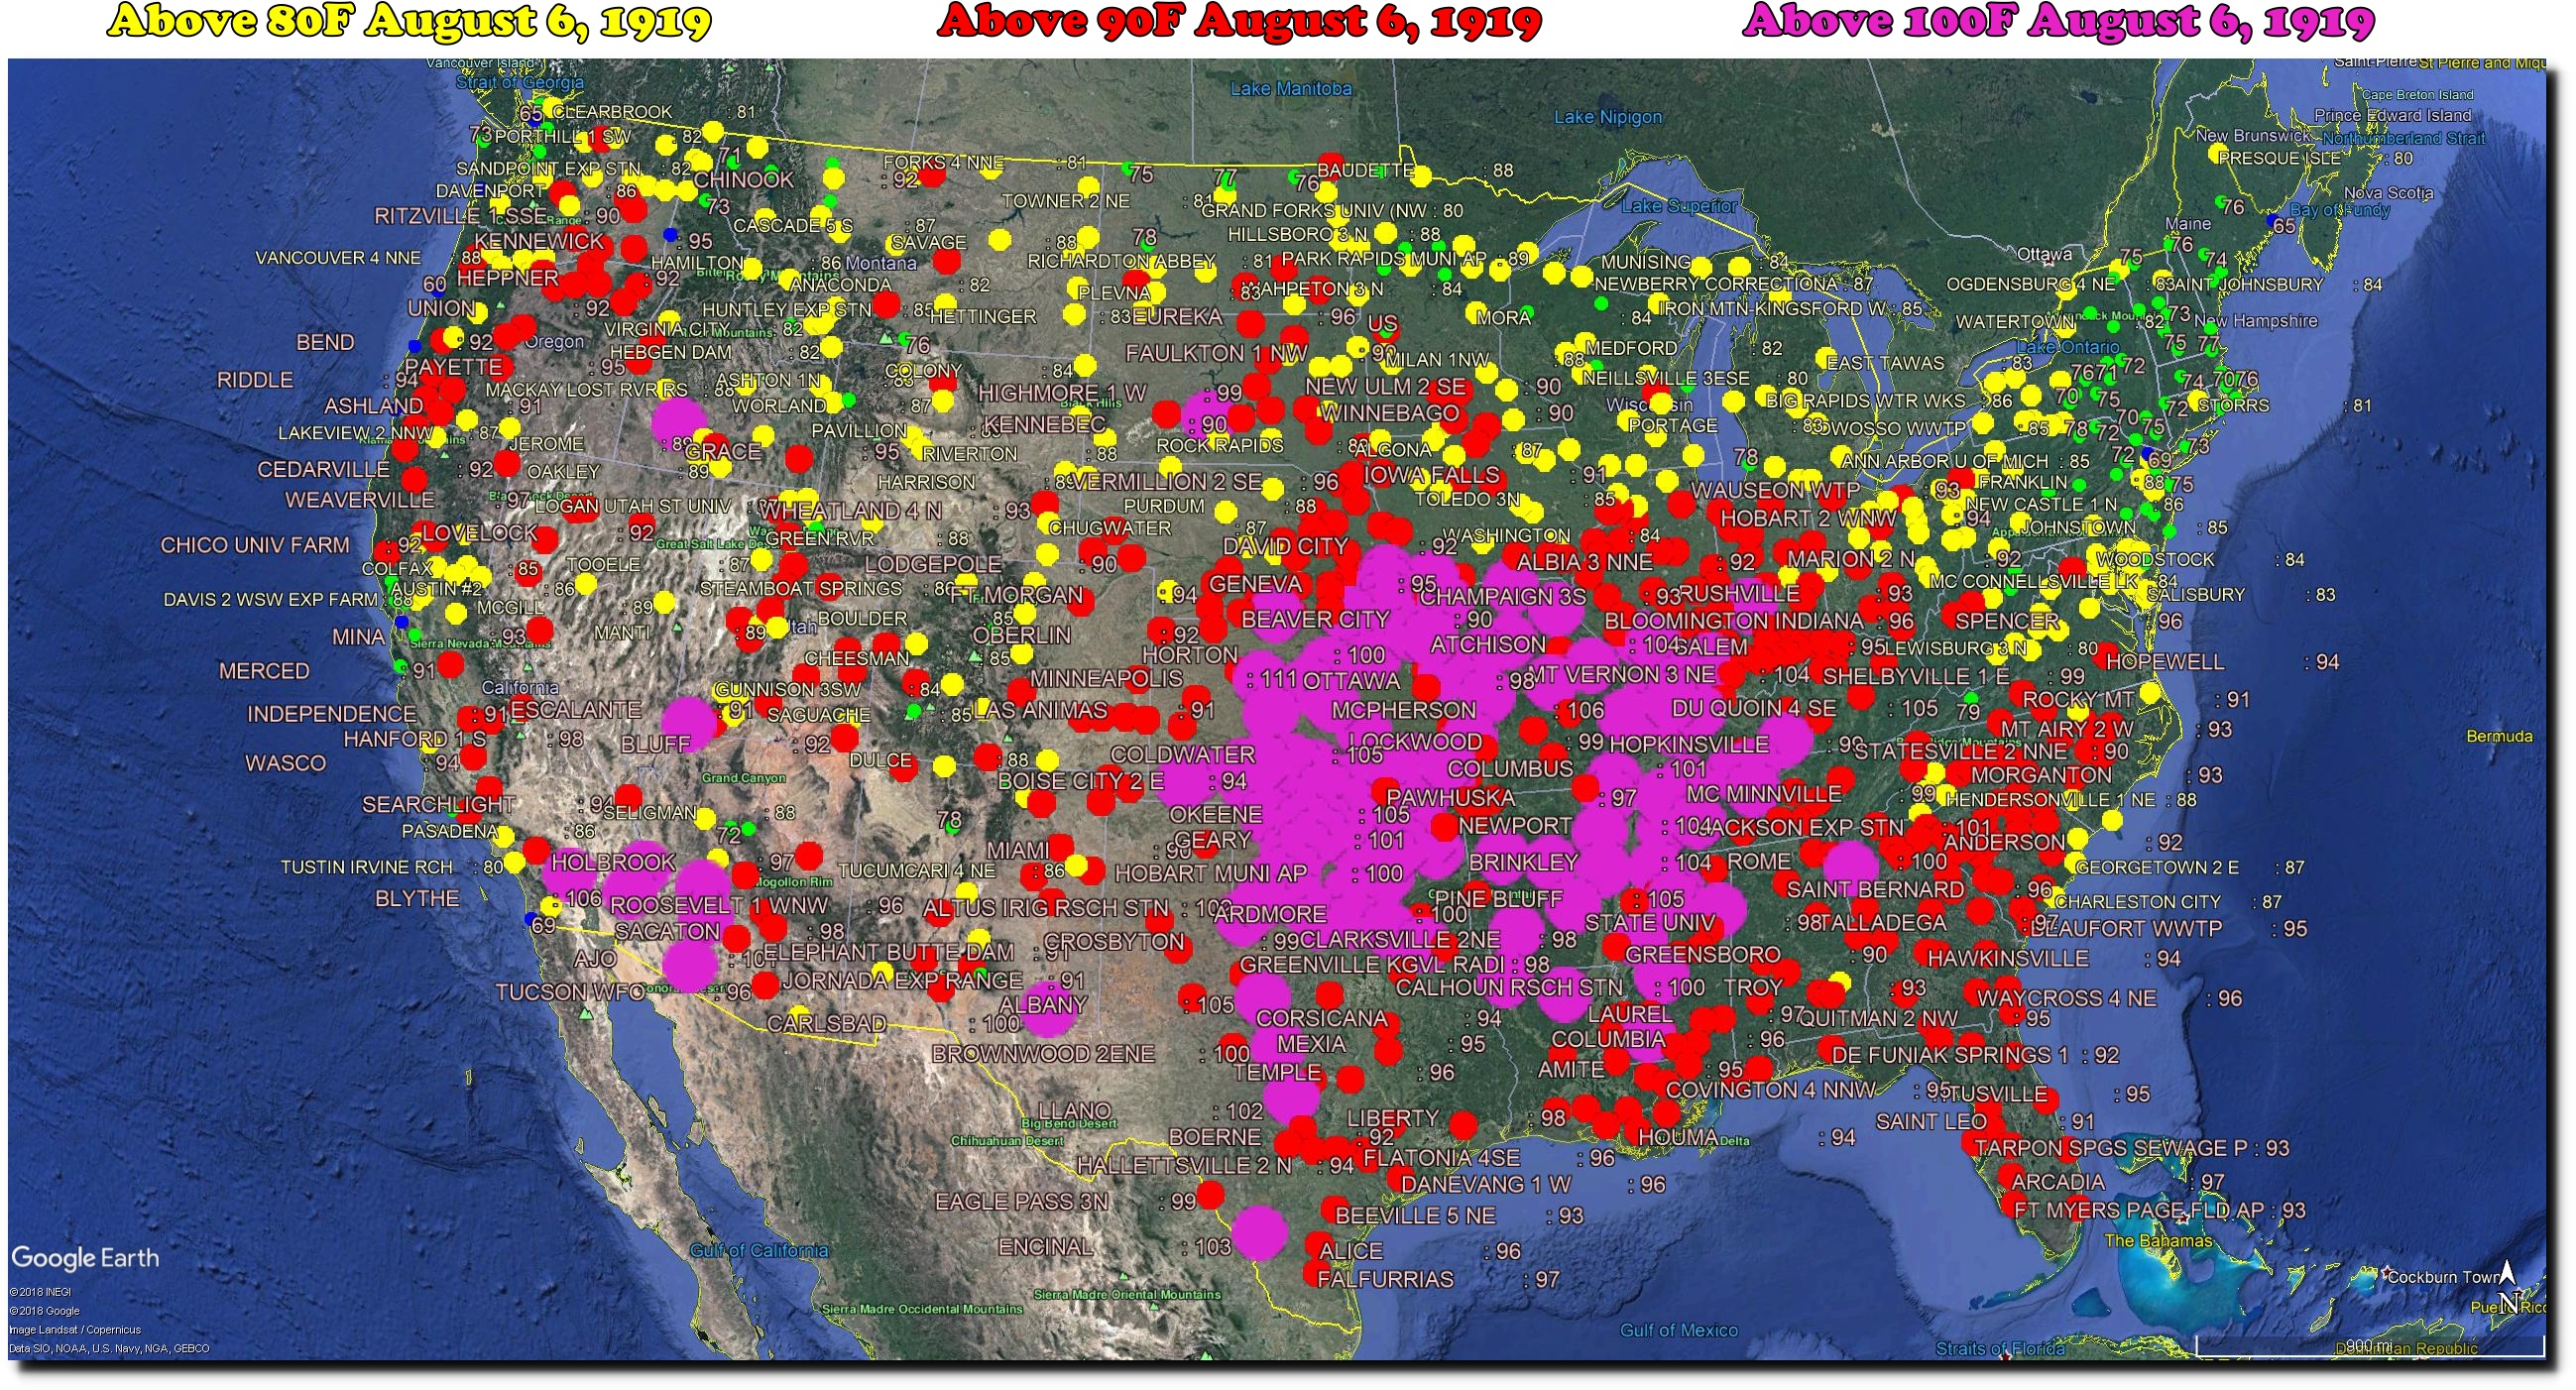
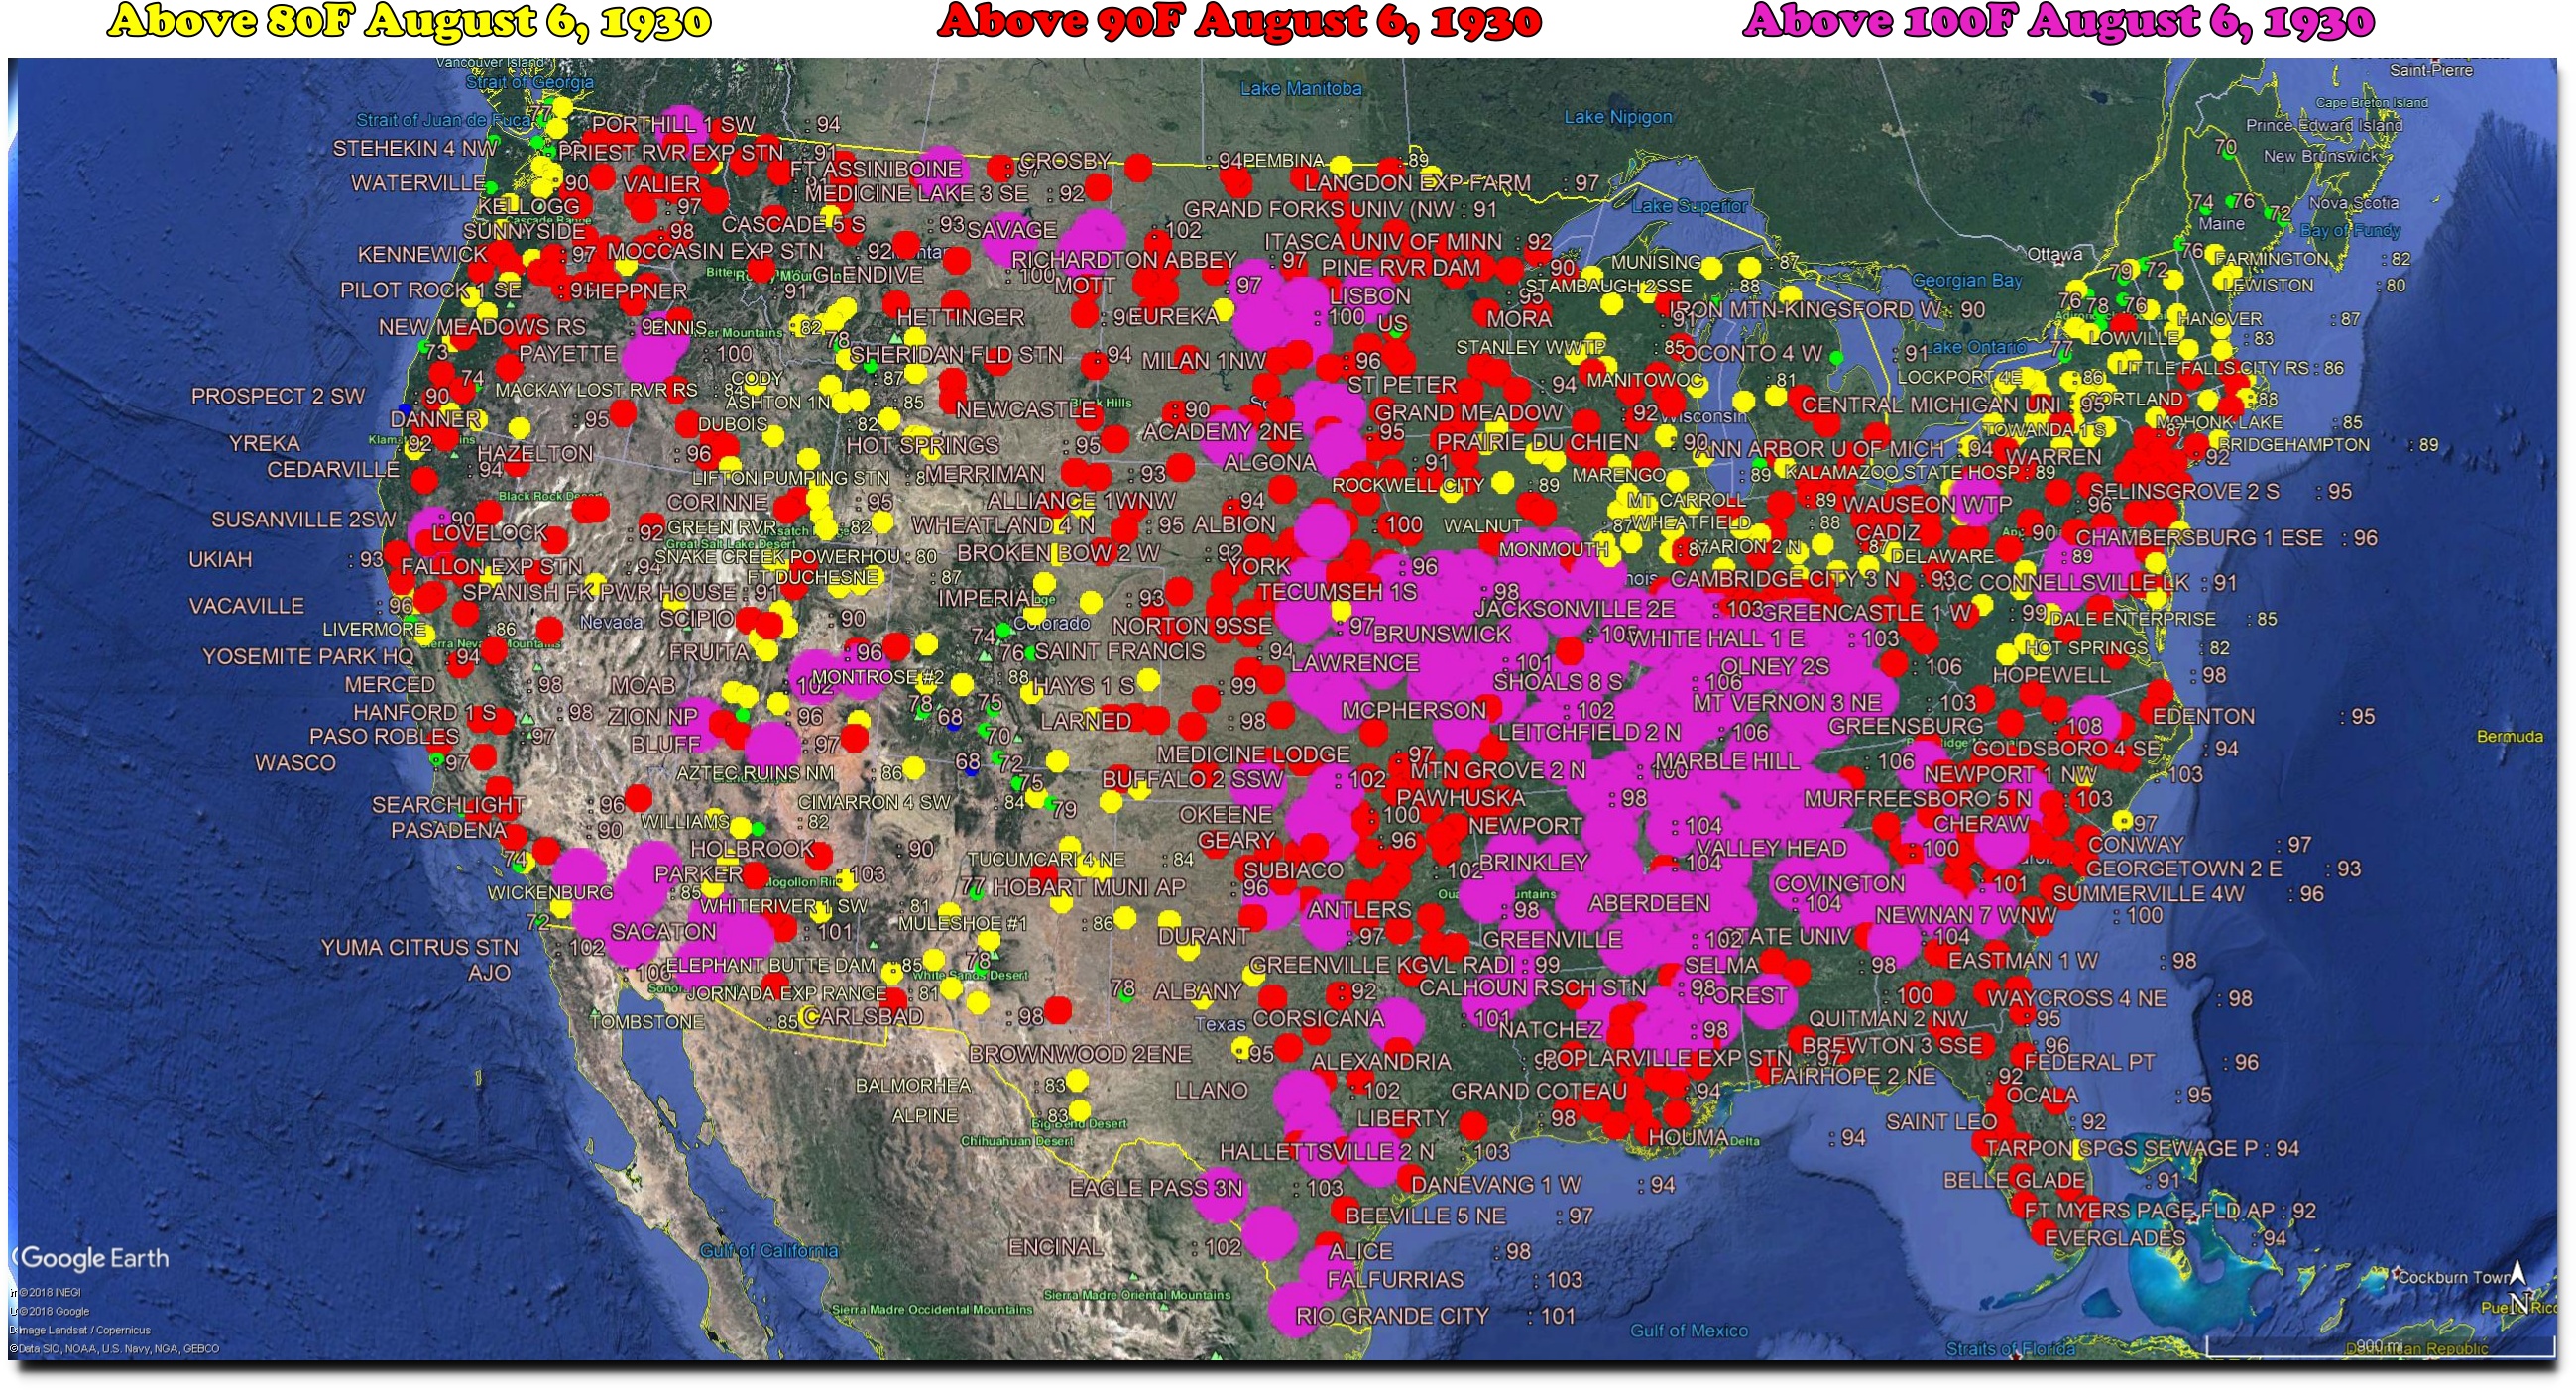
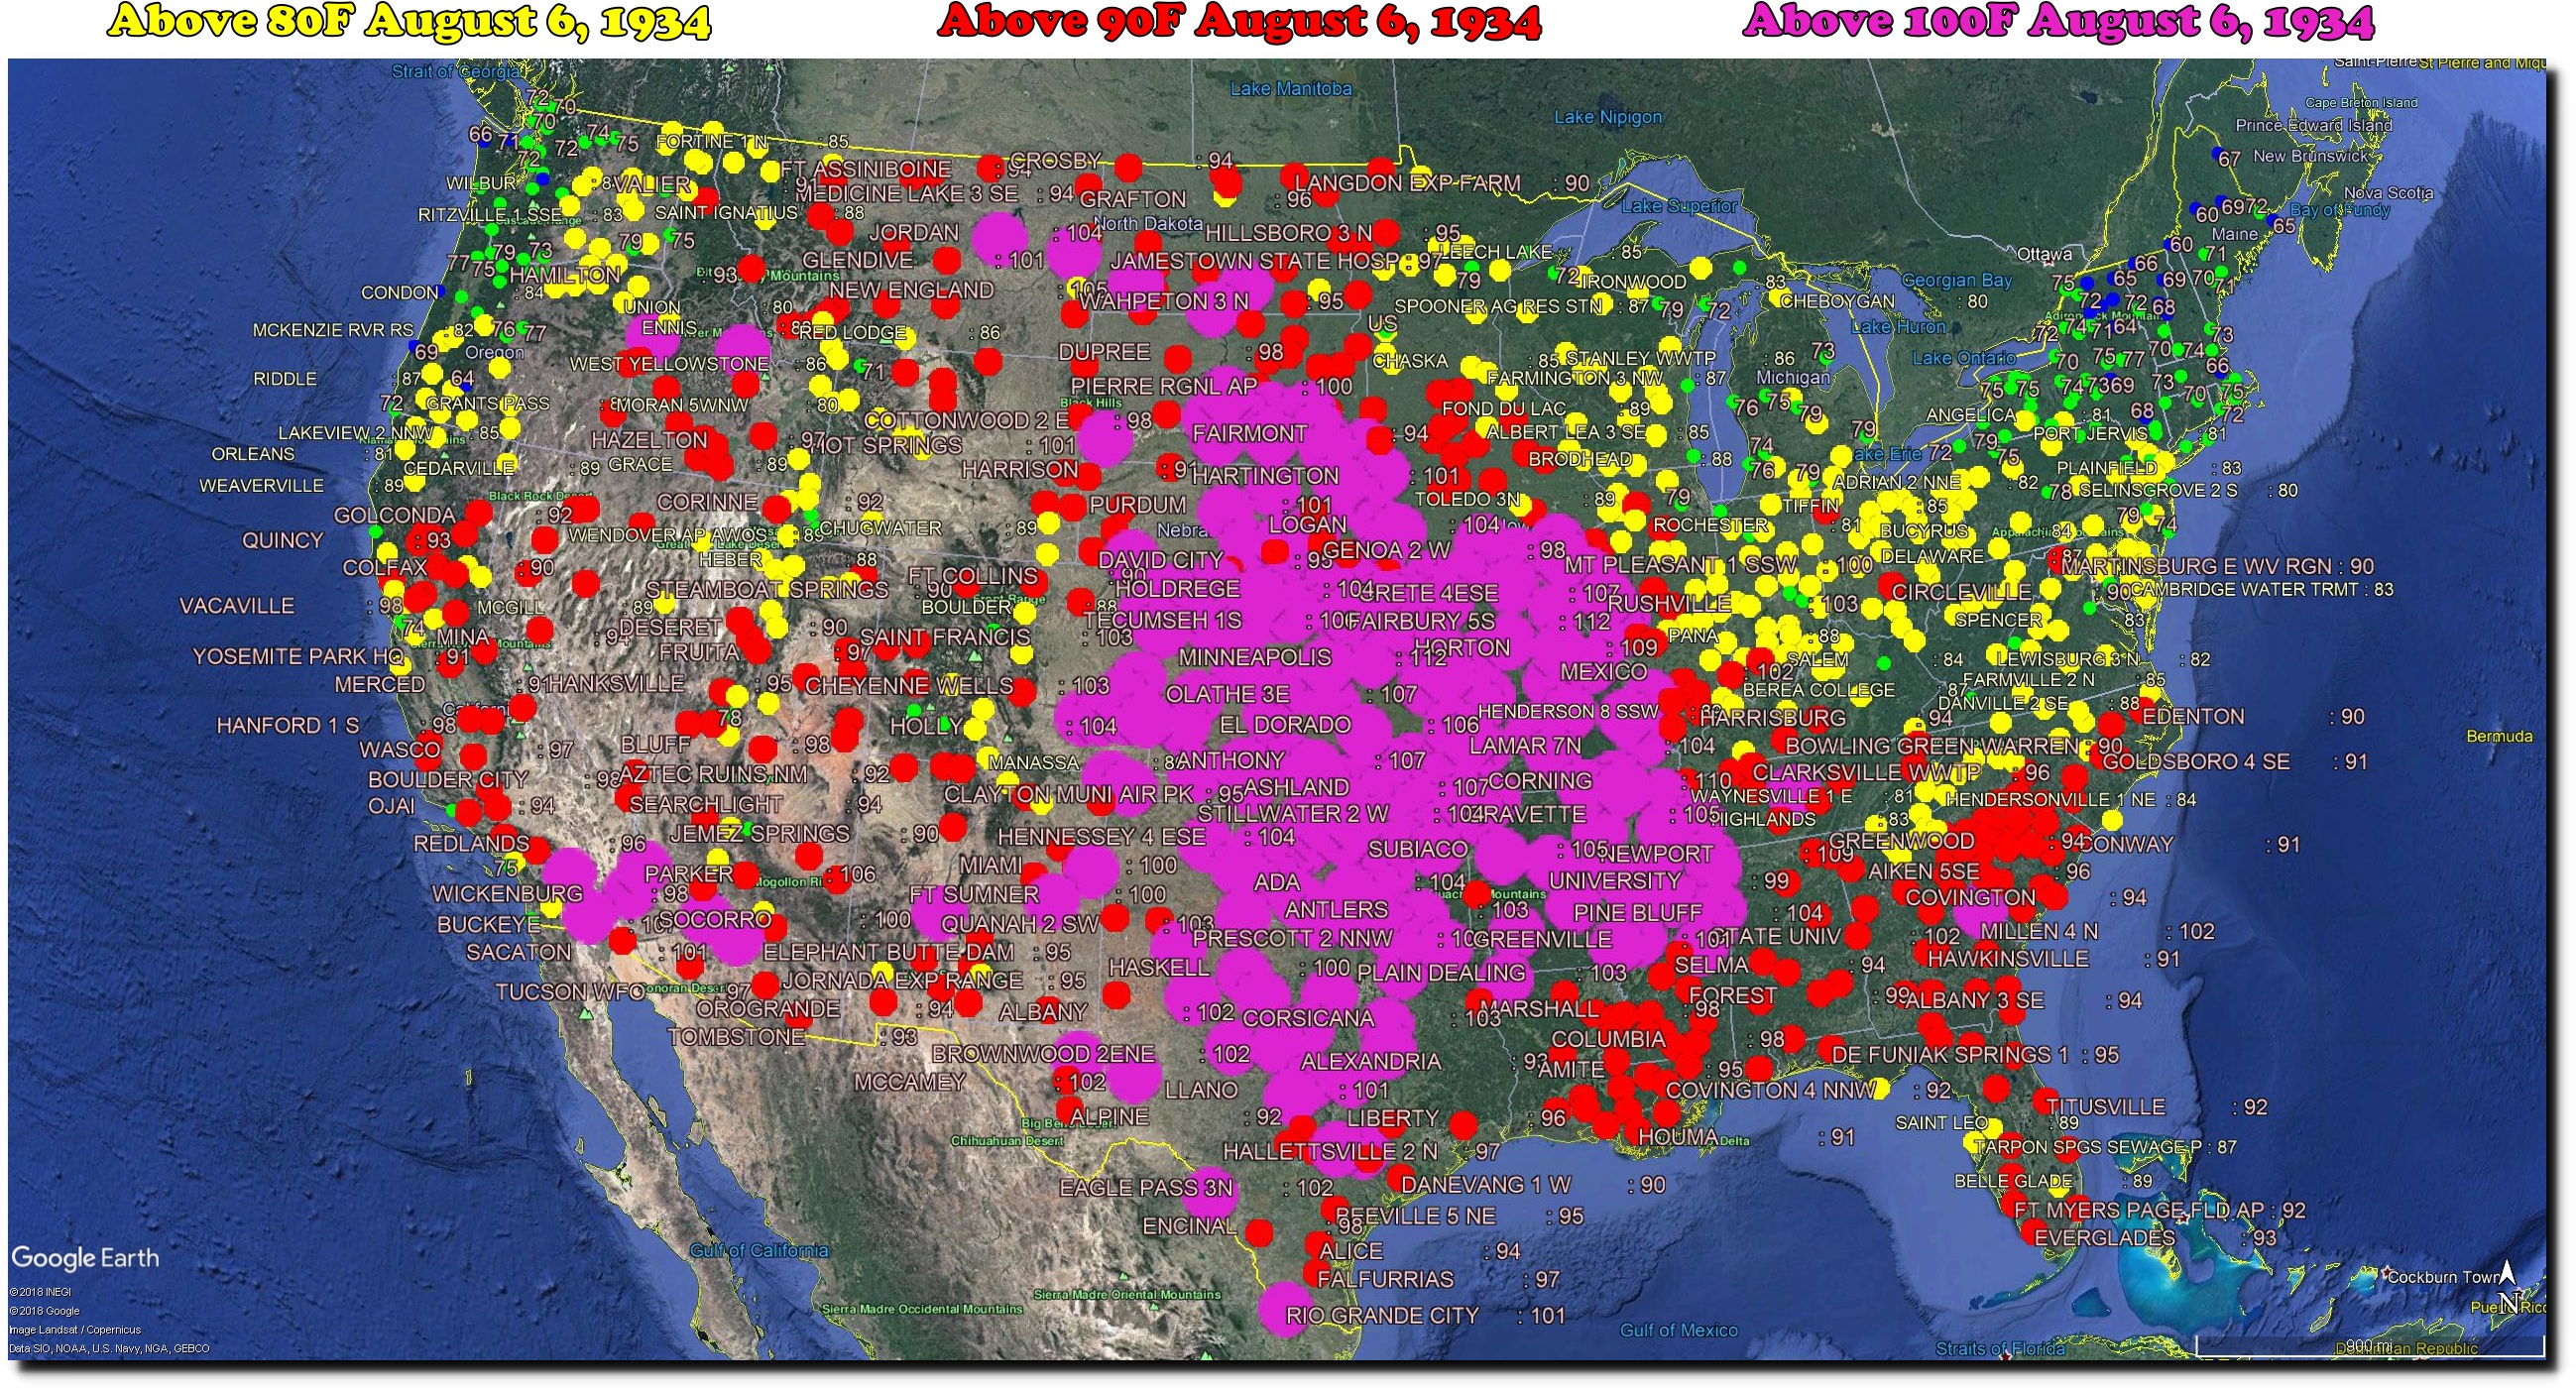
On August 6, 1947 – forty-three states were over 90 degrees.
Paris was very hot that summer too.

Posted in Uncategorized
Leave a comment
NASA – World Began In 1979
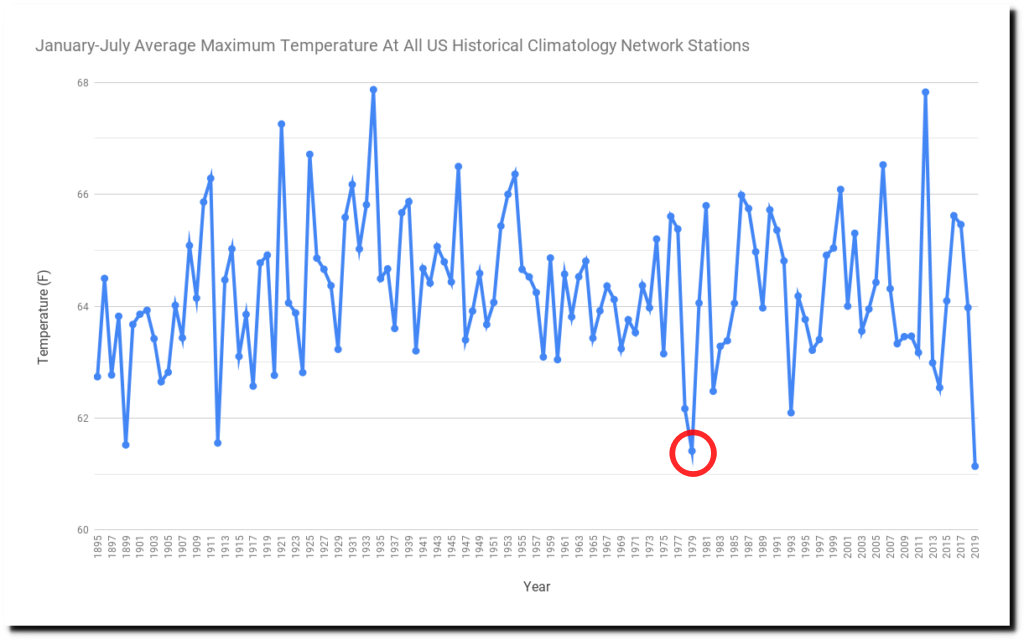
NASA likes to start their trends in 1979, during the second coolest January-July on record in the US. They have determined that CO2 emissions are making the fire sason longer.
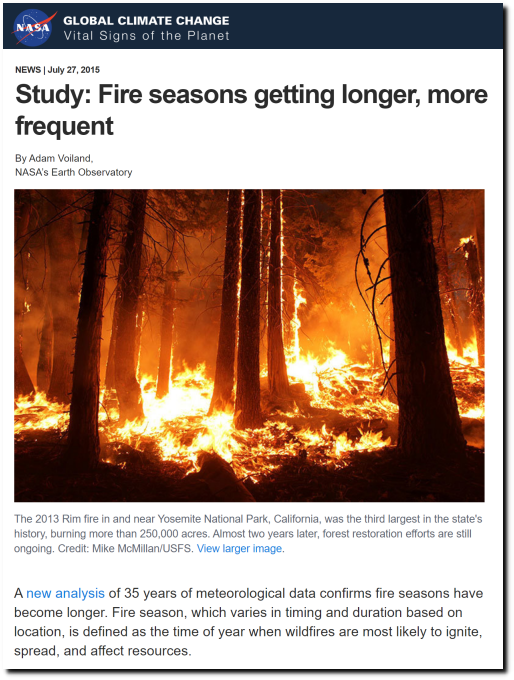
Study: Fire seasons getting longer, more frequent – Climate Change: Vital Signs of the Planet
Like in early May, 1884. When there were massive forest fires burning in the Midwest and eastern US.
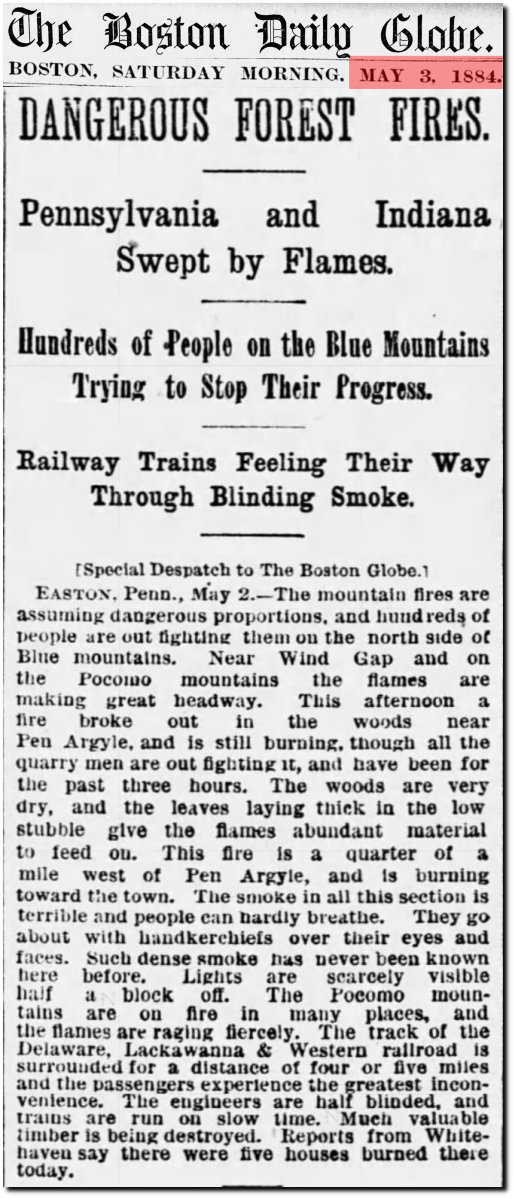
03 May 1884, 1 – The Boston Globe at Newspapers.com
Or in April, 1889 when there were forest fires burning all over Wisconsin.
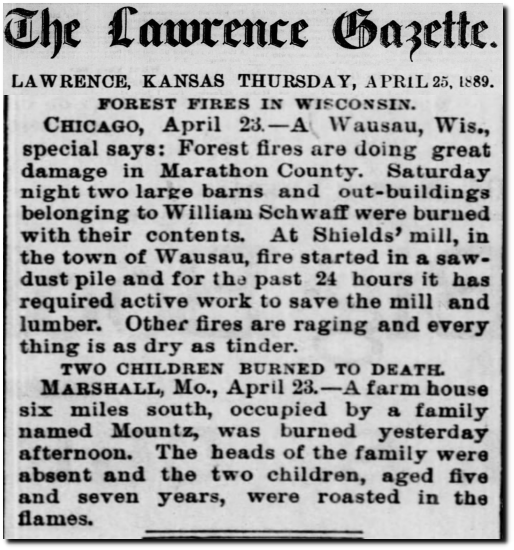
25 Apr 1889, Page 6 – The Lawrence Gazette at Newspapers.com
Or in April 1880 in New Jersey.
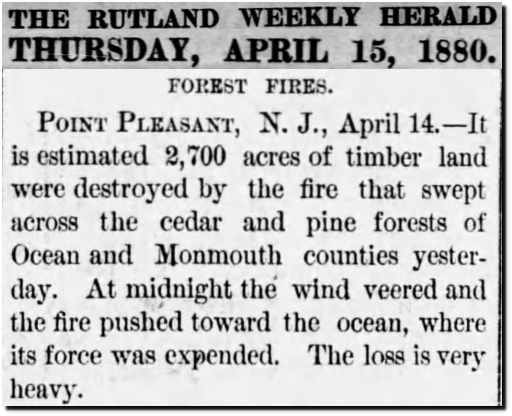
15 Apr 1880, 5 – The Rutland Weekly Herald and Globe at Newspapers.com
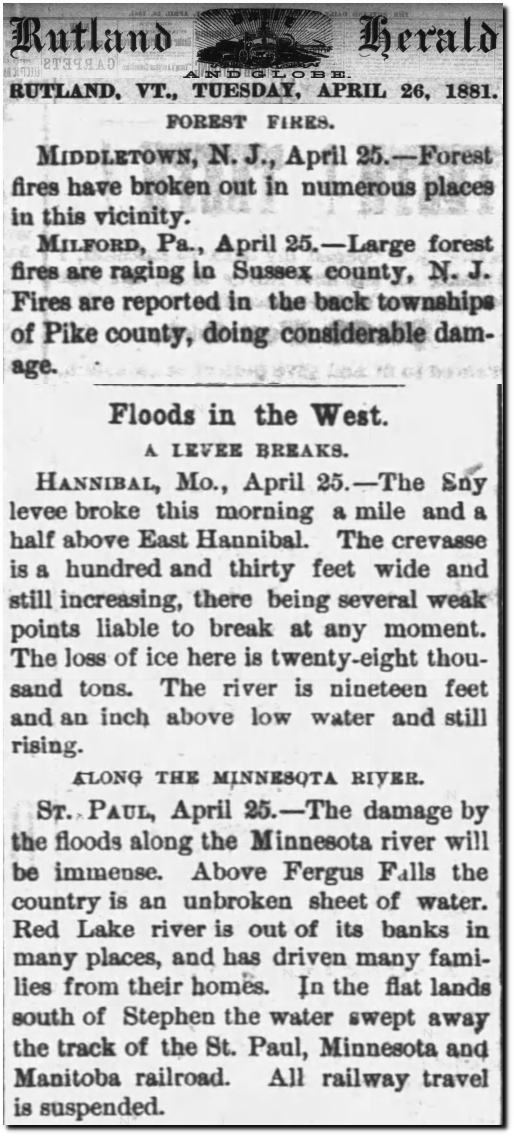
Or in 1881 in New Jersey.
Posted in Uncategorized
Leave a comment
New Video : Erasing America’s Hot Past
This video is a must watch for anyone wanting to understand the climate crisis scam.
Posted in Uncategorized
Leave a comment