


Disrupting the Borg is expensive and time consuming!

Google Search
-
Recent Posts
- One Atomic Bomb Per Hour
- New Video : Analyzing Oil And Gas
- Is Antarctica Melting?
- High Speed Analysis And Visualization
- El Nino To The Rescue?
- Fake News Update
- Growth Of Antarctic Sea Ice
- 65 Years Of Progress!
- El Nino To The Rescue?
- Worst March Drought On Record
- ChartGL Process Control Demo
- The Biggest Money Laundering Scam
- Drought In The Headwaters Of Lake Powell
- Unrealistic Expectations Of Water Availability
- Did Bill Gates Do This?
- Worst March Drought On Record In The US
- The Real Hockey Stick Graph
- Analyzing The Western Water Crisis
- Gaslighting 1924
- “Why Do You Resist?”
- Climate Attribution Model
- Fact Checking NASA
- Fact Checking Grok
- Fact Checking The New York Times
- New Visitech Features
July 2026 M T W T F S S 1 2 3 4 5 6 7 8 9 10 11 12 13 14 15 16 17 18 19 20 21 22 23 24 25 26 27 28 29 30 31 Recent Comments
- Bob G on One Atomic Bomb Per Hour
- Jack the Insider on One Atomic Bomb Per Hour
- arn on One Atomic Bomb Per Hour
- Bob G on One Atomic Bomb Per Hour
- Bob G on One Atomic Bomb Per Hour
- Bob G on One Atomic Bomb Per Hour
- Hank Phillips on One Atomic Bomb Per Hour
- Hank Phillips on One Atomic Bomb Per Hour
- Bob G on One Atomic Bomb Per Hour
- Bob G on One Atomic Bomb Per Hour
Short Spring
We have eight inches of snow on the way Monday.


Two years ago we also had a big snowstorm on April 29
Posted in Uncategorized
Leave a comment
“That’s All We Know”
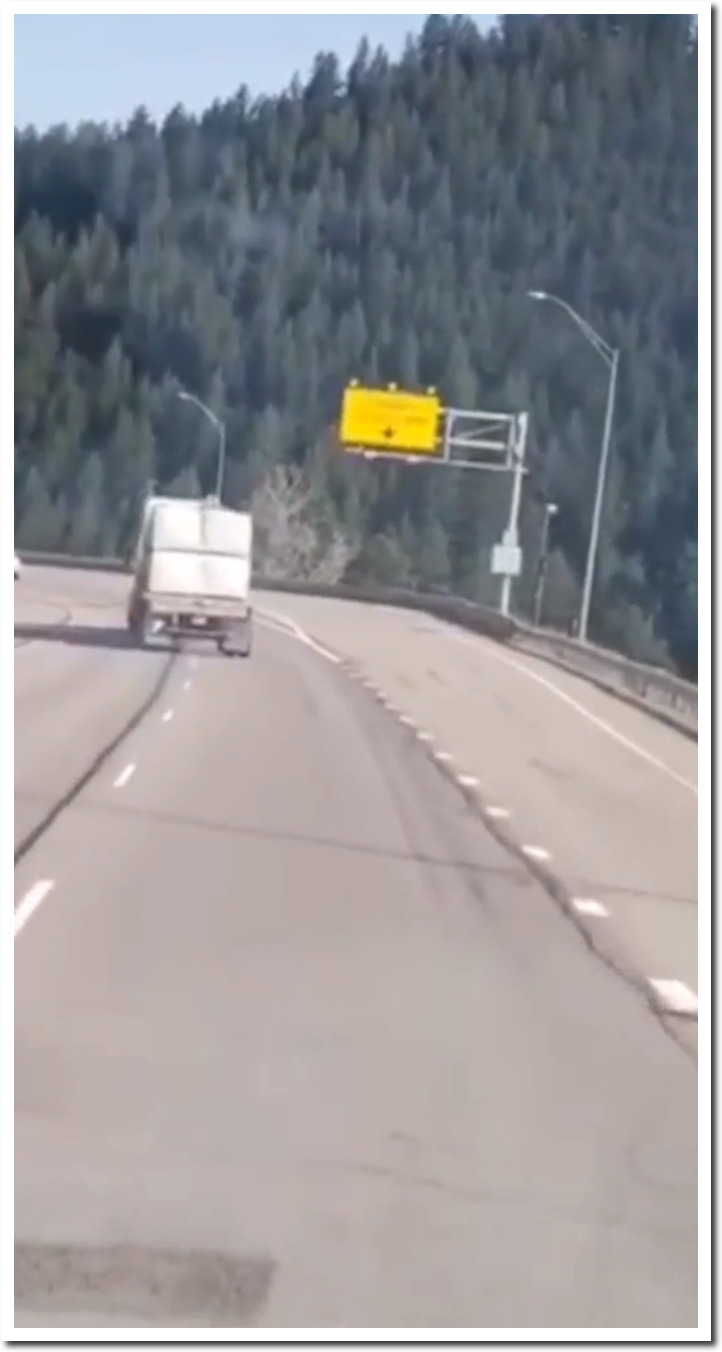
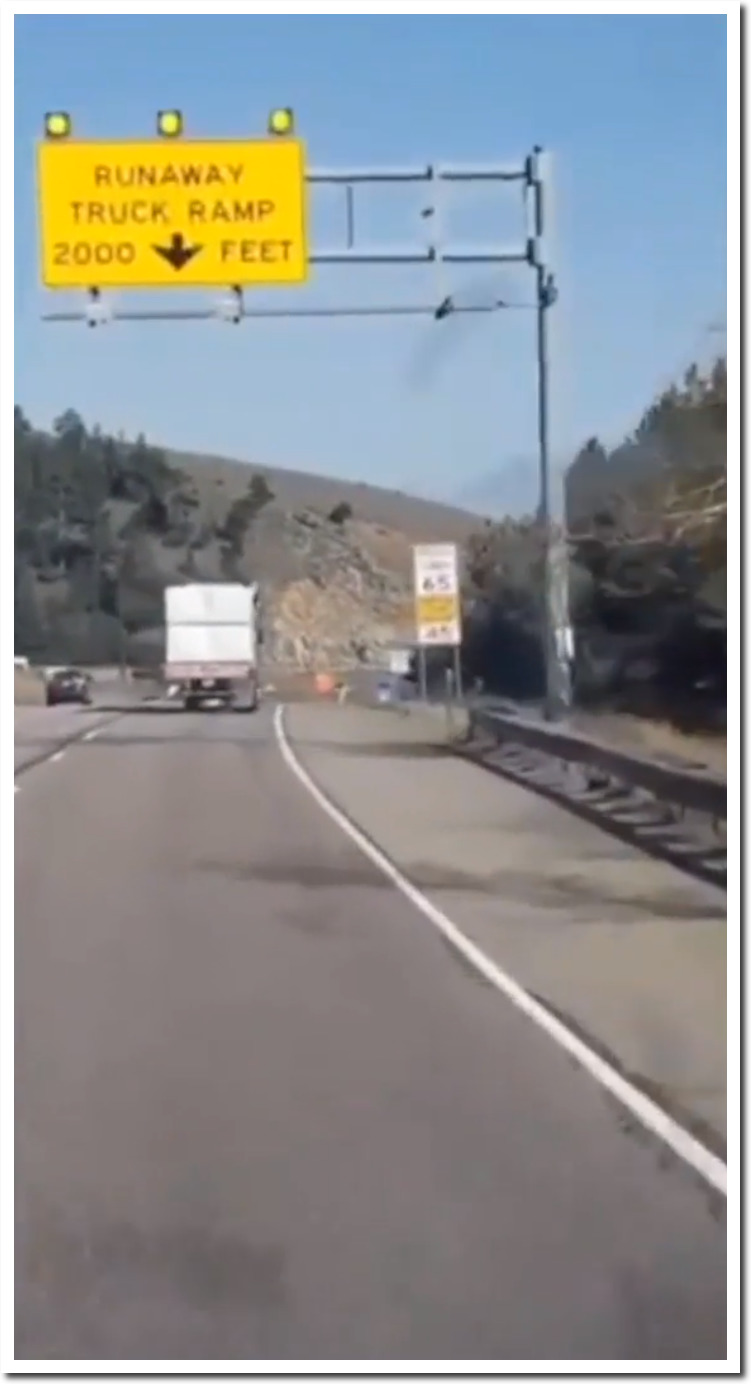
A semi coming down from the mountains on I-70 into Denver crashed into stopped cars and killed many people yesterday. Police say they don’t know what happened.
“We do know that I-70 eastbound traffic was at a standstill or close to a standstill because of a crash way out ahead of it,” he said at a news conference. “The semi was eastbound and ended up colliding with the … cars that were stopped because of the accident ahead. That’s all we know or we are releasing at this point.”

I-70 crash: Multiple people dead in a fiery wreck near Denver – CNN
Unfortunate that the police don’t have access to YouTube. Otherwise they would have known that the truck was driving at a high rate of speed on the shoulder.
Somebody did something.
Posted in Uncategorized
Leave a comment
Day Two At The Greenland Open
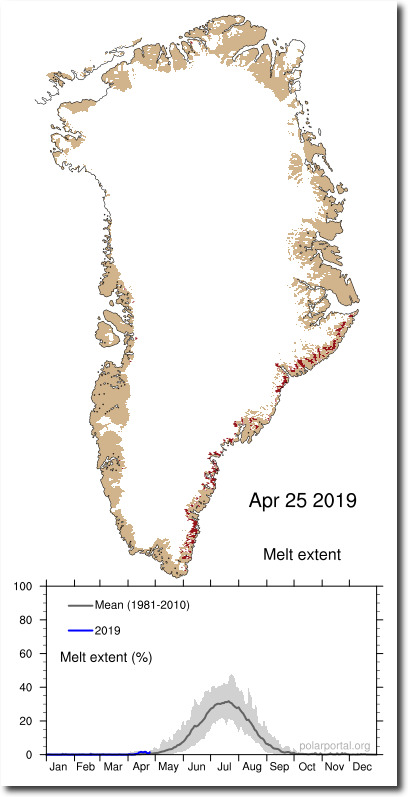
After receiving 100 billion tons of snow this month, the Greenland Open is having a beautiful day today – with temperatures up to a balmy -18C.
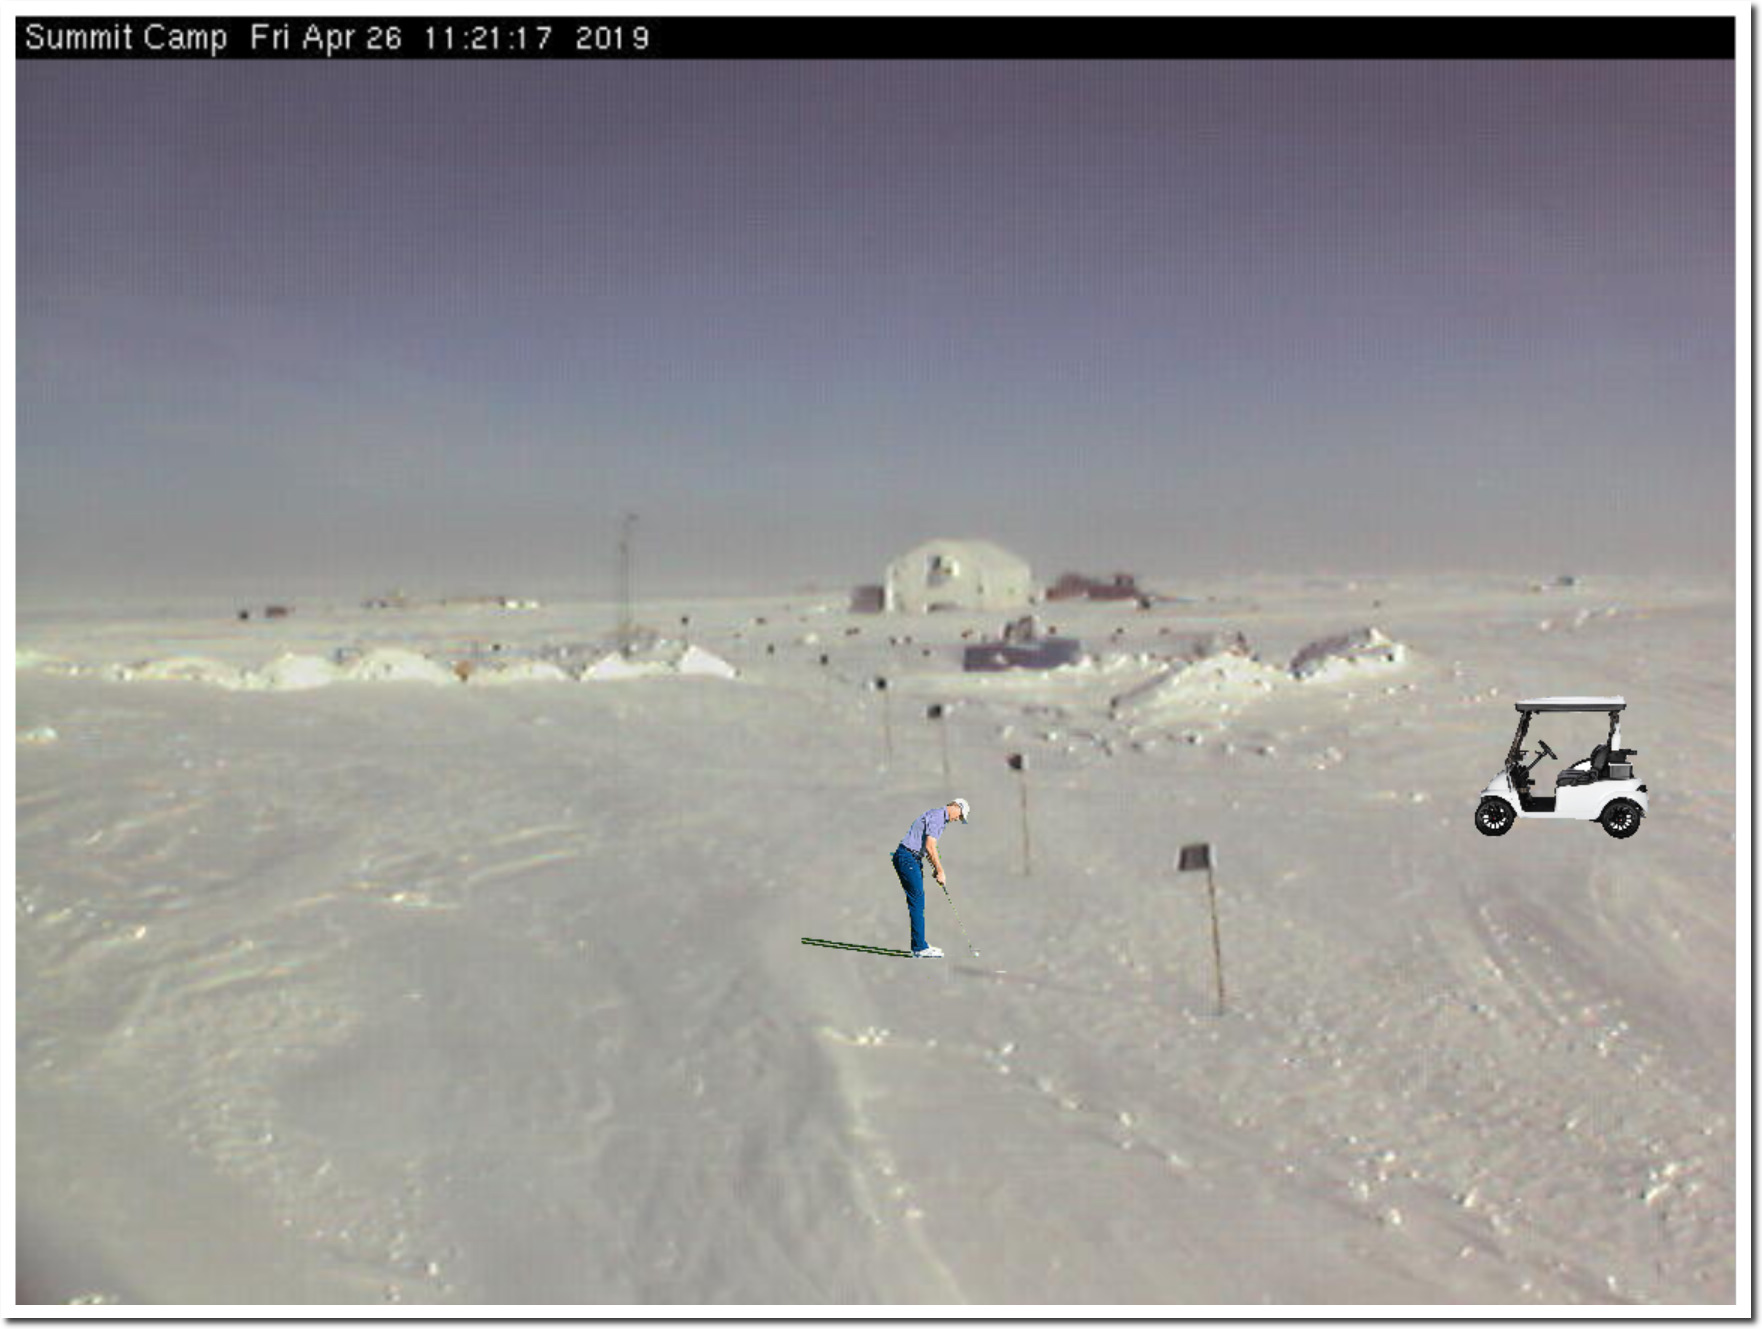
Greenland’s surface has not loss mass on any day since September 1 of last year, and has gained nearly 500 billion tons of ice.
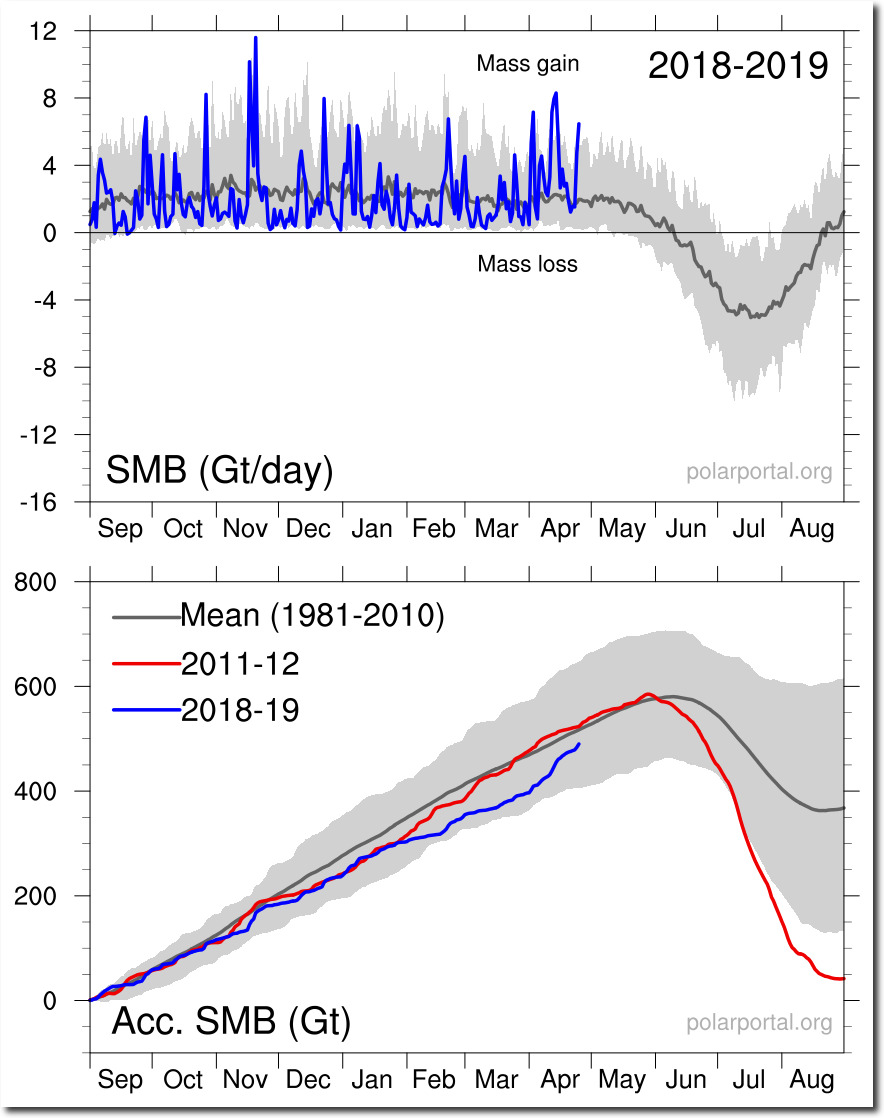
SMB_curves_LA_EN_20190425.png (846×1080)
US Experts say Greenland is baking has been experiencing unusual melting this month.
Greenland is baking, too. In fact, its summer melt season has already begun — more than a month ahead of schedule.
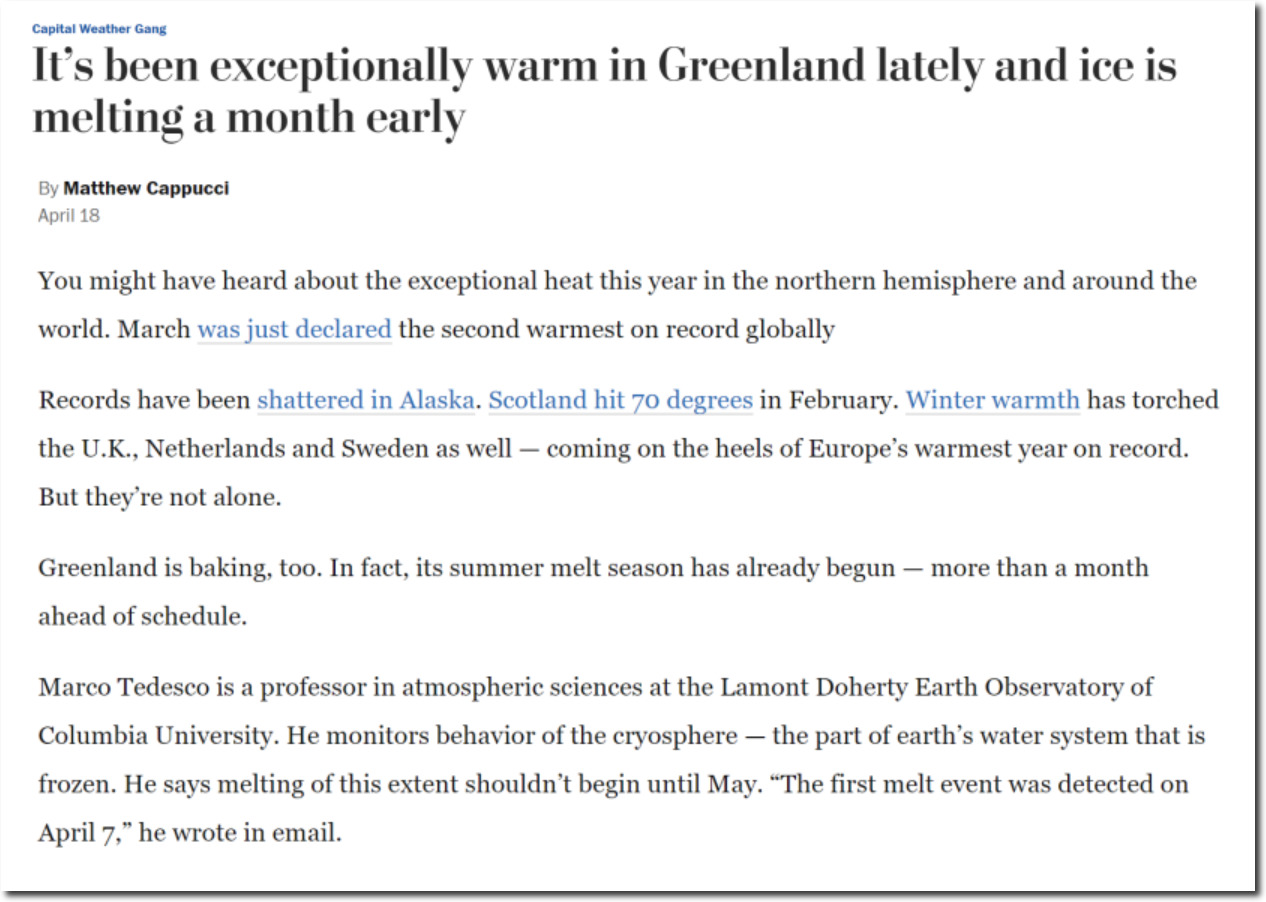
Data from the Danish Meteorological Institute doesn’t back up their claims, but the Danes will be sorry about their denial when the world ends in eleven years and eight months.
Posted in Uncategorized
Leave a comment
A Man Of High Ethics
Experts say Robert Mueller is a man of high ethical standards.

Posted in Uncategorized
Leave a comment
Adjusting Good Data To Make It Match Bad Data
On election day in 2016, both satellite data sets (UAH and RSS) showed a 15 year long hiatus in global warming, and bore no resemblance to the warming trend being generated by NOAA and NASA. I captured this image in a November 16, 2016 blog post.
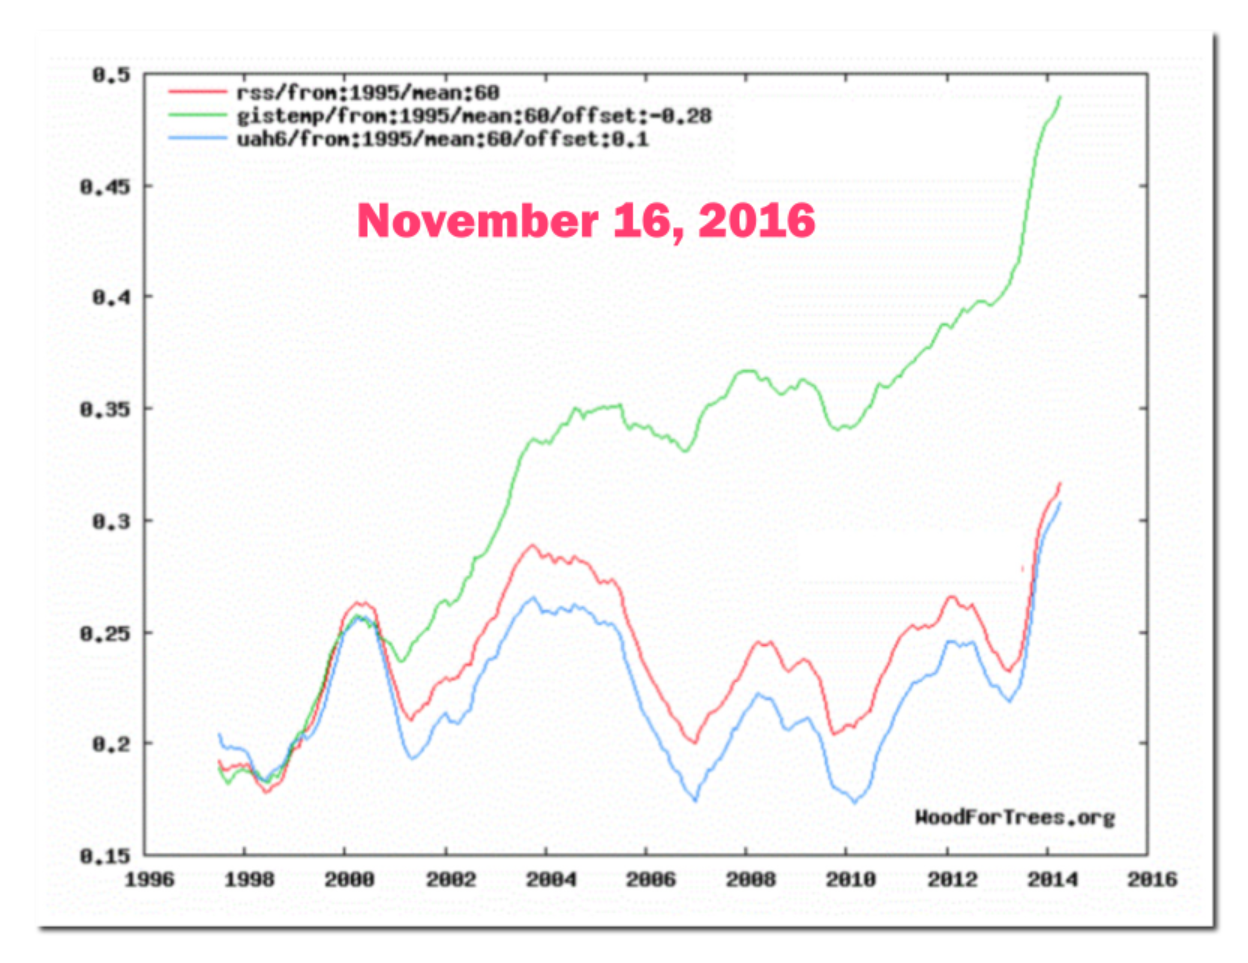
Gavin Schmidt Promises To Resign | The Deplorable Climate Science Blog
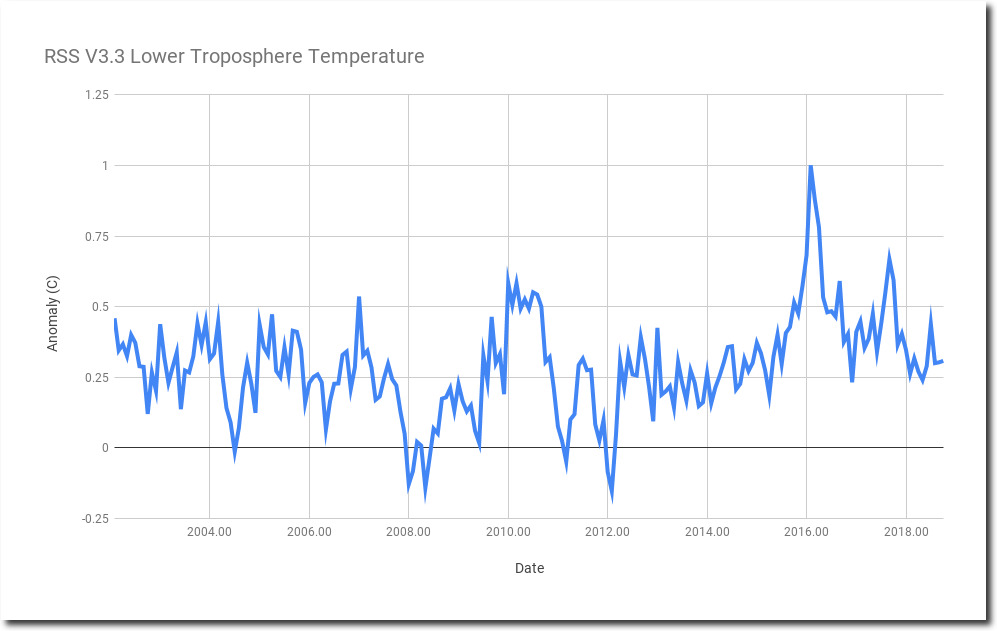
This is what the same graph looks like now.
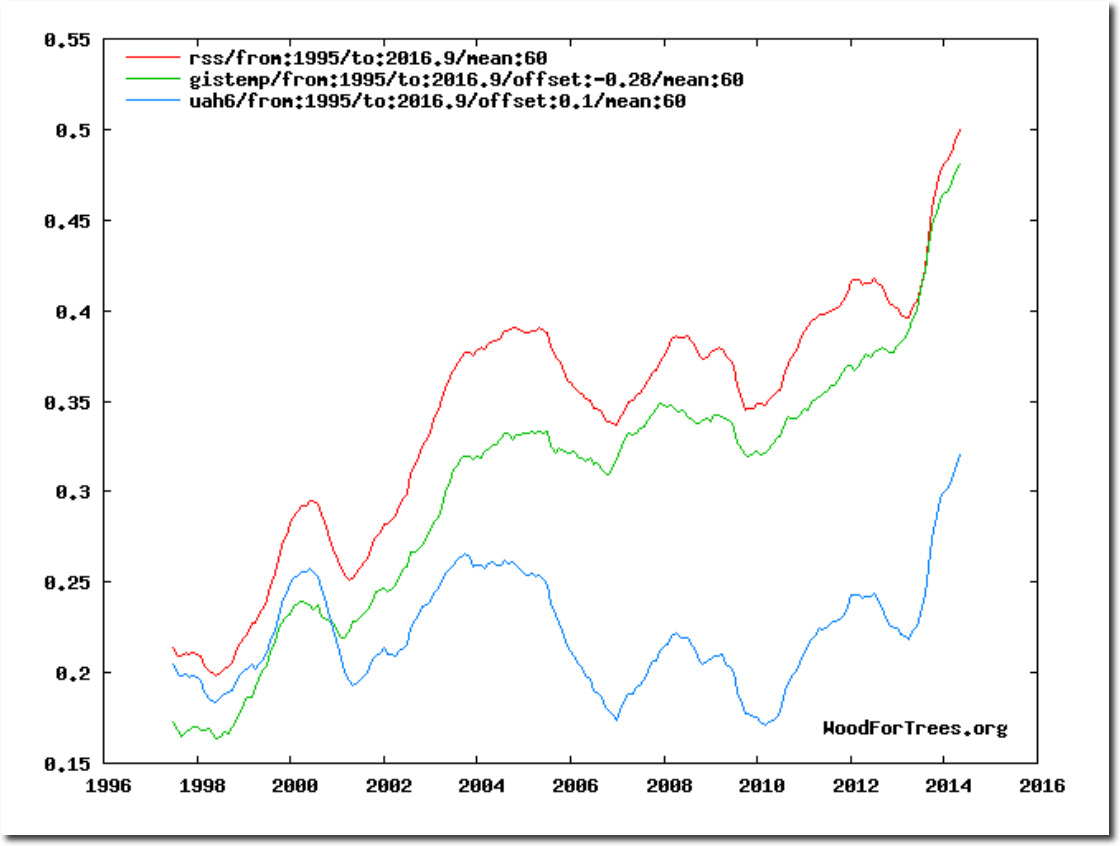
Wood for Trees: Interactive Graphs
In the next image, I overlaid the current RSS graph on the 2016 image. You can see how RSS was adjusted to match the NASA data.
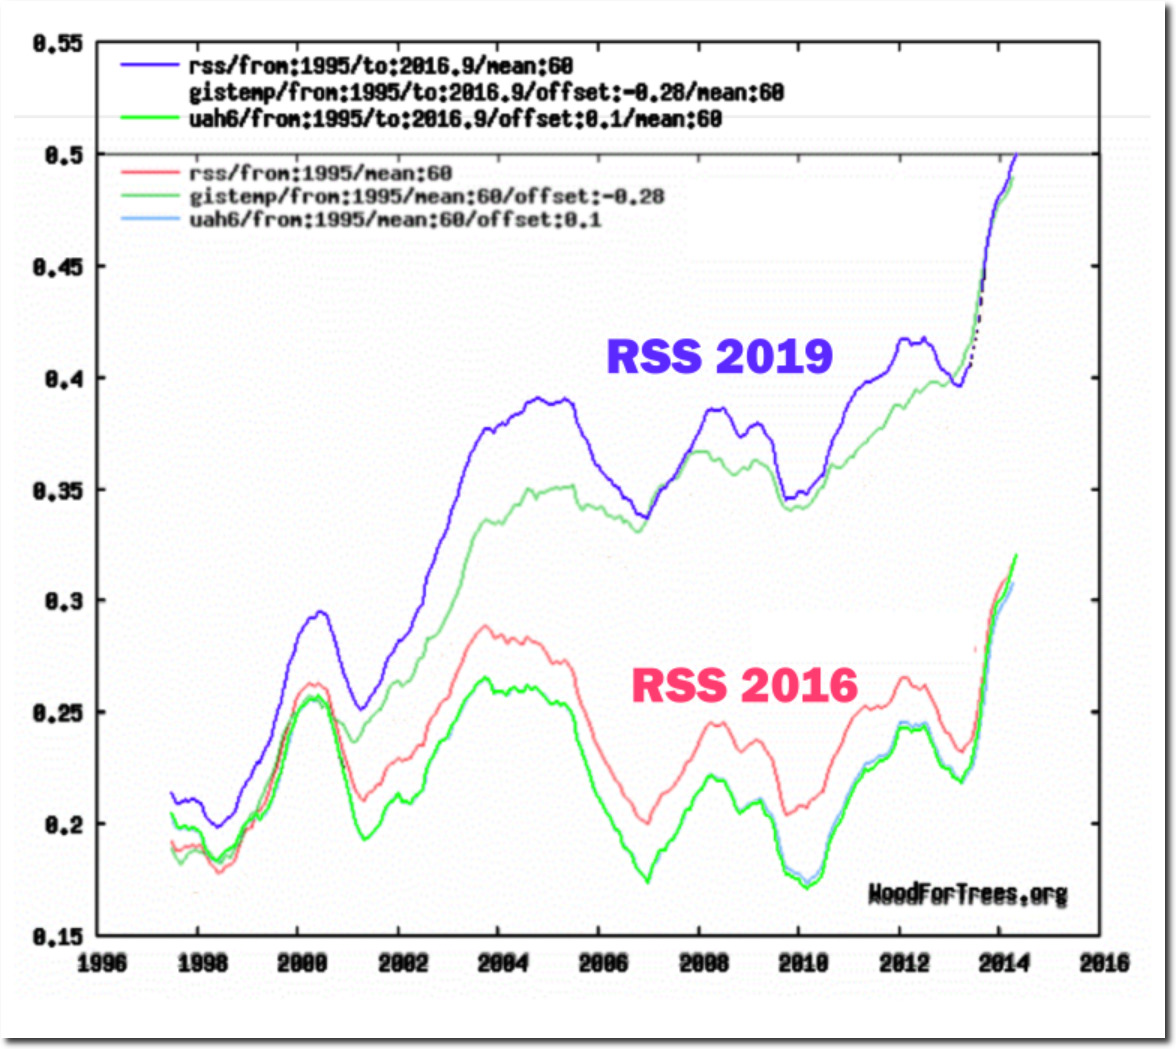
I predicted this would happen on March 27, 2015.
Look for the satellite data to be adjusted to bring it into compliance with the fully fraudulent surface temperatures. The Guardian is now working to discredit UAH, so it seems likely that RSS will soon be making big changes – to match the needs of the climate mafia. Bookmark this post.
Roy Spencer at UAH made the same prediction on January 9, 2017
“I expect there will soon be a revised TLT product from RSS which shows enhanced warming, too.
Here’s what I’m predicting:
1) neither John Christy nor I will be asked to review the paper
2) it will quickly sail through peer review (our UAH V6 paper is still not in print nearly 1 year after submission)
3) it will have many authors, including climate model people and the usual model pundits (e.g. Santer), which will supposedly lend legitimacy to the new data adjustments.
Let’s see how many of my 3 predictions come true.
-Roy”
Wood for Trees: Interactive Graphs
The reason I made this prediction was because Ted Cruz used an RSS graph in a Senate hearing in March of 2015. Carl Mears at RSS then came under intense pressure to make his data match the surface temperature data.
My particular dataset (RSS tropospheric temperatures from MSU/AMSU satellites) show less warming than would be expected when compared to the surface temperatures. All datasets contain errors. In this case, I would trust the surface data a little more because the difference between the long term trends in the various surface datasets (NOAA, NASA GISS, HADCRUT, Berkeley etc) are closer to each other than the long term trends from the different satellite datasets. This suggests that the satellite datasets contain more “structural uncertainty” than the surface dataset.
Ted Cruz says satellite data show the globe isn’t warming
You can see what Mears did to bring his data into compliance. This was his web page in November 2016.
Note that after 1998, the observations are likely to be below the simulated values, indicating that the simulation as a whole are predicting too much warming.
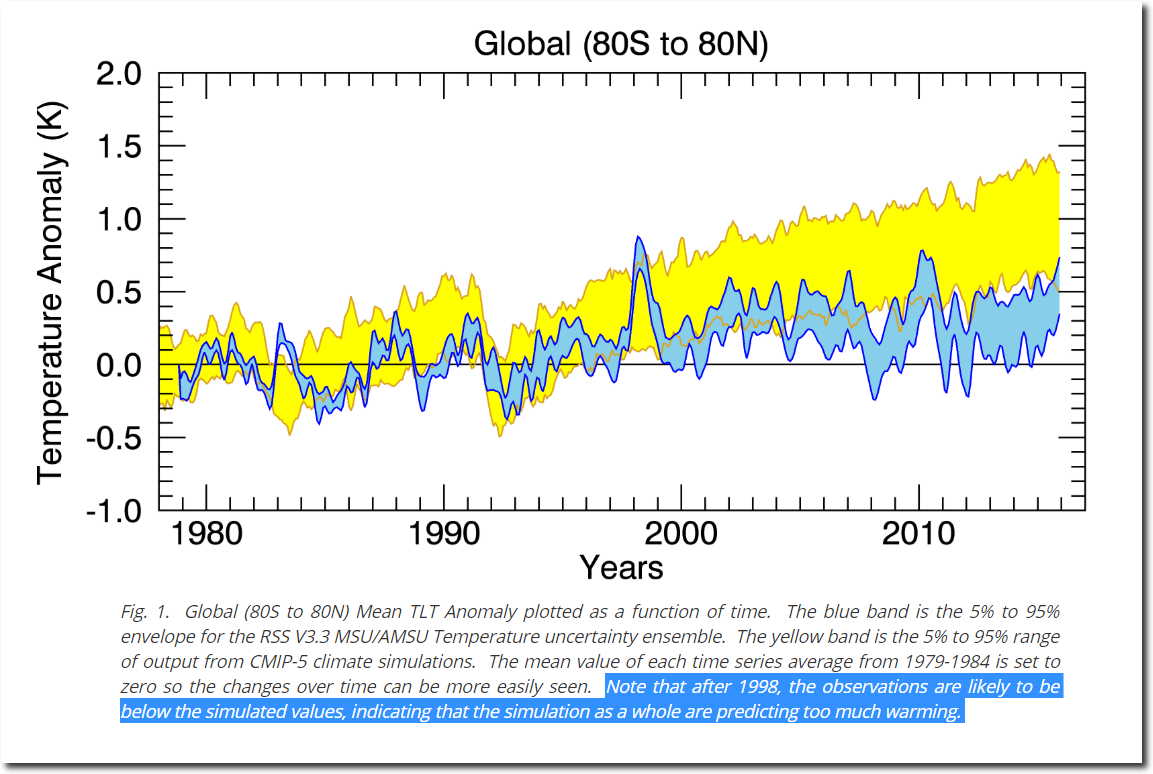
Climate Analysis | Remote Sensing Systems
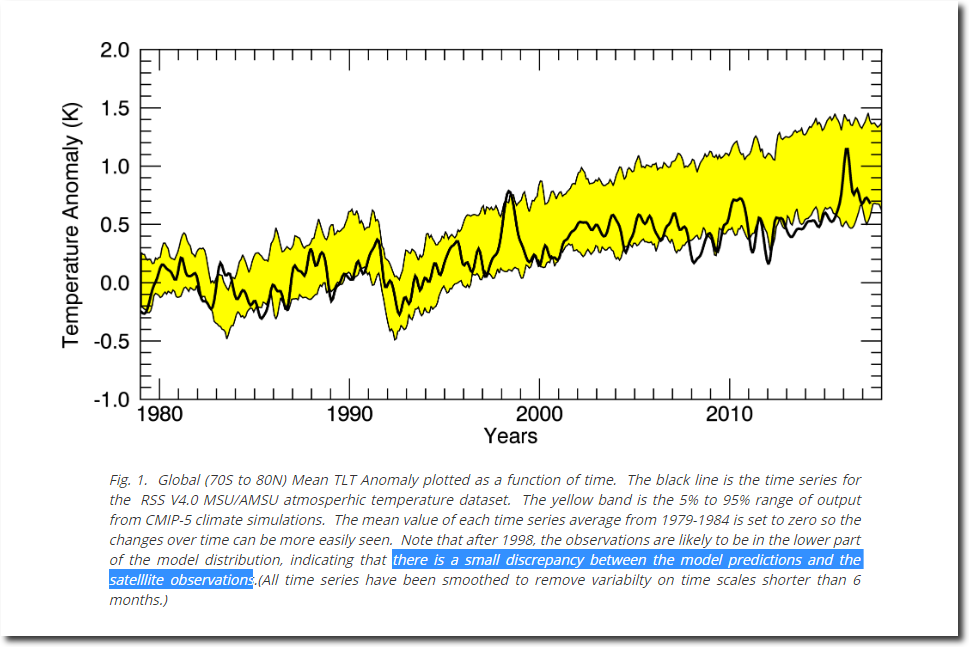
But under intense pressure, Mears altered his own data to bring it into compliance. The large discrepancy became a small discrepancy.
there is a small discrepancy between the model predictions and the satellite observations.
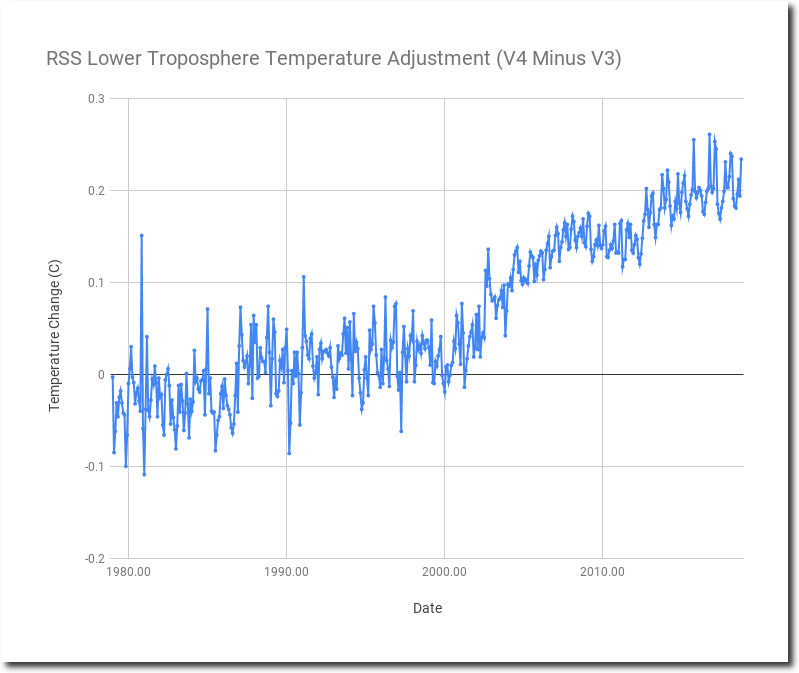
The image below overlays Mears’ old graph (V3) on his new one (V4.) It is clear what he did – he eliminated the blue error interval, and started using the high side of the interval as his temperature.
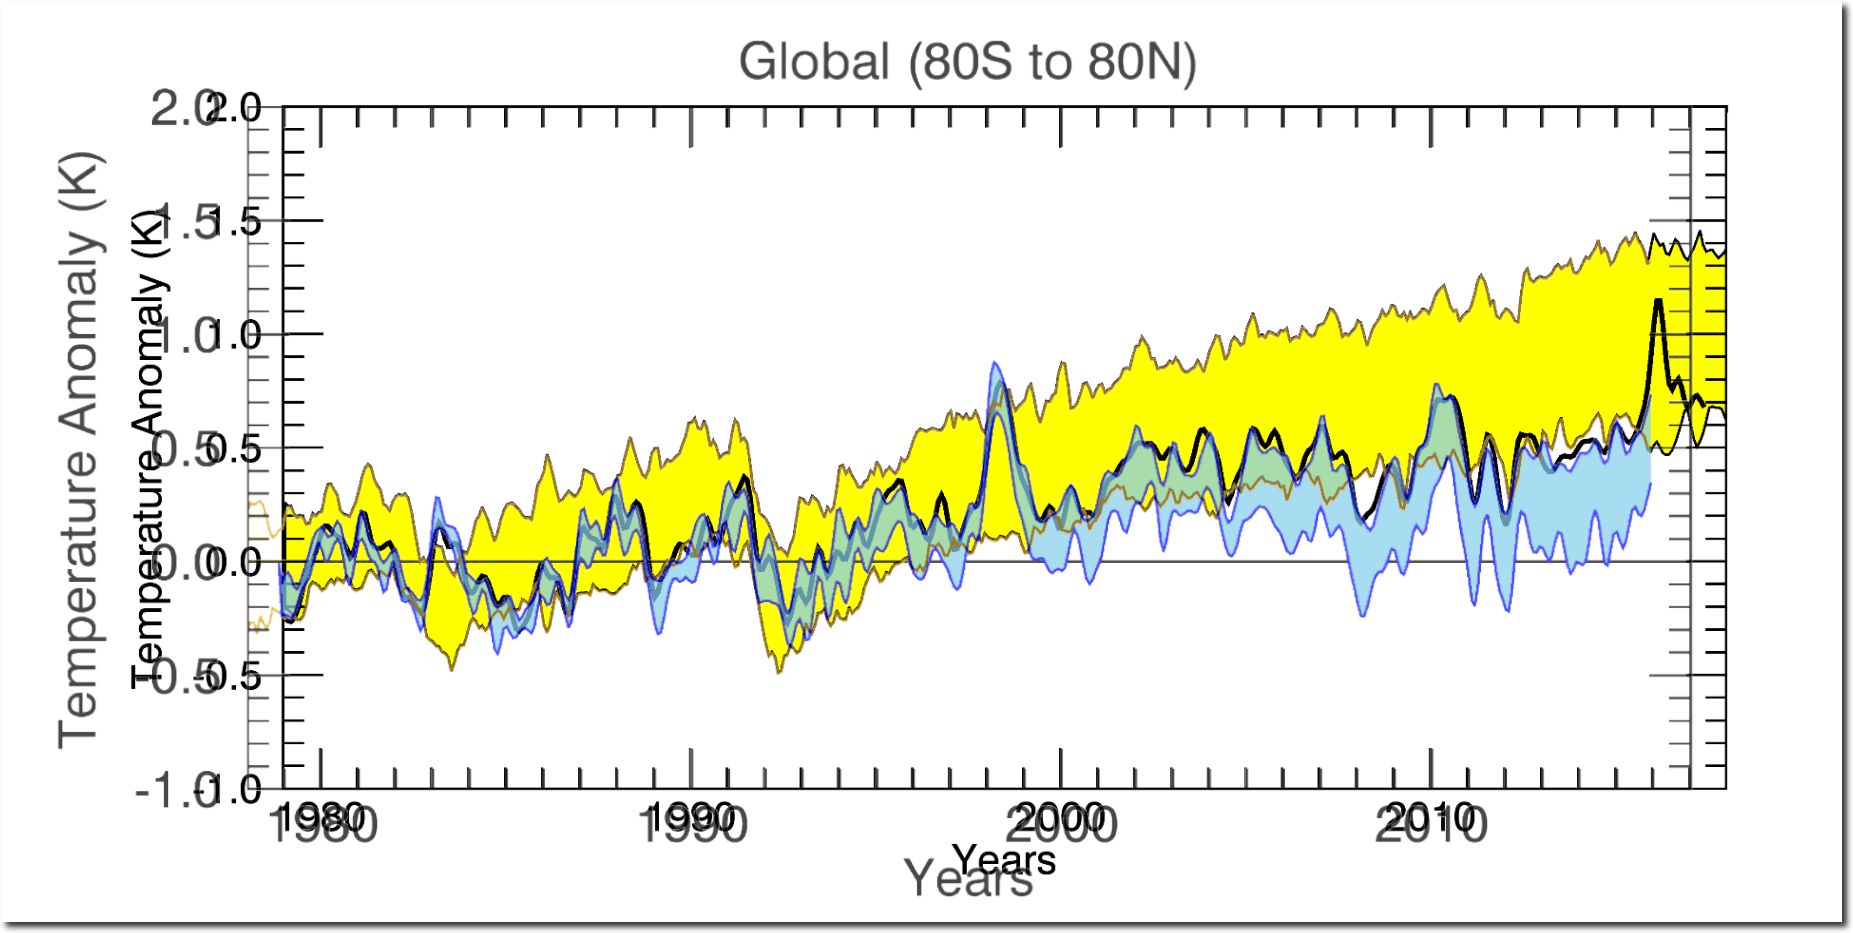
RSS V3 shows no warming since 2002.
The warming was all created by tampering with the data to eliminate the error interval.
The corruption is now complete. NASA has announced that new satellite data matches their surface temperature data. This was done to keep the President’s Commission on Climate Security from having accurate data to work with.
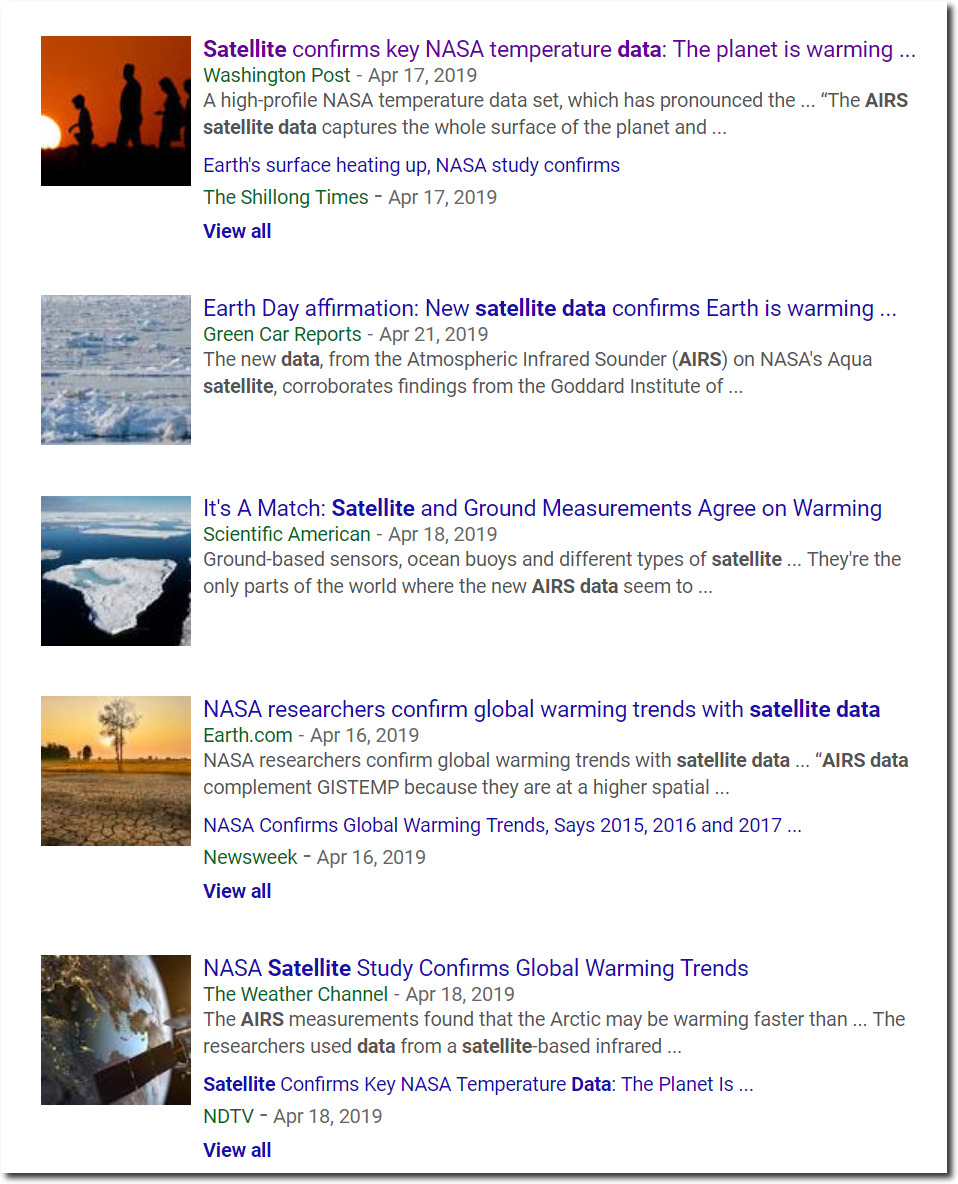
All government climate data goes through the same transition in support of global warming alarm. The past keeps getting cooler, and recent years keep getting warmer.
Government climate agencies appear to be using Orwell’s 1984 as Standard Operating Procedure.
Posted in Uncategorized
Leave a comment
Climate Change In 1909
Democrats tell us that terrorism is driven by climate change. This month in 1909, thirty-thousand Christians were killed in Turkey. Some people did something.
Posted in Uncategorized
Leave a comment
Dilbert Vs. Scott Adams
Steve Goddard on Twitter: “Dilbert disagrees with you, and I normally side with Dilbert.…
This Climategate e-mail shows unequivocally that scientists from different groups colluded to get the same result, and that result involved cooling the past – without any justification.

I don’t always dress up for Halloween, but when I do I go as Dilbert.

Posted in Uncategorized
Leave a comment