
The party of science now believes the Carboniferous Period is oil company propaganda.
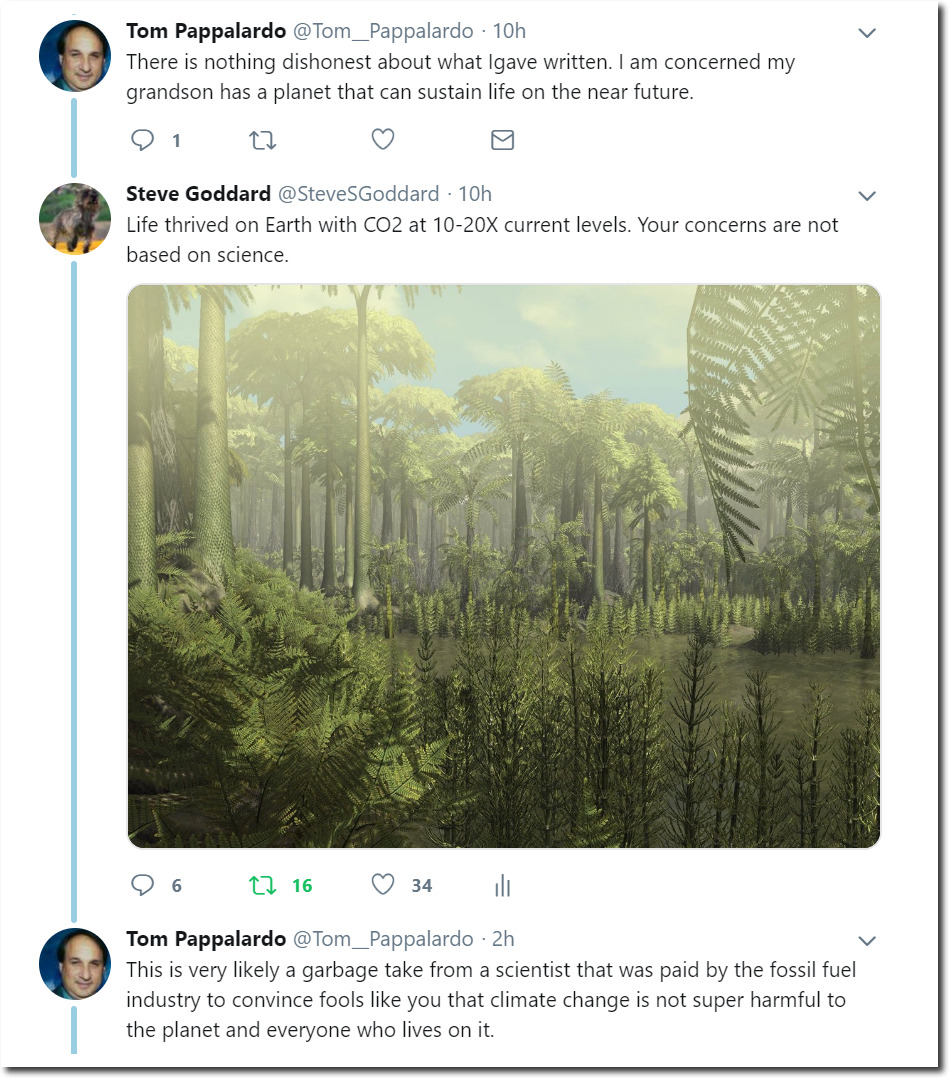
The party of science now believes the Carboniferous Period is oil company propaganda.
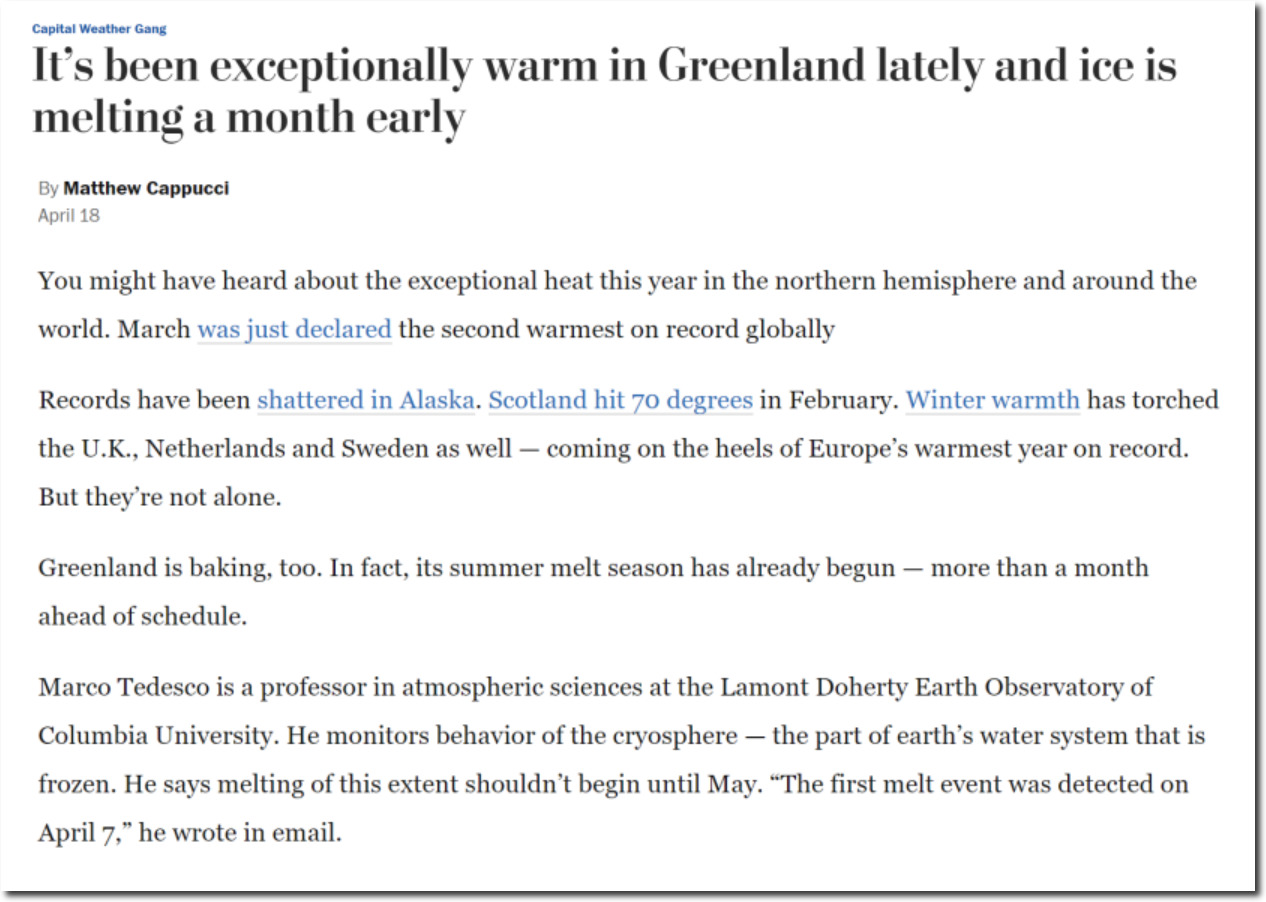
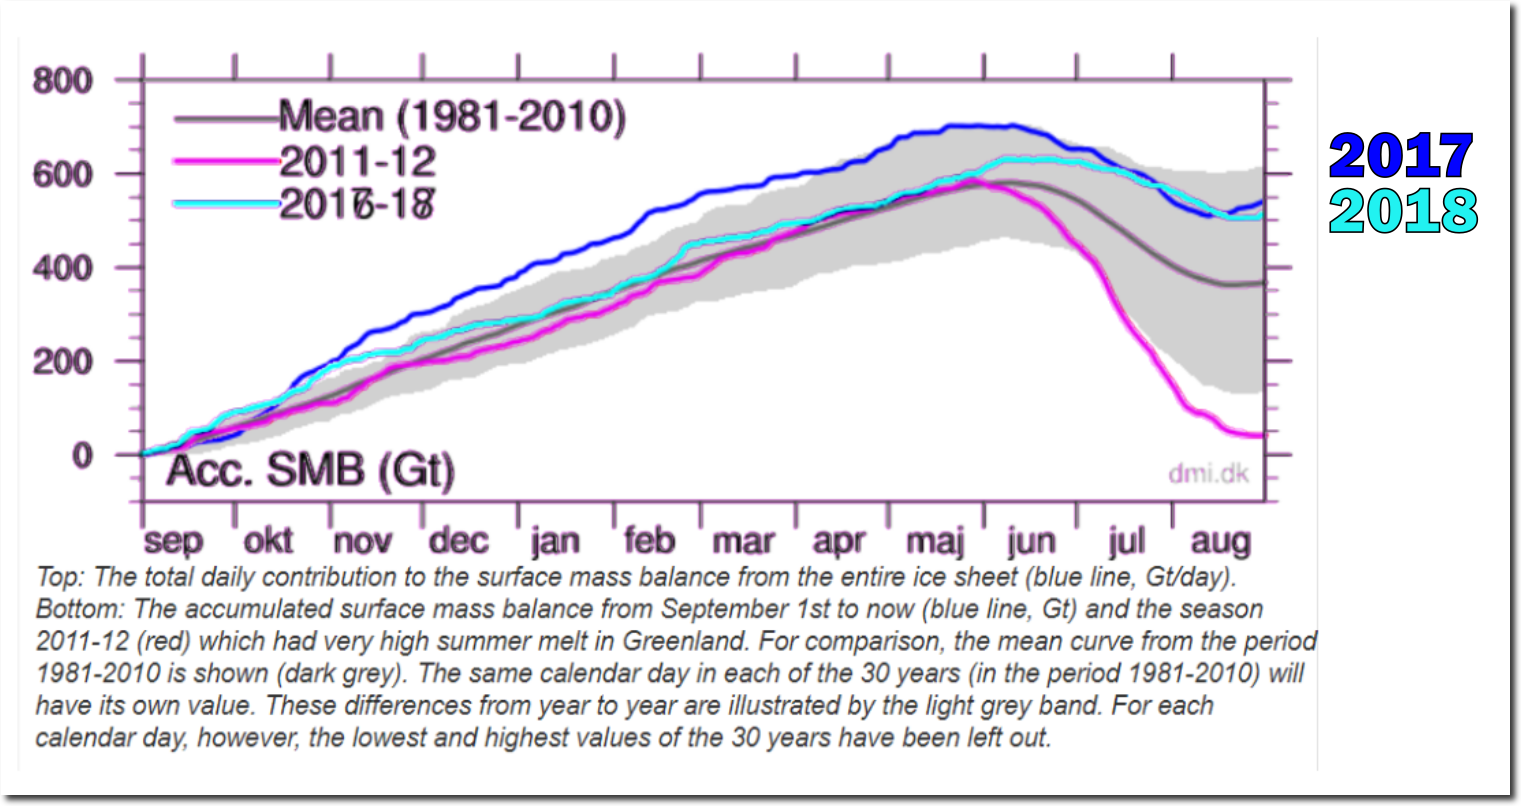
The Capital Weather Gang says Greenland is baking.
Greenland is baking, too. In fact, its summer melt season has already begun — more than a month ahead of schedule.
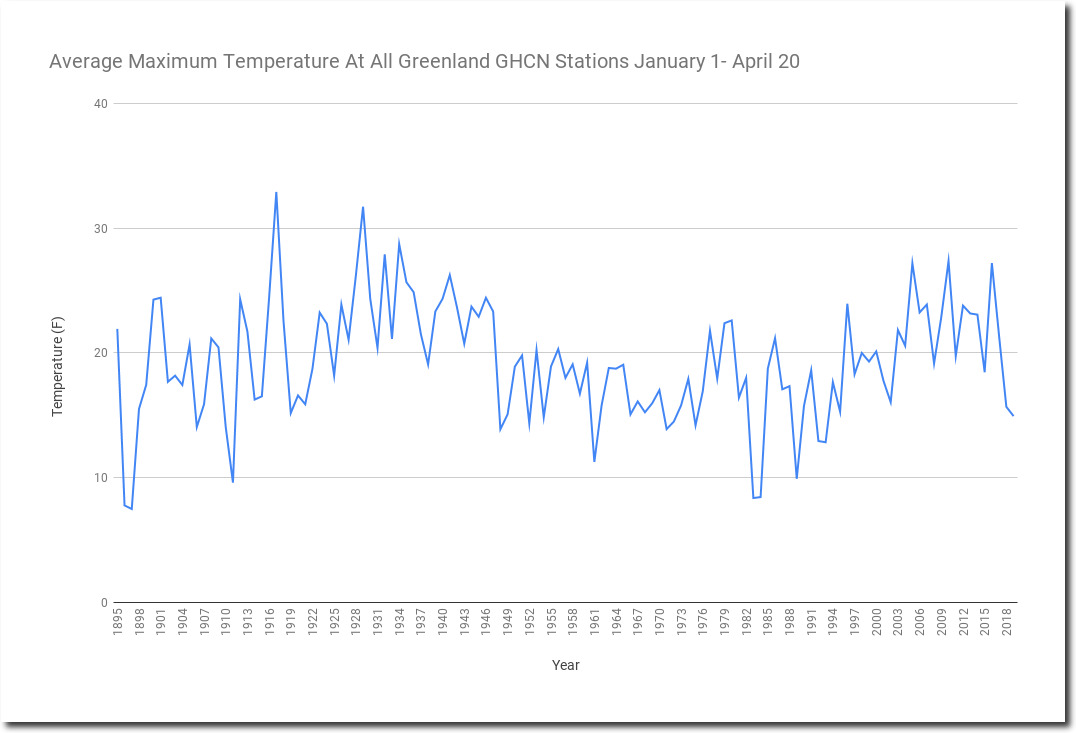
Temperatures in Greenland so far this year have been coldest since 1995, and 18th coldest since 1885..
It is currently -32C in the interior of Greenland.
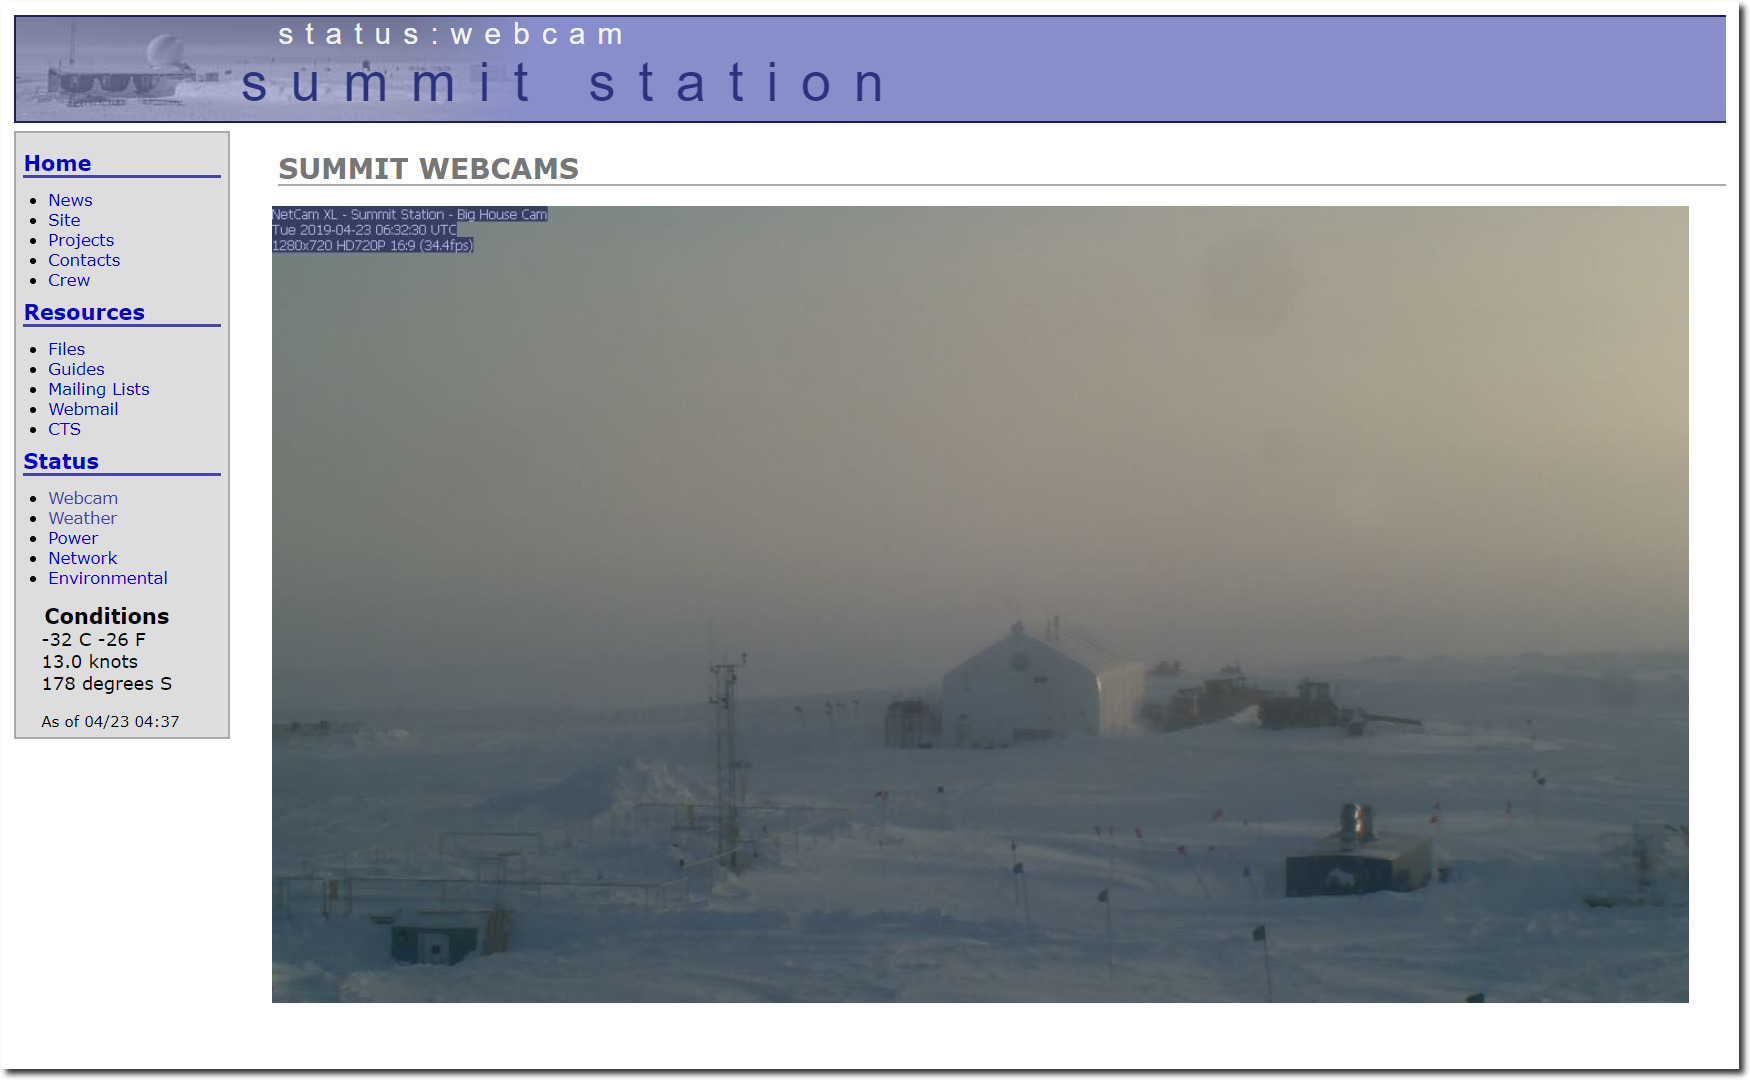
It has been very cold there.
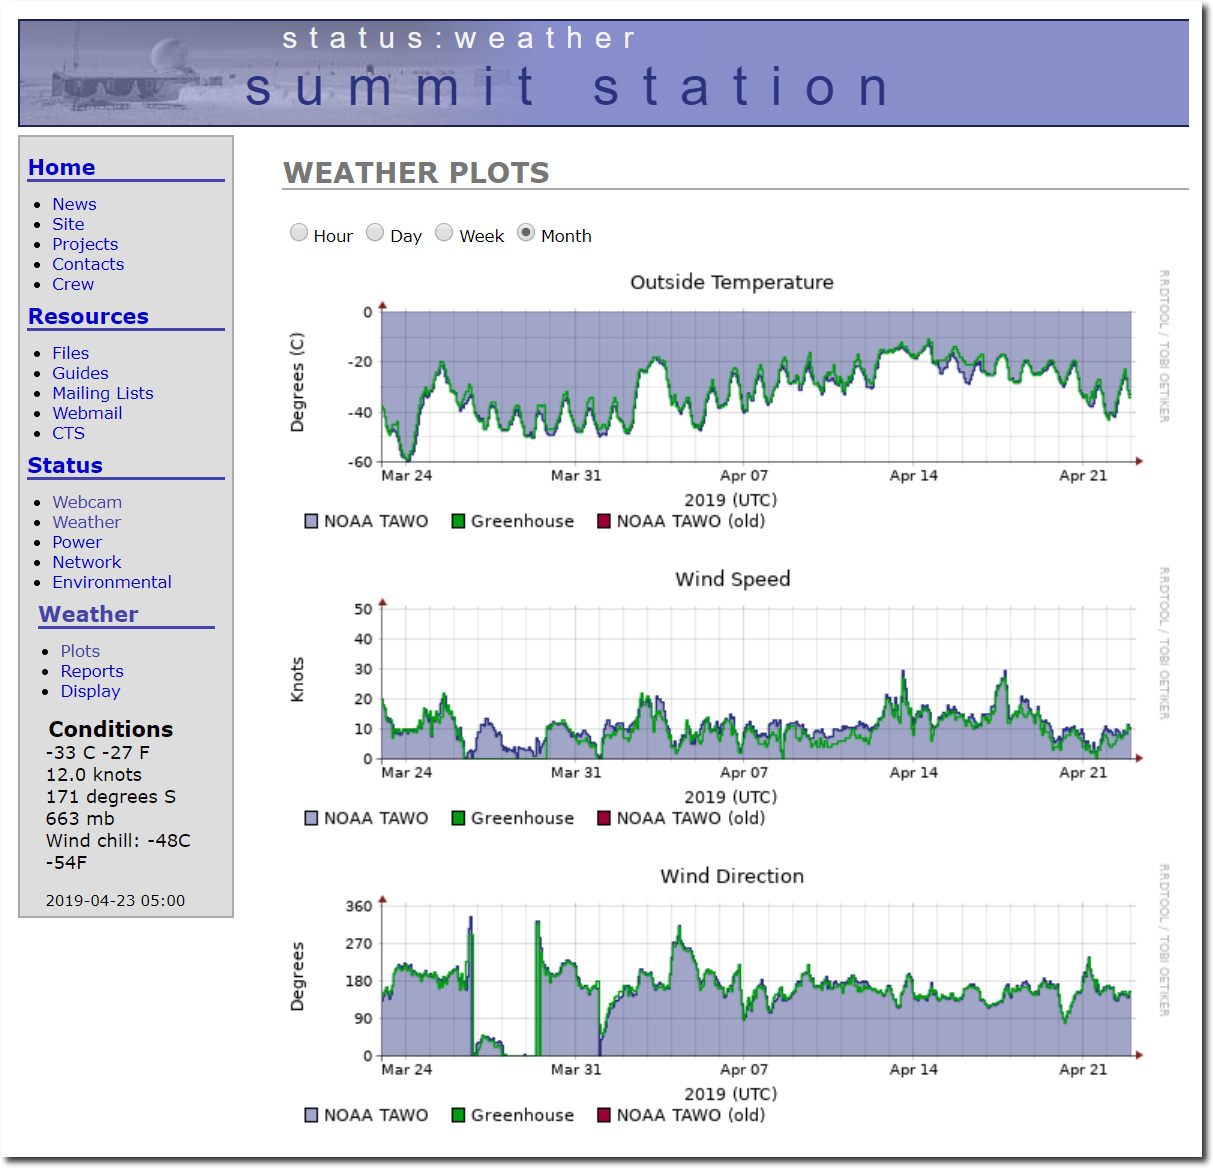
There has been close to zero melt in Greenland this year.
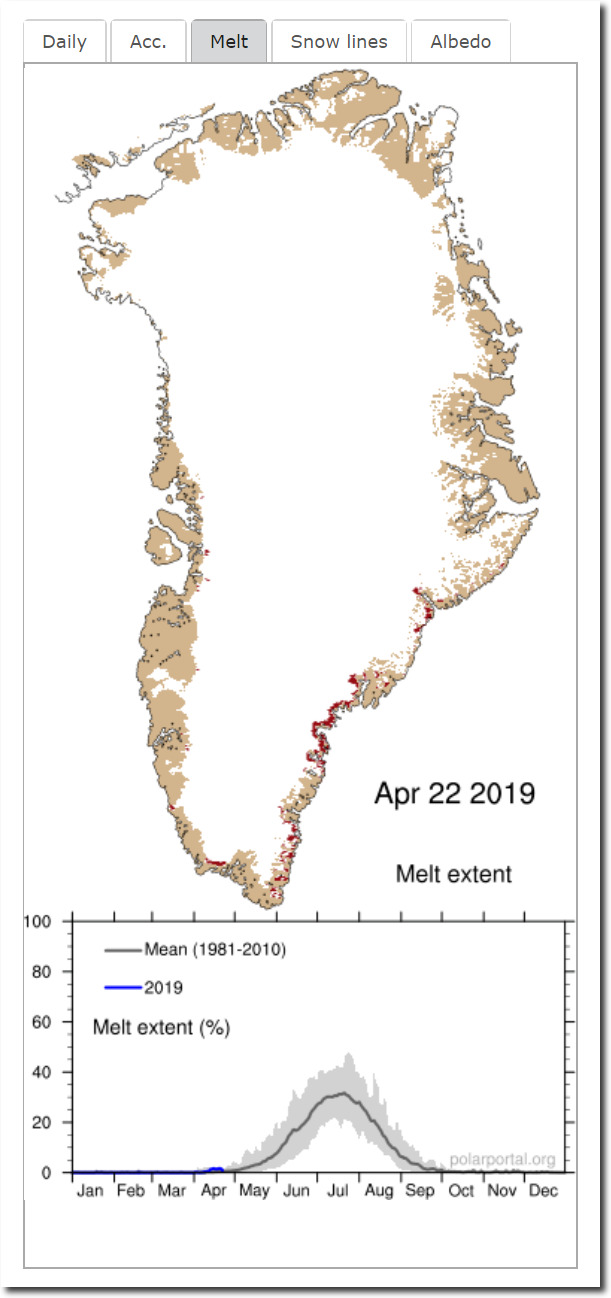
Surface Conditions: Polar Portal
Temperatures are dropping rapidly in Greenland, with last year being the coldest year since 1989.
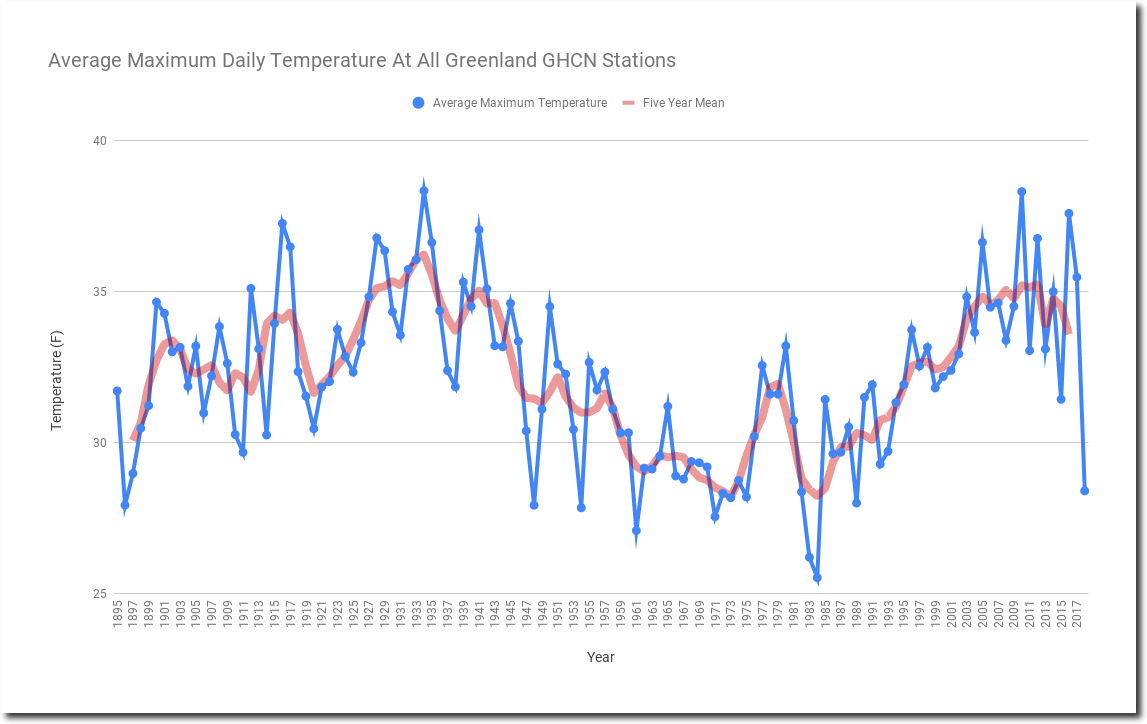
Last summer was the third coolest on record in Greenland, with only 7% of days last year above 50F. Yet climate experts continue to claim that Greenland is melting down.

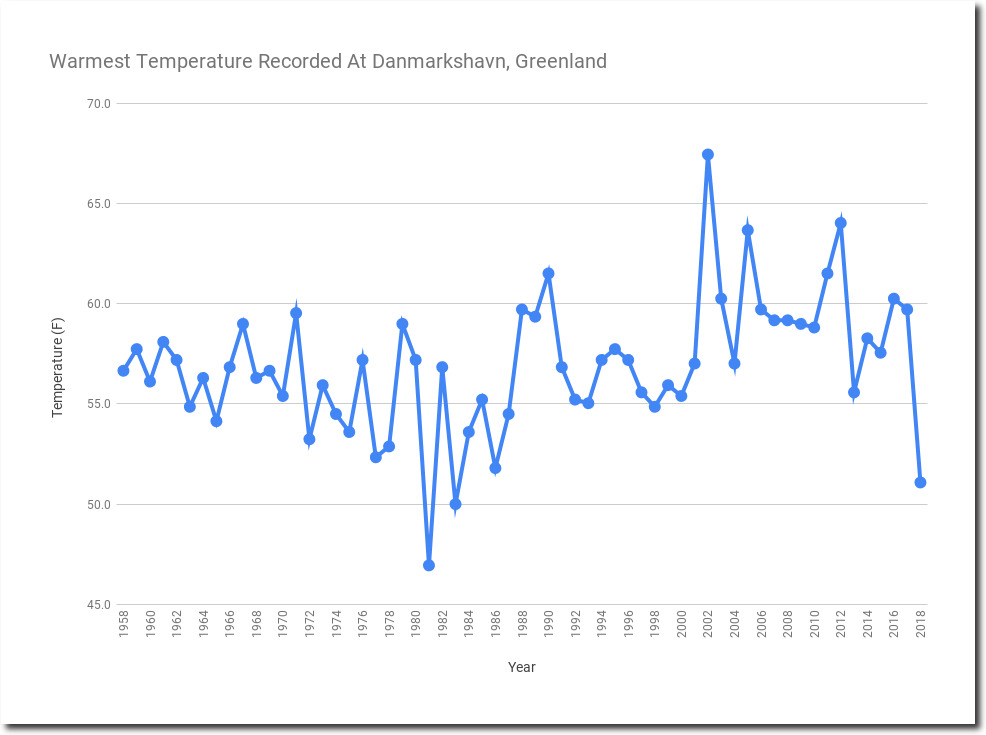
Last summer Danmarkshavn, Greenland never got above 51 degrees. Their coolest summer since 1983, when skies were obscured by dust from the eruption of El Chichon.
Greenland has gained near record amounts of ice over the last two years.
But eighty years ago, Greenland’s glaciers were rapidly melting and facing “catastrophic collapse.”
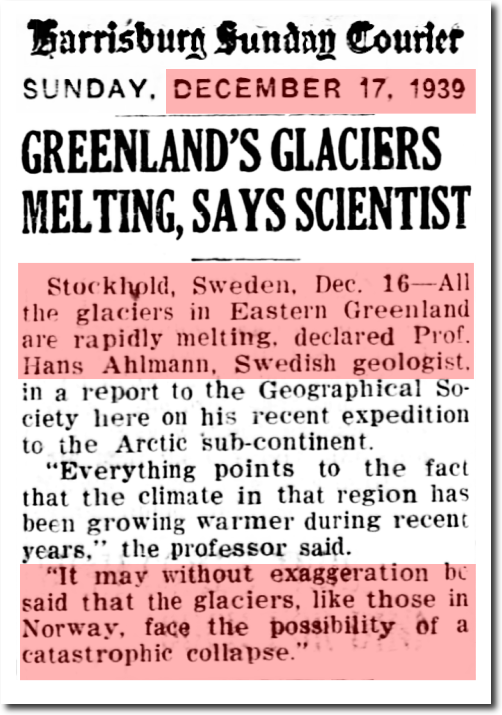
17 Dec 1939, Page 15 – Harrisburg Sunday Courier at Newspapers.com
The Capital Weather Gang doesn’t seem to do a lot of fact checking. They apparently parrot any alarmist BS they get told by academics.
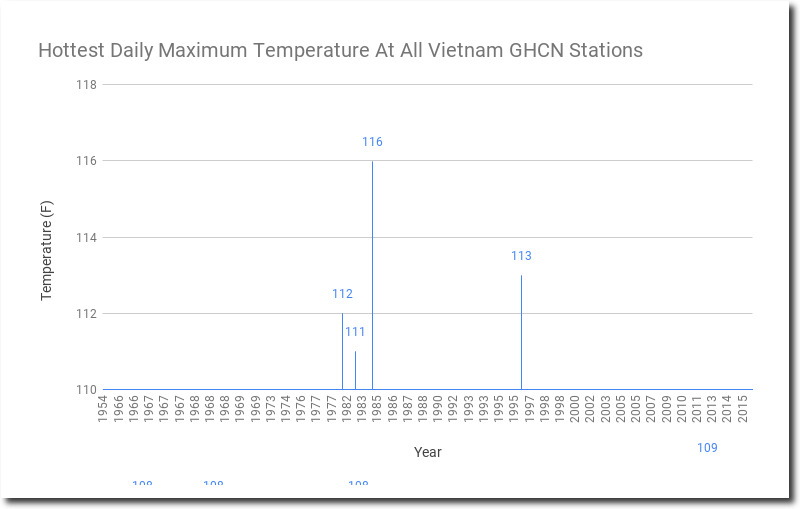
The Capital Weather Gang is shocked that April is hot in Vietnam (at latitude 10N.)
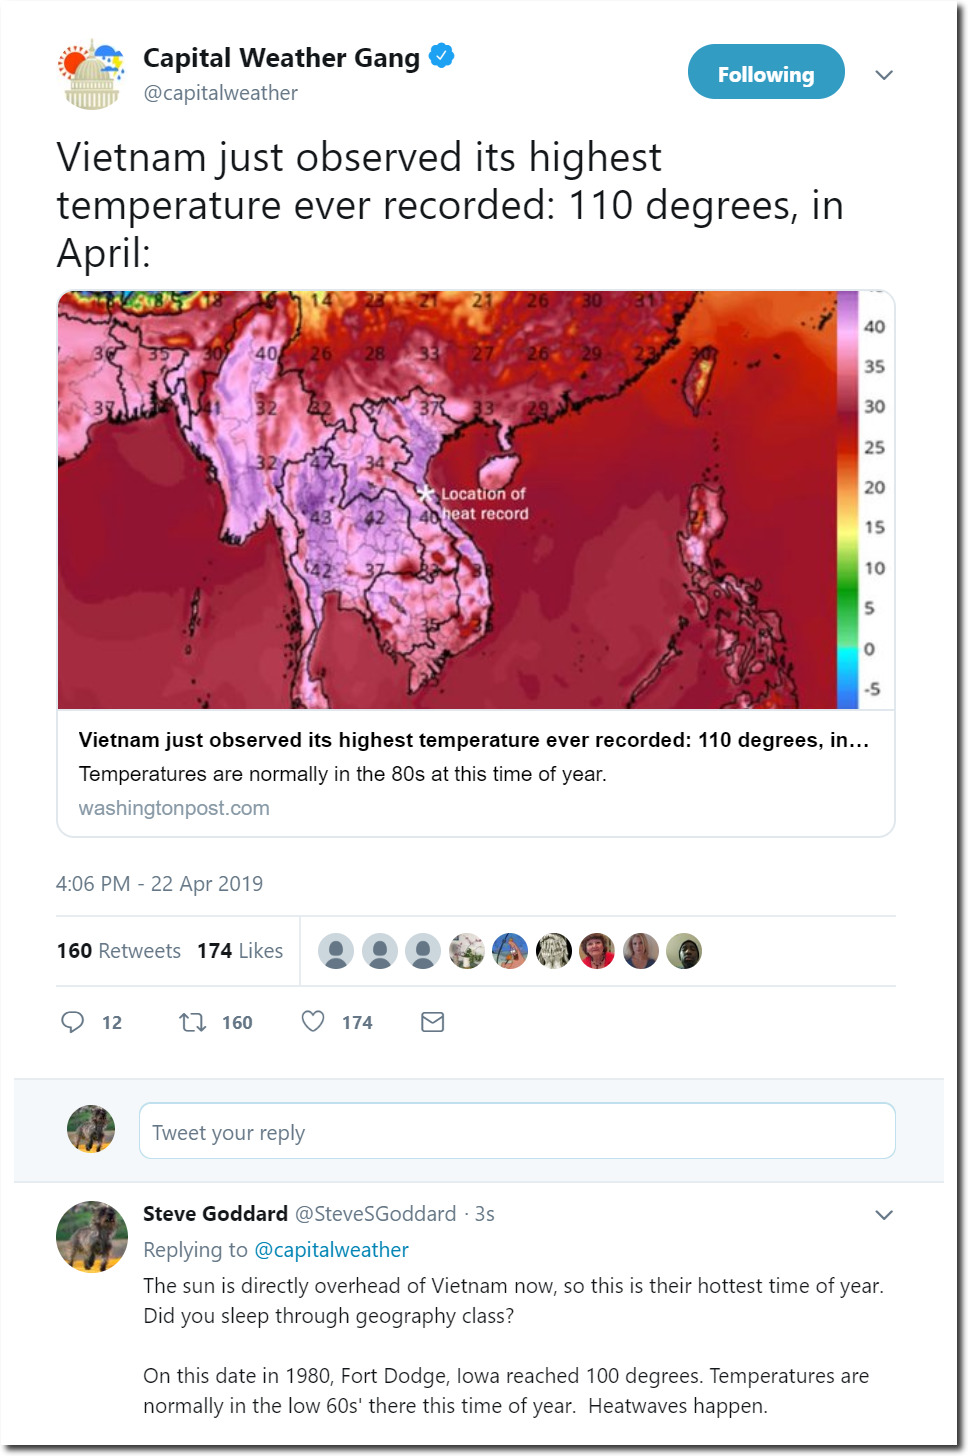
Did you sleep through geography class?
Peak temperatures occur in April in Vietnam.
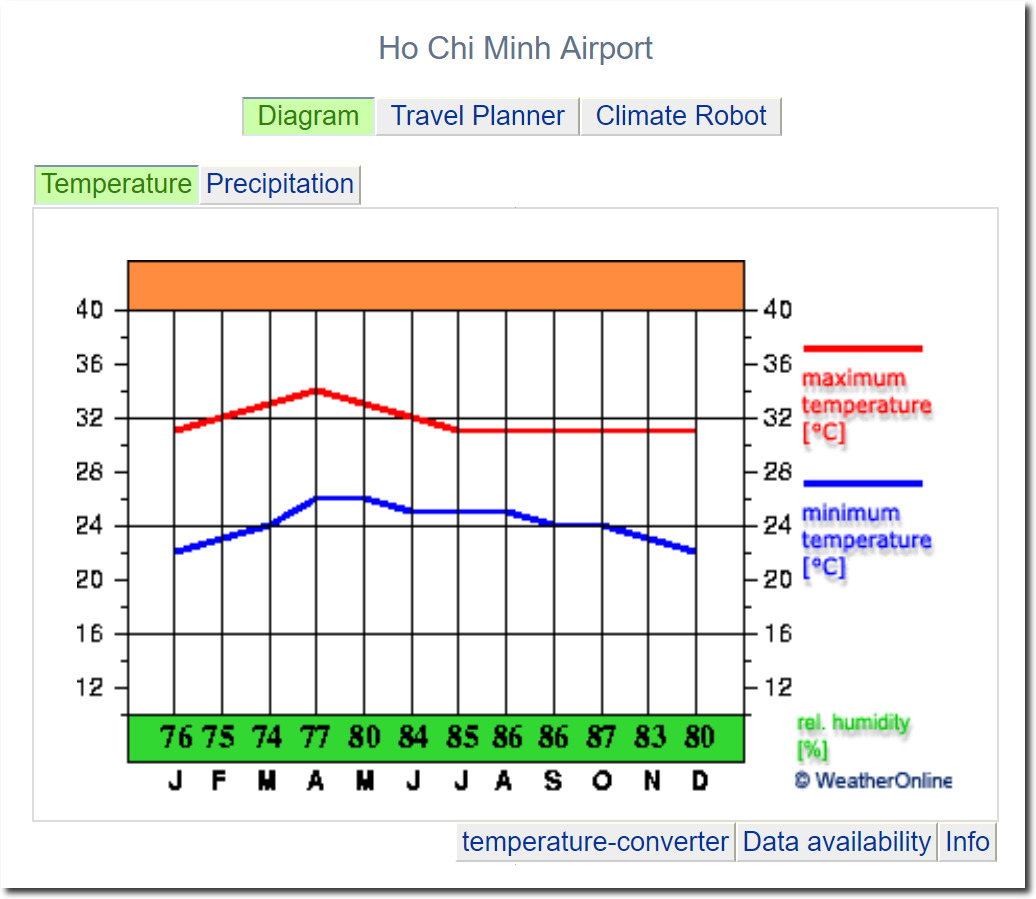
climate – Graph – Ho Chi Minh Vietnam – WeatherOnline
Vietnam was over 110 degrees in 1982, 1983, 1984 and 1996. Their hottest temperature was 116 degrees on June 22, 1984. On April 25, 1983, Vietnam reached 111 degrees.
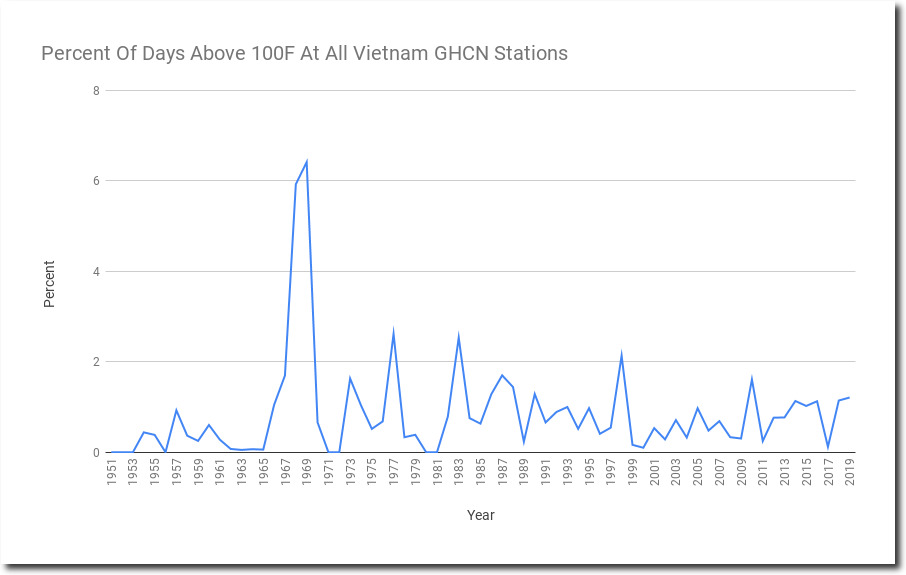
The frequency of 100 degree days peaked fifty years ago in Vietnam, in 1968 and 1969 – during the Vietnam War.
Capital Weather Gang got everything wrong in this article. Will they retract?
Nothing ever changes with mankind’s superstitions about climate.
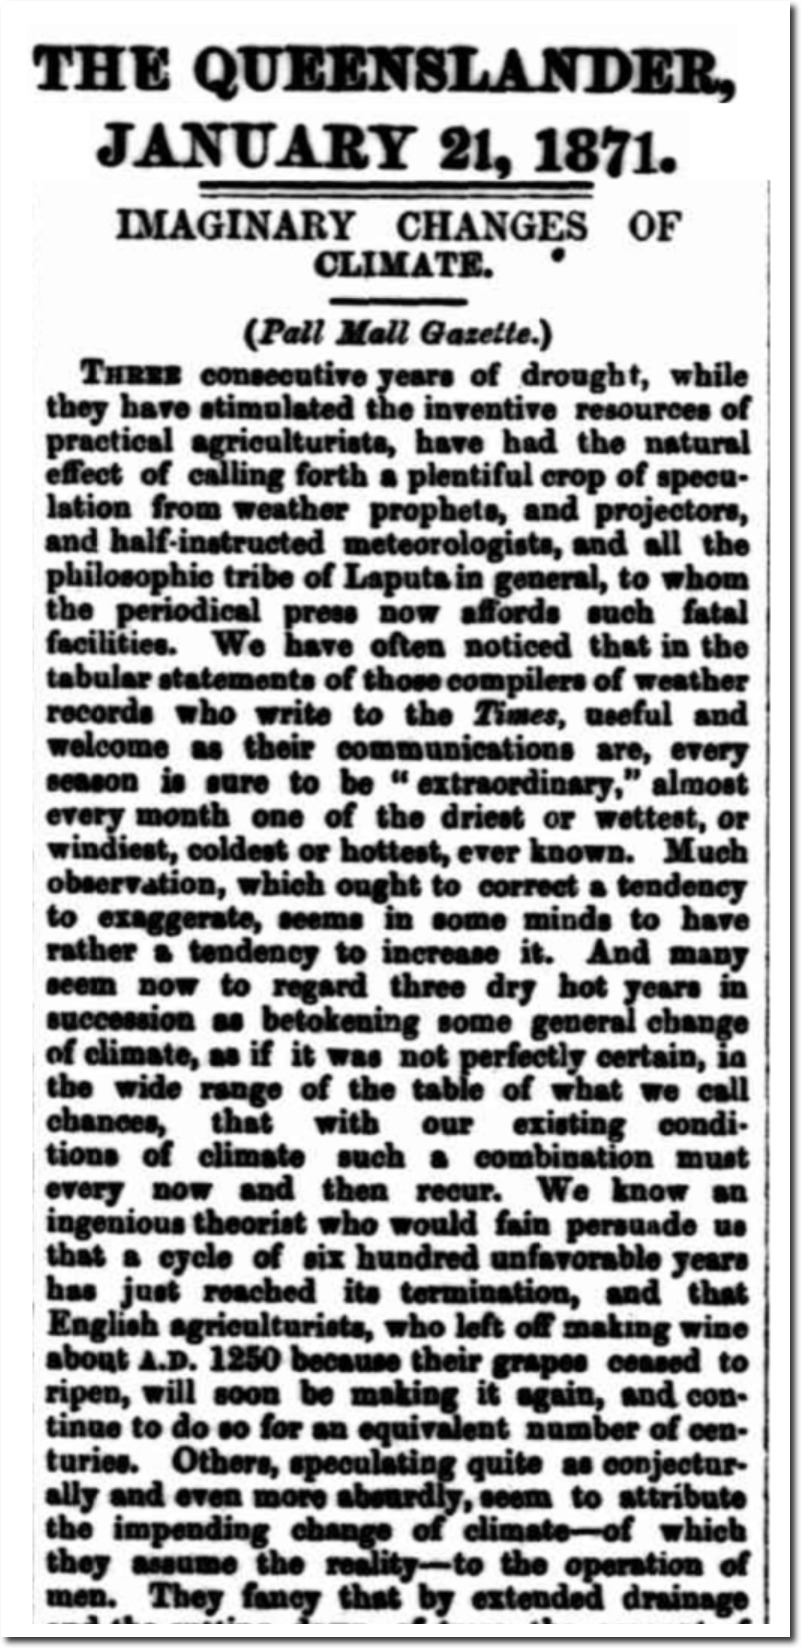
IMAGINARY CHANGES OF CLIMATE.
a plentiful crop speculation from weather prophets, and projectors, and half-instructed meteorologists, and all the philosophic tribe of Laputa In general, to whom the periodical press now affords such fatal facilities. We
every season is sure to be ” extraordinary,” almost every month one of the driest or wettest, or windiest, coldest or hottest, ever known. Much observation, which ought to correct a tendency to exaggerate, seems in some minds to have rather a tendency to increase it.
Others, speculating quite as conjecturally and even more absurdly, seem to attribute the impending change of climate—of which they assume the reality—to the operation of men
– January 21, 1871
This is graph of US maximum temperatures published on their website. It shows a hockey stick of warming after 1976.
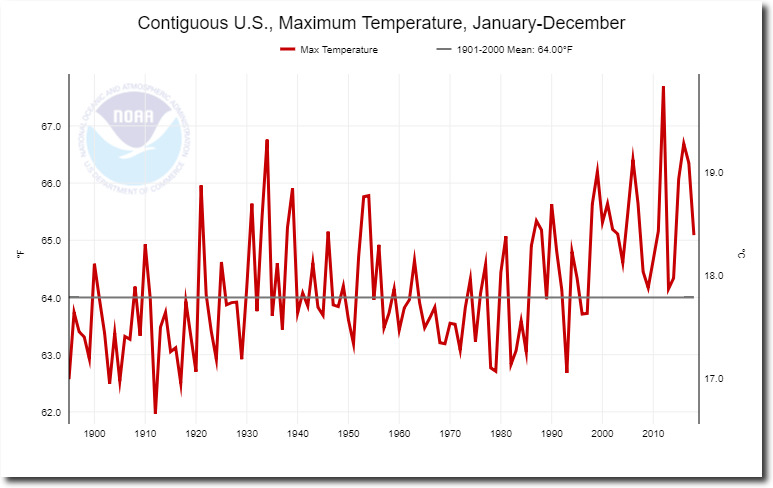
Climate at a Glance | National Centers for Environmental Information (NCEI)
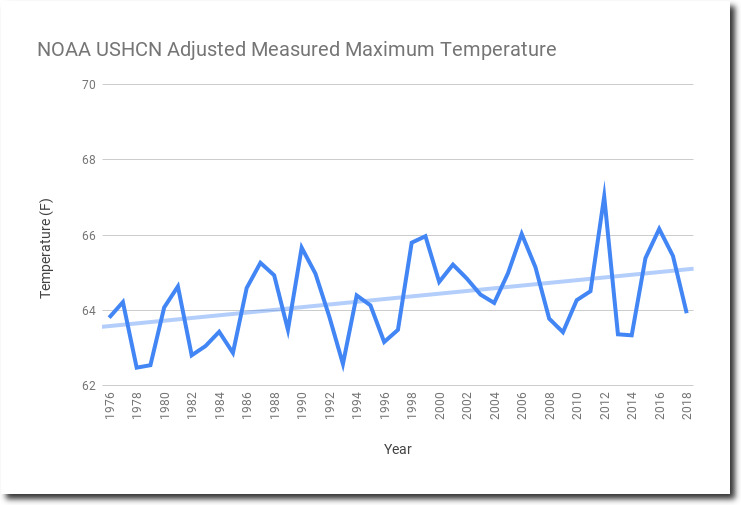
The actual measured thermometer data does not have the post-1976 hockey stick. There has been very little warming since 1976, perhaps one degree F.
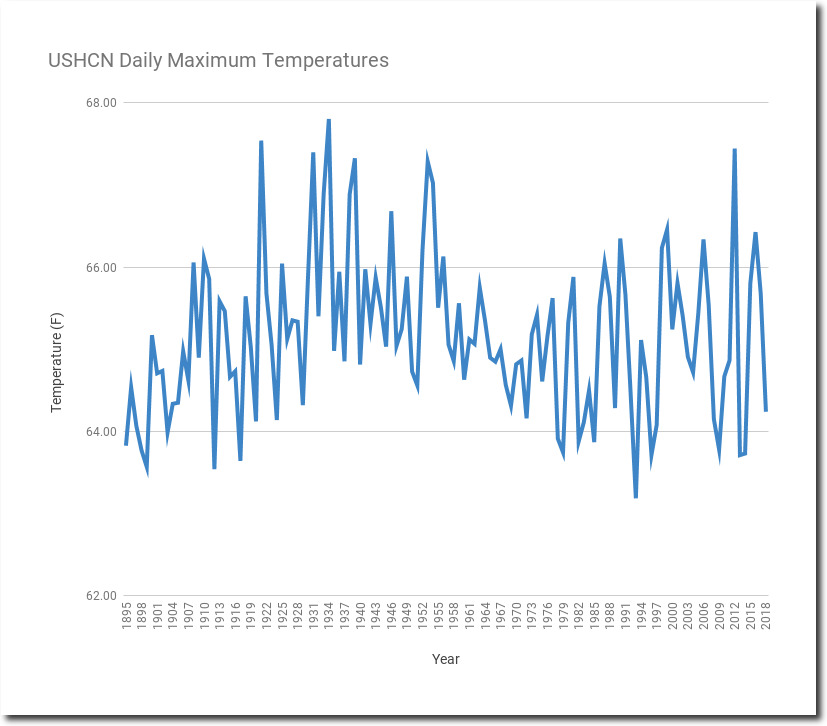
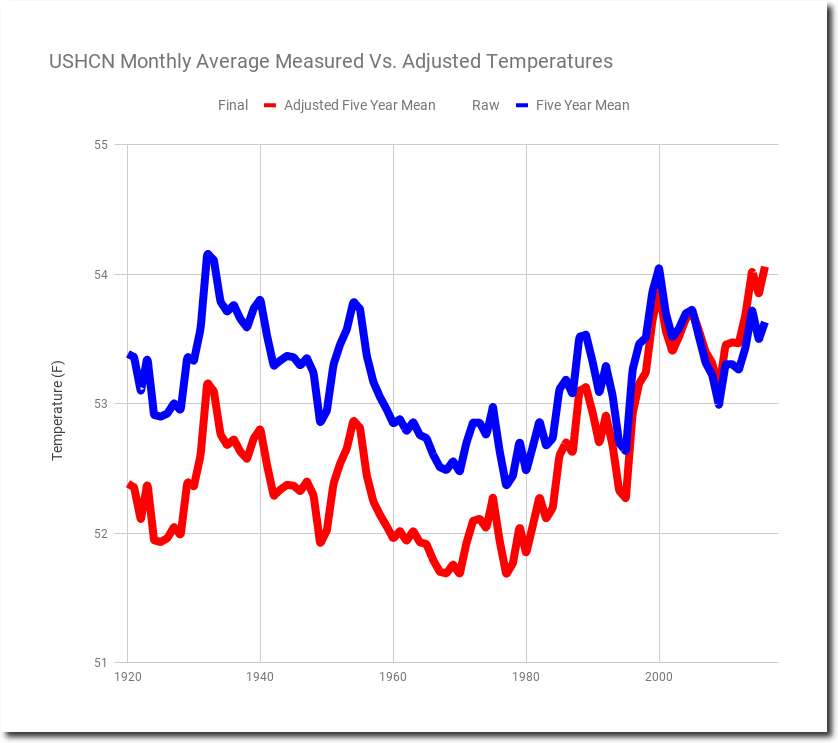
The next graph compares the measured temperatures (blue) vs. the reported (red.) The measured temperatures show long term cooling, but the reported temperatures show warming.
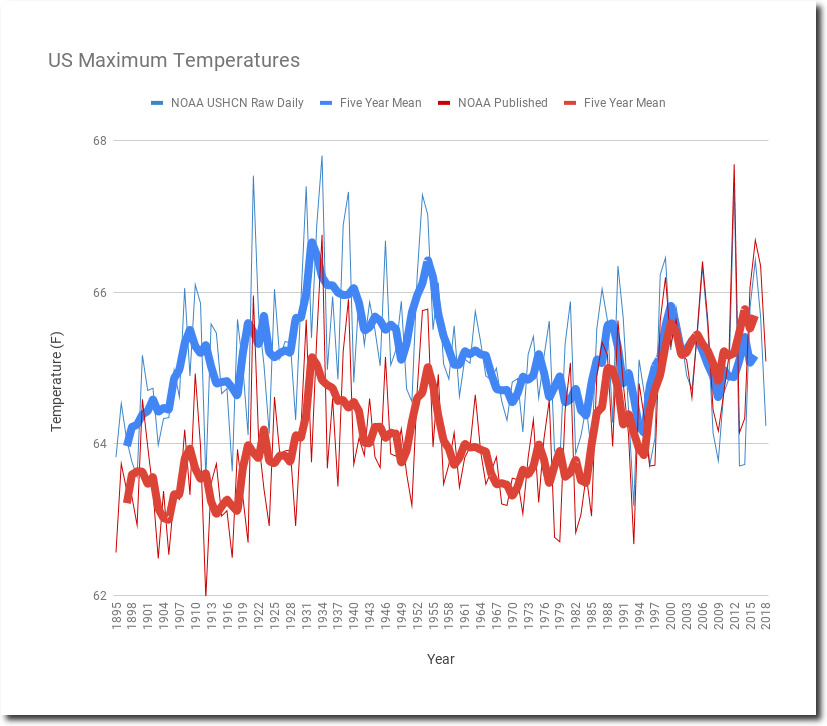
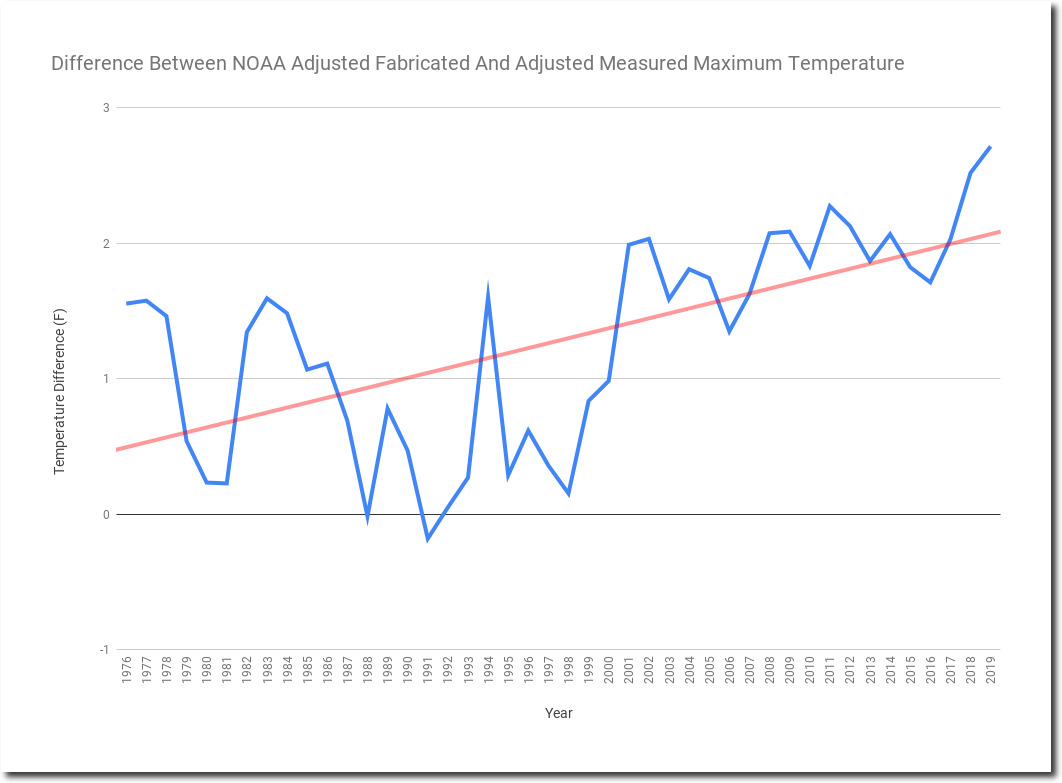
This graph shows the difference between reported and measured temperatures. The post-1976 hockey stick becomes very apparent.
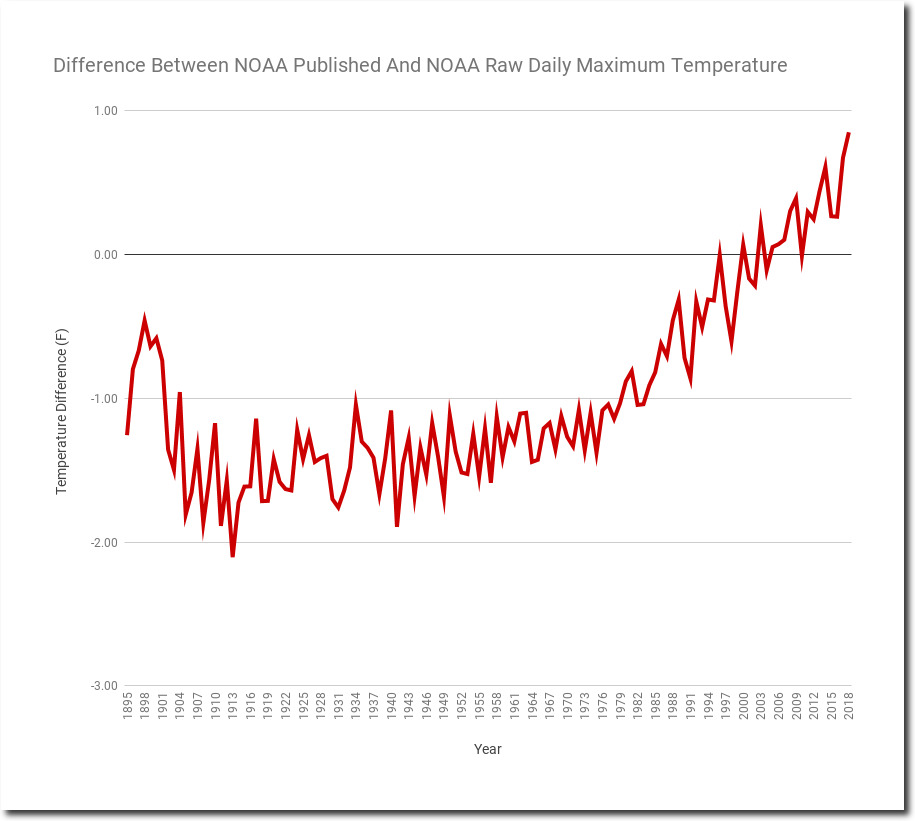
So how is NOAA tampering with the data to create this hockey stick?
Alarmists claim that it is due to Time of Observation Bias or changing station composition, but that isn’t what is going on. NOAA is simply making the data up. Every month, a certain percentage of stations does not report, and are marked with an E (estimated.) The percentage of estimated (i.e. fake) data has skyrocketed from around 5% to almost 50% since 1976.
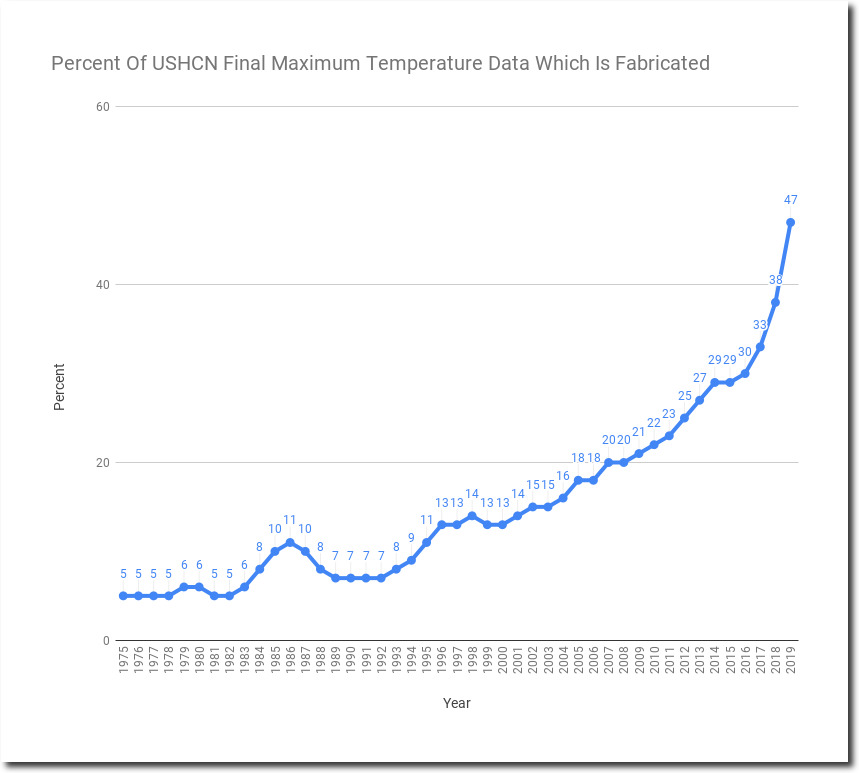
And here is the smoking gun. Comparing the fake adjusted temperatures to the measured adjusted temperatures. The measured adjusted temperatures show about one degree warming since 1976, but the fake temperatures show about three degrees warming. And almost half of the data is fake now.

The post-1976 hockey stick is created by manufacturing data, not adjusting data as alarmists claim.
Manipulating the US temperature data is very important to global warming scamsters, because the US has the vast majority of high quality long term data. Much of the rest of the world has been very busy dealing with genocide and world wars for the past century. Maintaining temperature data was a low priority for people trying to keep from being killed by their government.
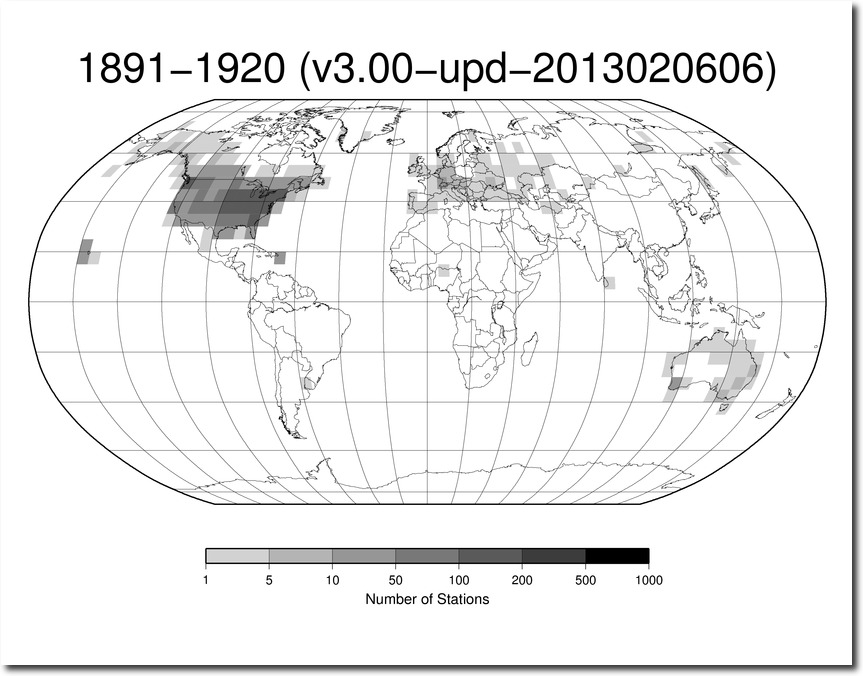
ftp://ftp.ncdc.noaa.gov/pub/data/ghcn/daily/figures/station-counts-1891-1920-temp.png
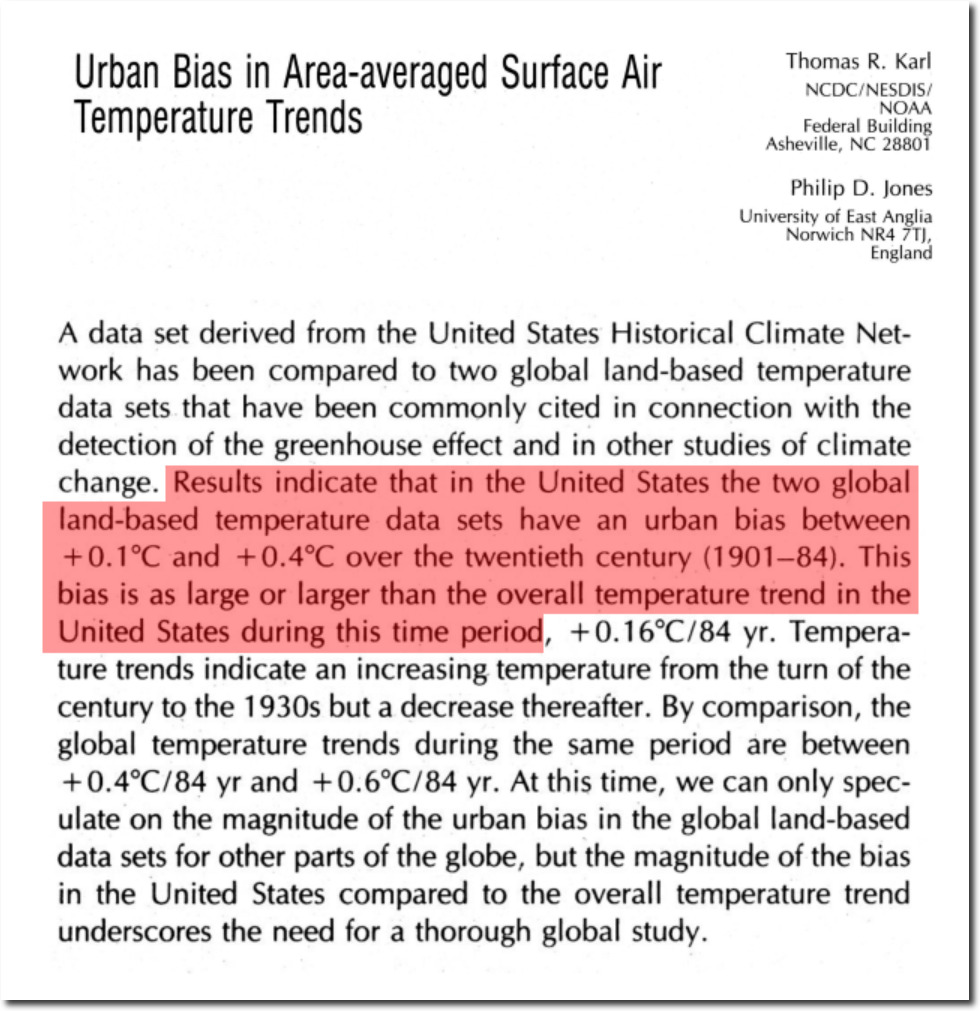
And then there is UHI. Thirty years ago, Tom Karl and Phil Jones said that UHI was responsible for the entire warming trend in the US.
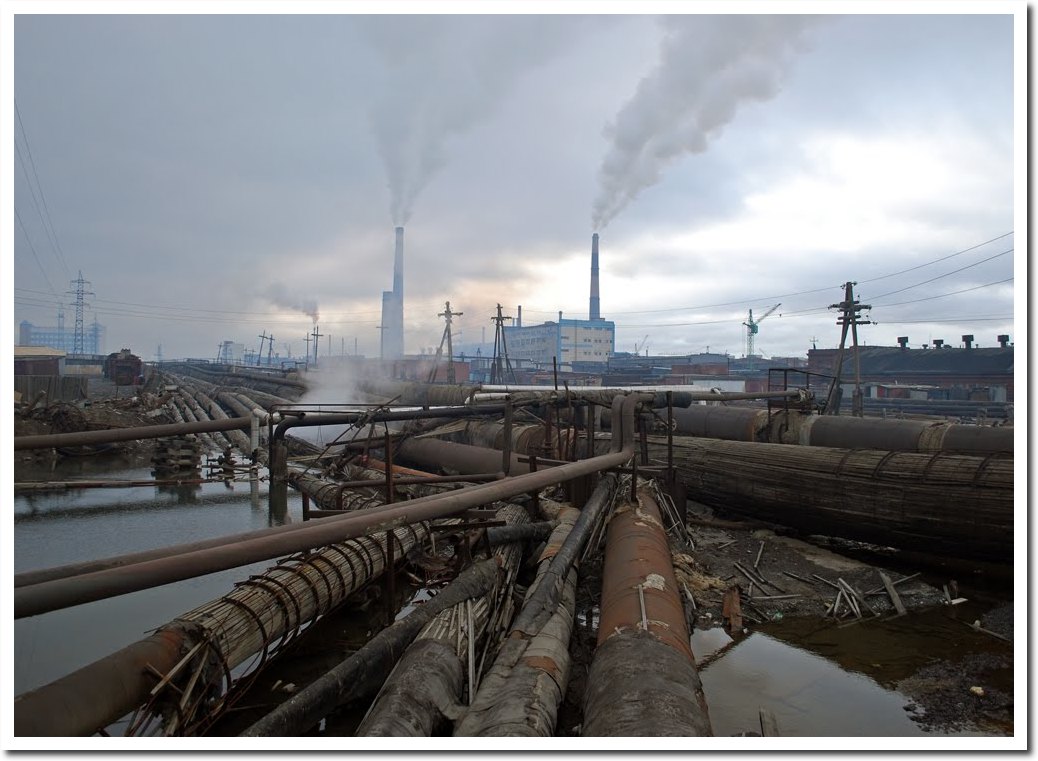
The world ends in 12 years, and China plans to build hundreds of new coal fired power plants.
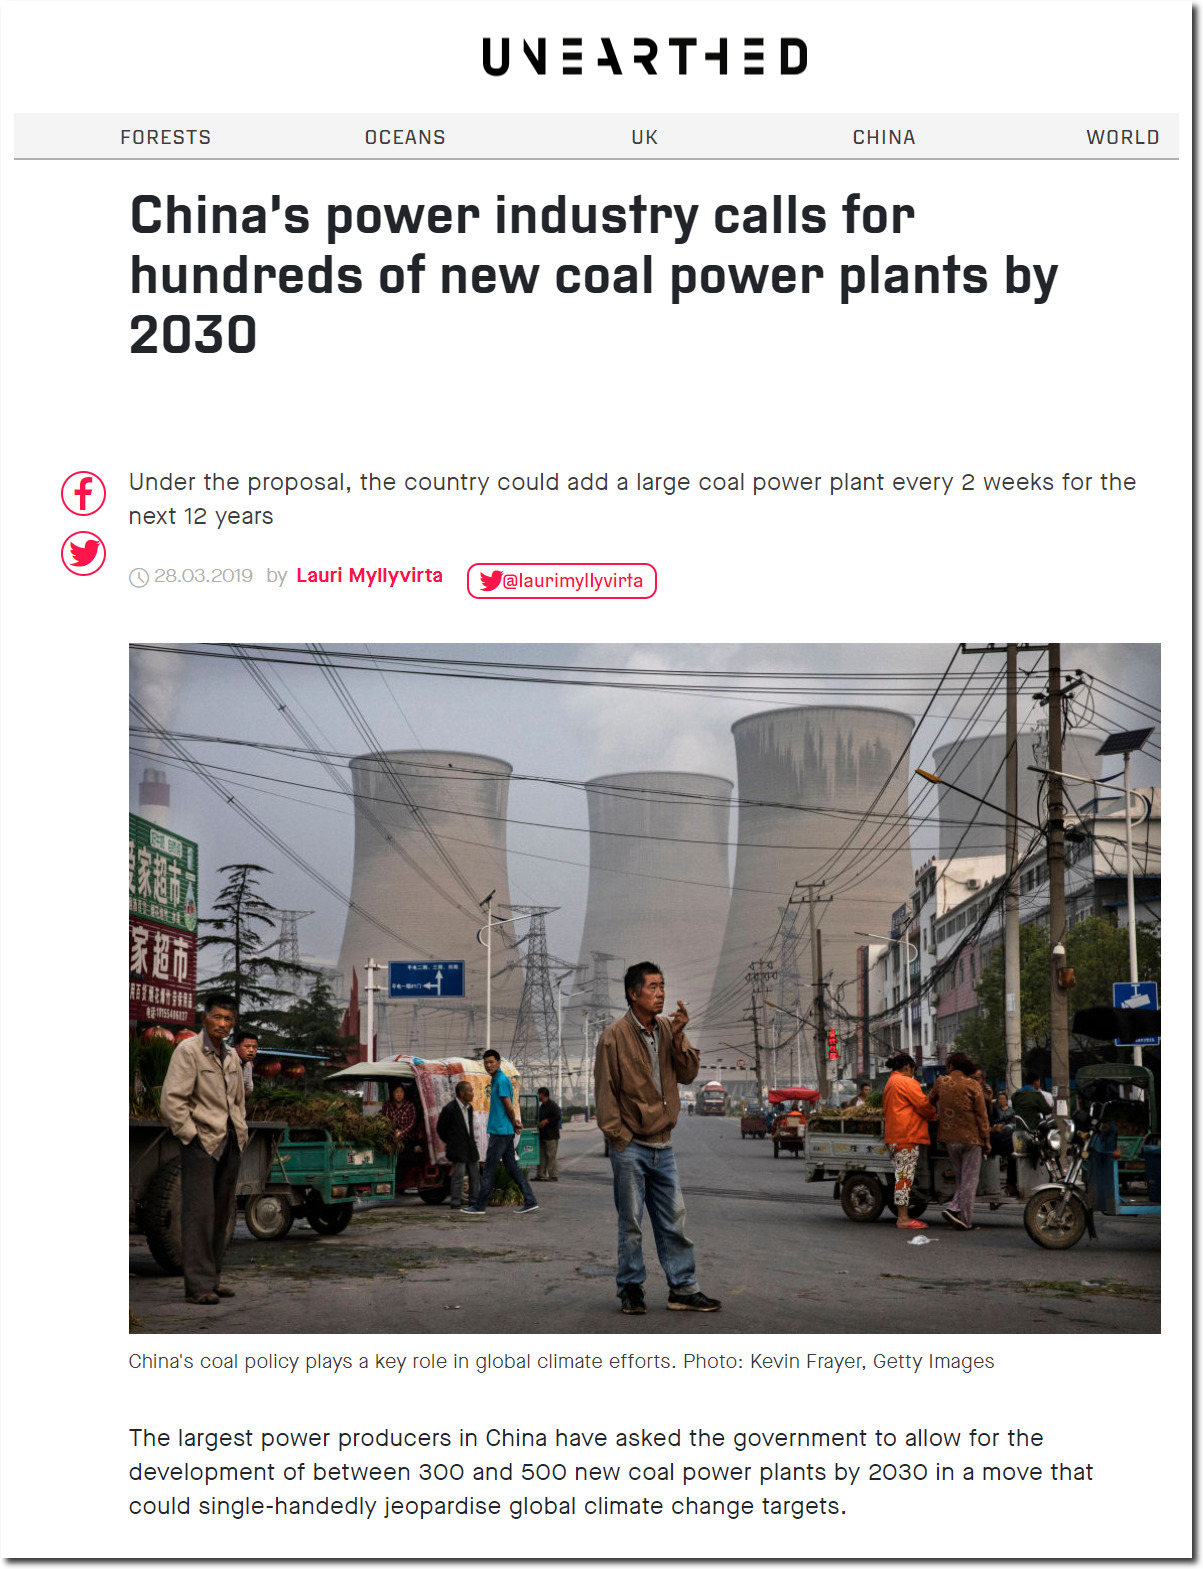
China’s power industry calls for hundreds of new coal power plants by 2030 – Unearthed
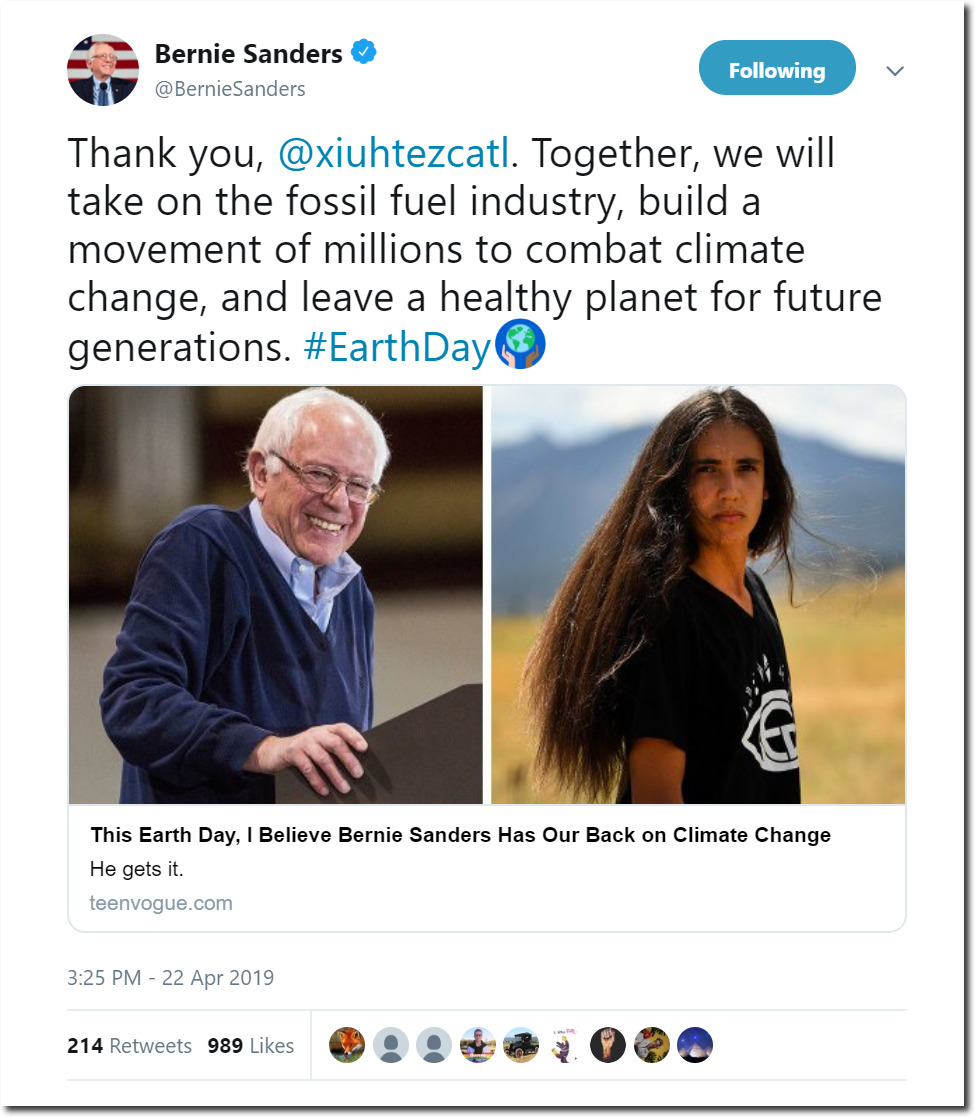
But not to worry. Bernie is going to punish American companies for selling him the fuels he needs to survive.
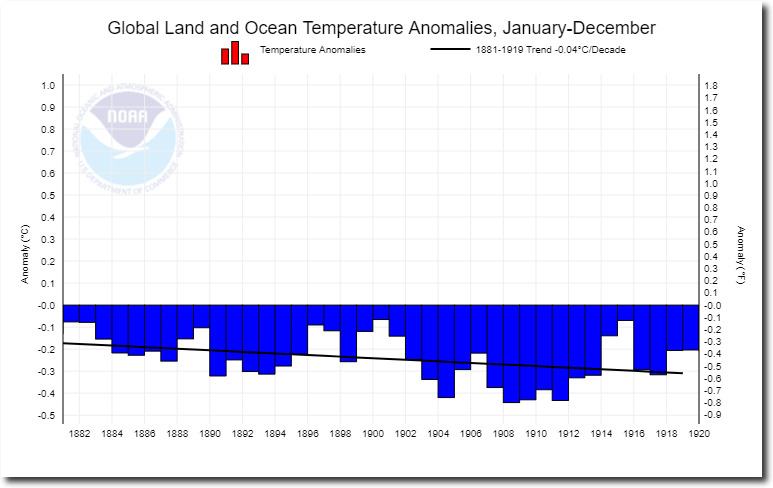
Thirty years ago, NOAA said most global warming occurred between 1881 and 1919 – and that Earth cooled from 1921 to 1979.
Analysis of warming since 1881 shows most of the increase in global temperature happened before 1919 – before the more re-cent sharp rise in the amount of carbon dioxide in the atmosphere. said Thomas Karl, of the National Oceanic and Atmospheric Adminis-tration’s National Climatic Data Center in Asheville, N.C. While global climate warmed overall since 1881, it actually cooled from 1921 to 1979. Karl said.

7 Dec 1989, Page 14 – at Newspapers.com
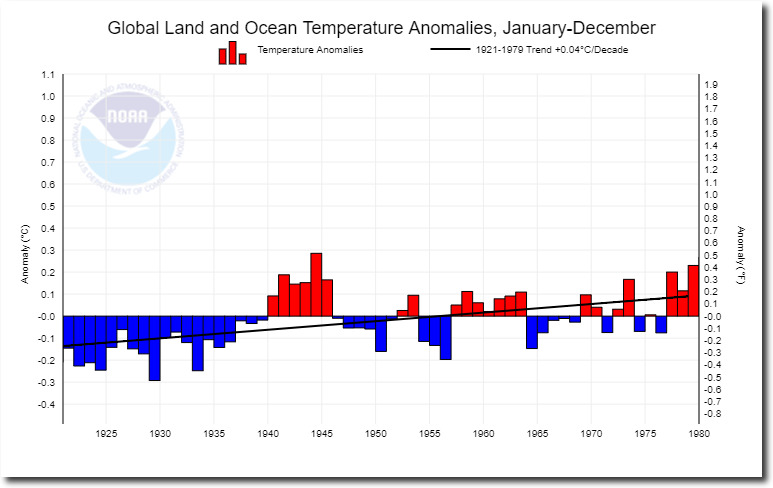
Now NOAA shows the exact opposite. They show earth cooling from 1881 to 1919, and warming from 1921 to 1979.
Climate at a Glance | National Centers for Environmental Information (NCEI)
Climate at a Glance | National Centers for Environmental Information (NCEI)
Perhaps NOAA scientists travelled back in time and took new readings.

Lenin created an environmental paradise on Earth in the Soviet Union.
A favorite claim of climate alarmists is that they adjust older temperatures upwards.
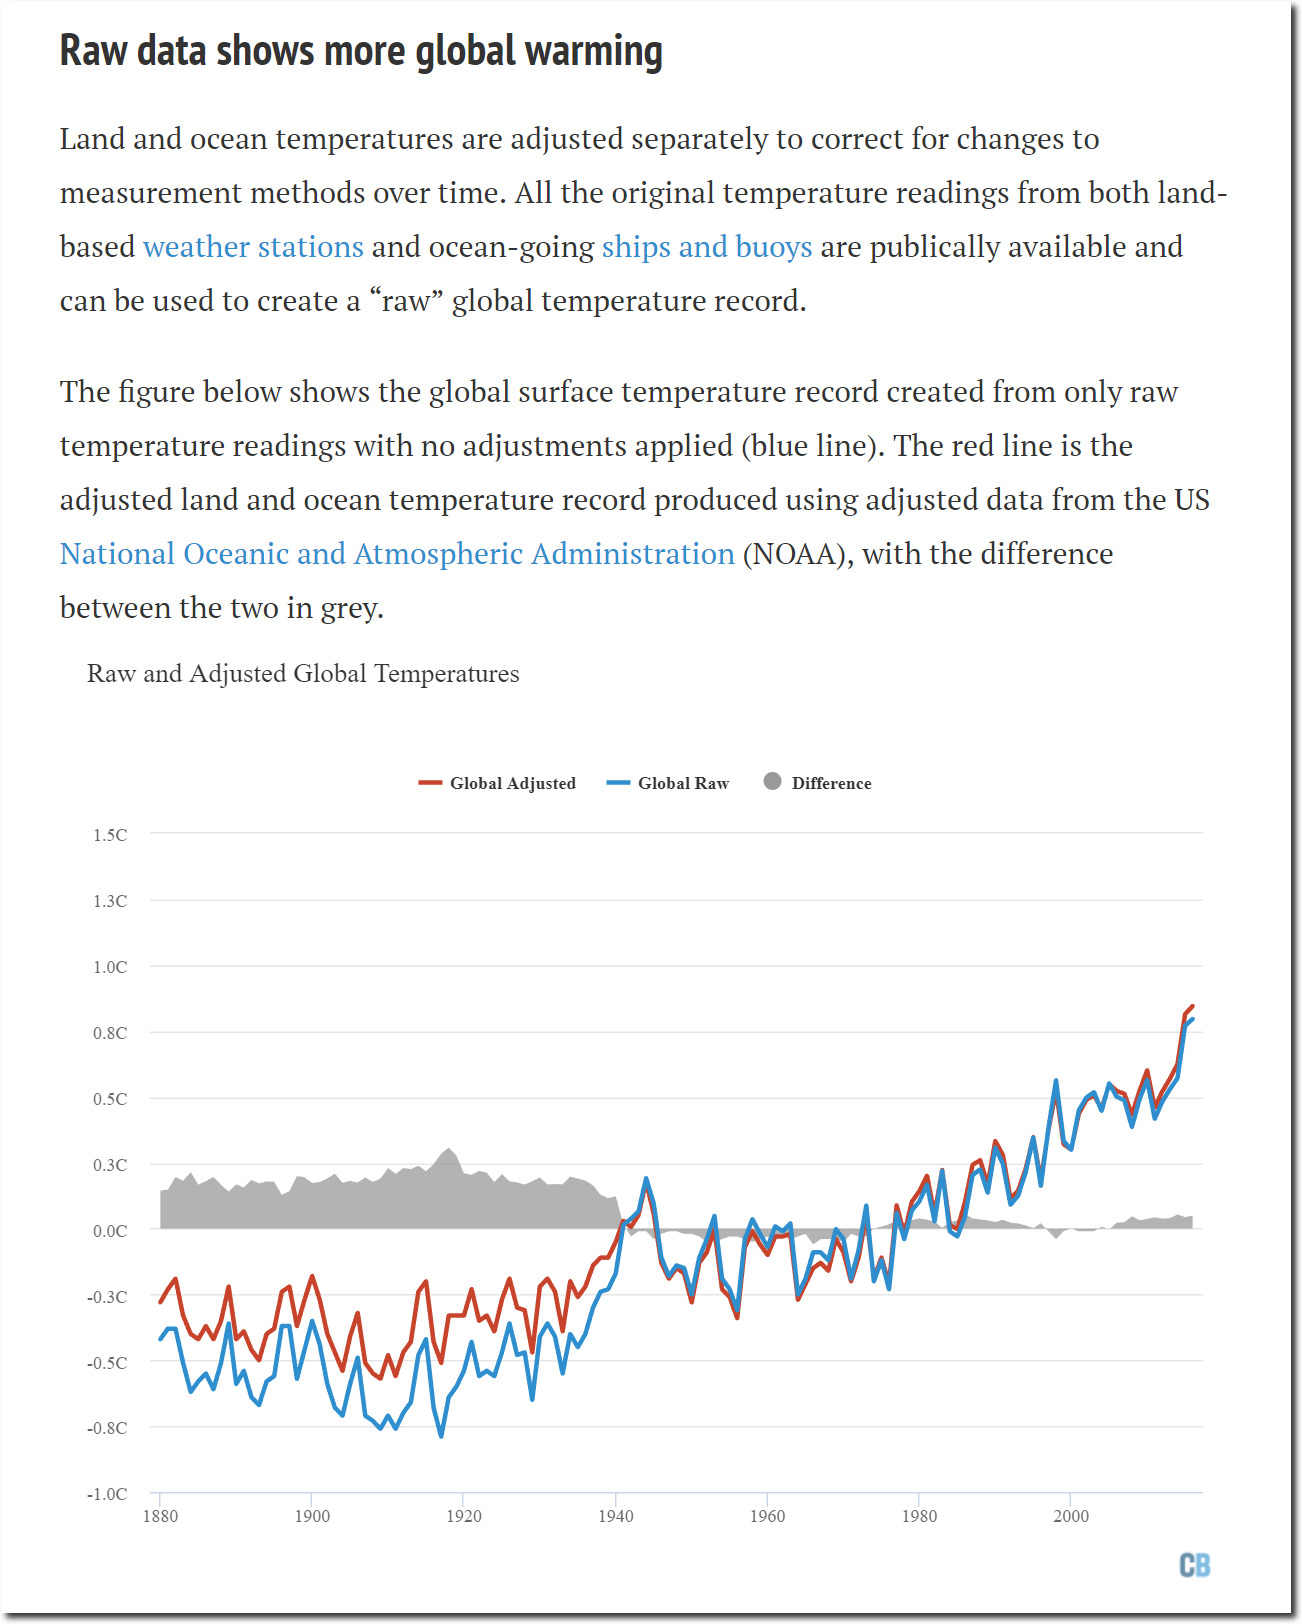
Explainer: How data adjustments affect global temperature records | Carbon Brief
This certainly isn’t true for global land temperatures.
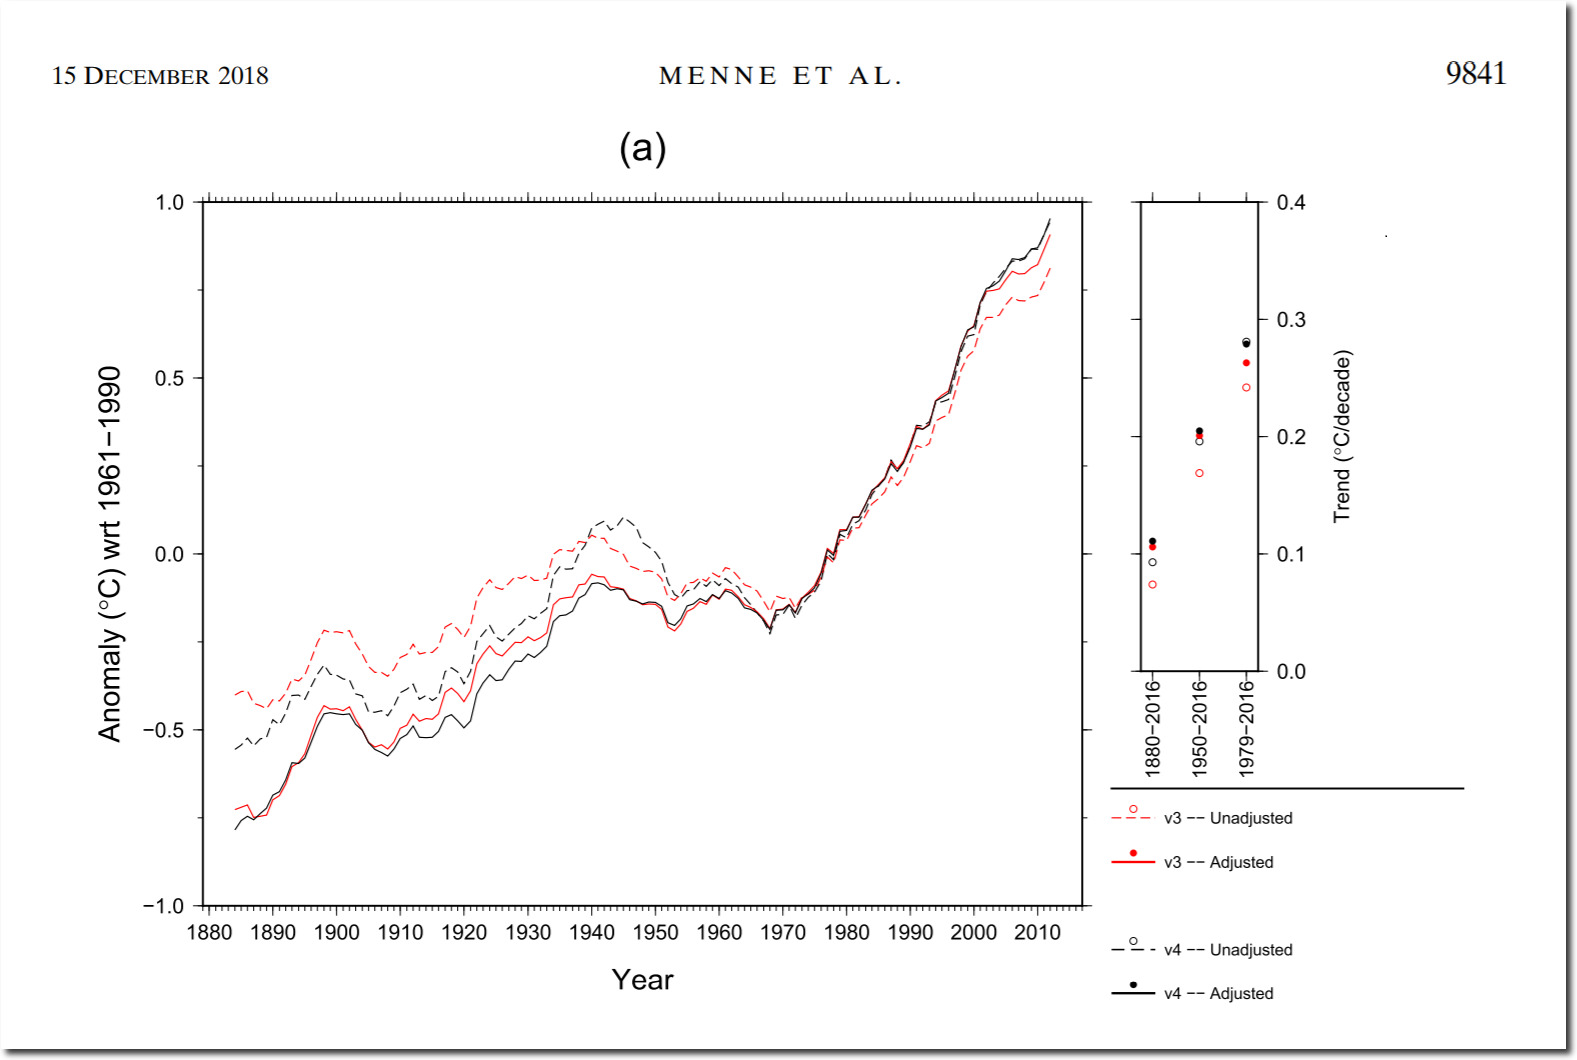
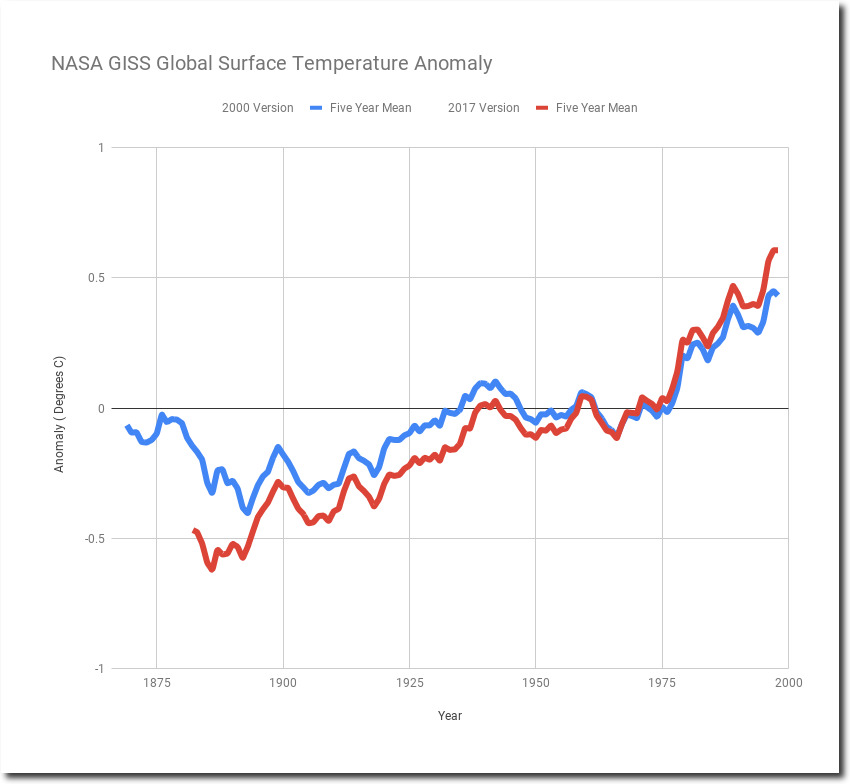
Newer versions of land temperatures keep getting adjusted further to cool the past.
There is little high quality temperature data outside the US.
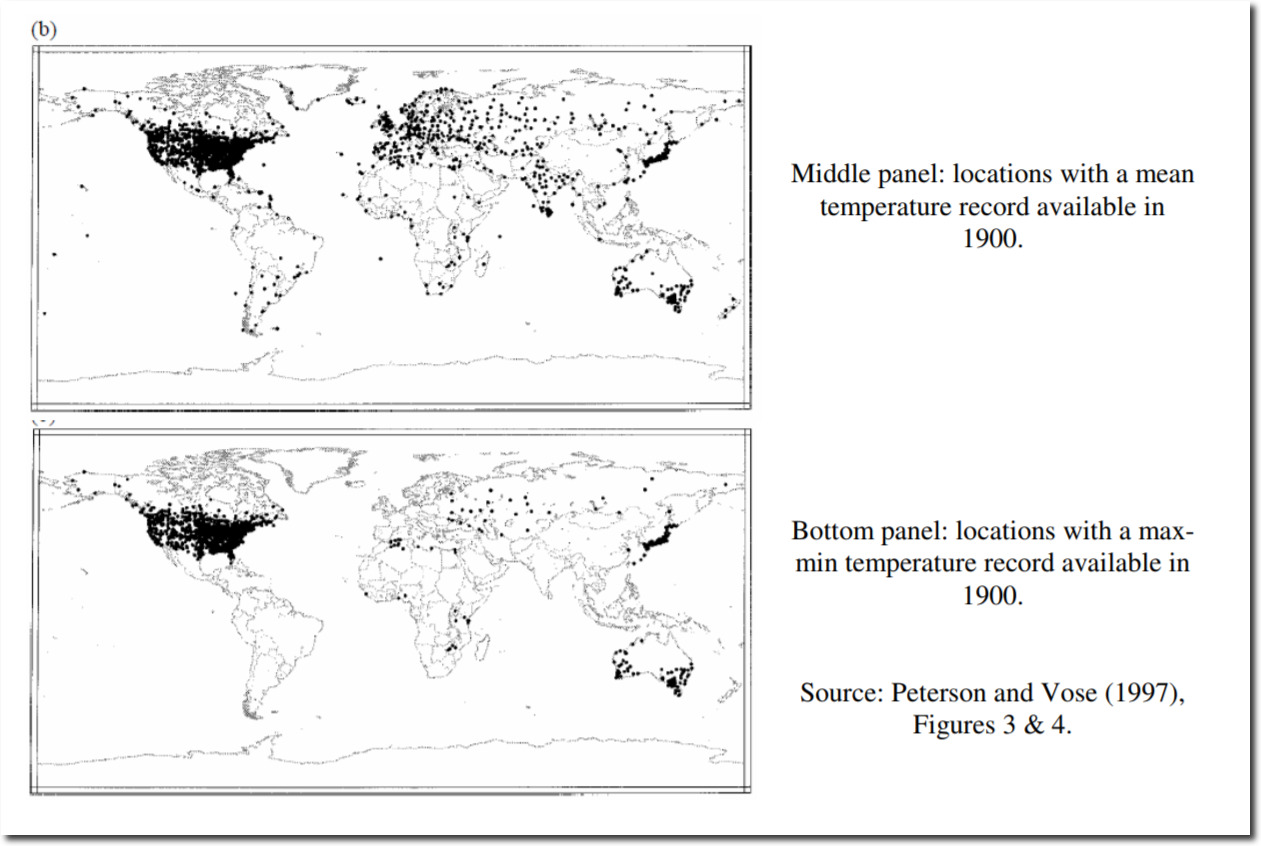
A Critical Review of Global Surface Temperature Data Products by Ross McKitrick :: SSRN
The US data is massively adjusted to increase warming.
And the ocean data (like the land data) is largely fake.
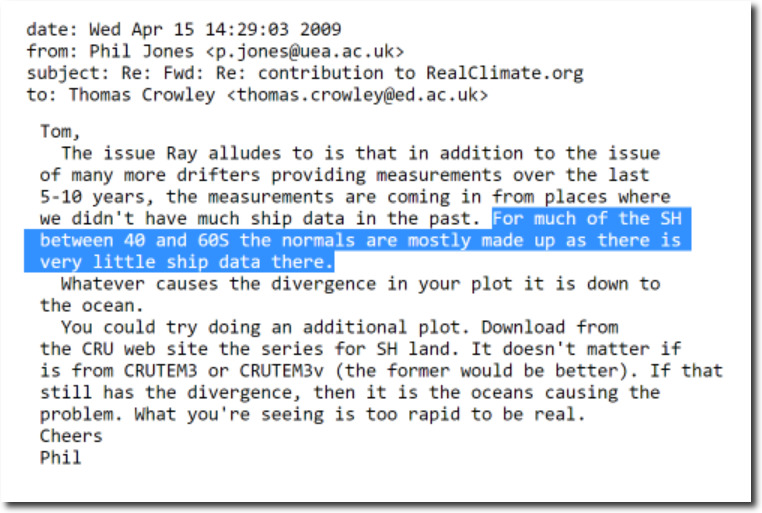
di2.nu/foia/foia2011/mail/2729.txt
Climate science is a farce. Junk science built on top of junk data.

