Squaw Valley Snowfall On Record Pace

Squaw Valley, CA has received 658 inches of snow this winter, and for the date is four inches ahead of the previous record year of 2017.

View Last 7 Years of Squaw Valley Snowfall | Squaw Alpine

This comes three years after experts announced the permanent drought in California.

California Braces for Unending Drought – The New York Times

Thanks El Niño, But California’s Drought Is Probably Forever | WIRED

When CO2 was much lower, the 1960 Squaw Valley Olympics almost had to be cancelled because of a lack of snow.

09 Feb 1960, Page 1 – The Berkshire Eagle at Newspapers.com

Posted in Uncategorized | Leave a comment

America Goes Full Orwell

“I hope he wins,” Anderson added. “I’m happy for him that the system worked for him in his favor because the system isn’t always fair, especially for people of color. So I’m glad it worked out for him.”

USA Today is comparing Jussie Smollett to Christians being persecuted by Romans.

Jussie Smollett up for NAACP Award, Anthony Anderson hopes he wins

Posted in Uncategorized | Leave a comment

Who Is Steve Pieczenik?

I posted this video the week before the 2016 election. Who is this guy?

https://www.youtube.com/watch?v=siUm4cPj26s

Posted in Uncategorized | Leave a comment

Hitler Finds Out The Mueller Investigation Is Over

https://www.youtube.com/watch?v=7cVsmuxOj28

Posted in Uncategorized | Leave a comment

Slow Learners

Last spring, I pointed out that Greenland’s Jakobshavn Glacier has been growing since 2012, after 170 years of retreat.

https://go.nasa.gov/2ymBH5U

Our top highly paid experts have finally come around to accepting what 30 seconds of research on my part determined.

The waters around the mouth of the glacier – also known as Sermeq Kujalleq in Greenlandic – are now the coolest they have been since the 1980s. ”

At first we didn’t believe it,” said glaciologist Ala Khazendar of NASA’s Jet Propulsion Laboratory. “We had pretty much assumed that Jakobshavn would just keep going on as it had over the last 20 years.”

One Greenland Glacier Has Started Growing Again, But That Doesn’t Mean What You Think

But these people are prophets, and they know the future.

In a new paper, Khazendar and his team have identified the cause – and, yes, it is only temporary.

Unfortunately the don’t know the present.

Meanwhile, the rest of Greenland’s ice sheet is still receding

Greenland’s second largest glacier, the Petermann Glacier, has also been growing since 2012.

2012          2018

The entire island is gaining ice, but climate scientists never let facts get in the way of their junk science.

Greenland Ice Sheet’s 2017 weigh-in suggests a small increase in ice mass | NOAA Climate.gov

The climate clown show continues unabated. Whatever a climate scientist says, just assume the exact opposite is true.

Posted in Uncategorized | Leave a comment

NASA Tampering With Reykjavik Raw Temperature Data

The Arctic is very important for people pushing global warming, because that is where they claim most of the warming is occurring.

In NASA GISS Version 2 (V2) – Iceland was warmer in the 1940s than in recent years.

Data.GISS: GISS Surface Temperature Analysis

The current version V4 has massively cooled the past, to make it look like Iceland is warming.

Data.GISS: GISS Surface Temperature Analysis

This graph shows how NASA has rewritten Iceland’s history.

Spreadsheet

The next graph shows the magnitude of NASA tampering. The past has been cooled about 1C.

What is even more disturbing, is that NASA is now tampering with unadjusted data too. They also seem to have lost the pre-1961 and post-2004 unadjusted data. How does unadjusted data change and disappear over time?

Data.GISS: GISS Surface Temperature Analysis

NASA has a long history of tampering with Iceland temperature data, and the numbers continuously and dramatically change.

V2 adjusted.

V2 Adjusted

Here is another version of the V2 adjusted graph which was captured in 2012. It is different from the previous versions.

2012

And another version from 2014 – again different from the previous three versions, but with the 1940’s warmth removed.

2014

A fifth version was captured during October 2017, with the 1940’s warmth still removed in their final, homogenized data.

October 2017 V3 Measured Vs Homogenized

The May 2018 NASA homogenized graph had restored most of the 1940’s warmth – indicating that there was never any reason to tamper with the data.

May 2018 Measured Vs. Homogenized

But the July 2018 NASA adjusted temperature graph removed the 1940’s warmth.

May 2018 Measured Vs. Adjusted

The person in charge at the Icelandic Met Office said four years ago : The GHCN “corrections” are grossly in error in the case of Reykjavik.

From: Trausti Jónsson

To: paul homewood

Cc: Halldór Björnsson

Sent: Monday, 23 January 2012, 17:40

Subject: Re: monthly temperatures

Hi Paul.We have sent a questions to the GHCN database regarding this and they will look into the problem. Regarding your questions:

a) Were the Iceland Met Office aware that these adjustments are being made?No we were not aware of this.

b) Has the Met Office been advised of the reasons for them?No, but we are asking for the reasons

c) Does the Met Office accept that their own temperature data is in error, and that the corrections applied byGHCN are both valid and of the correct value? If so, why?

The GHCN “corrections” are grossly in error in the case of Reykjavik but not quite as bad for the other stations. But we will have a better look. We do not accept these “corrections”.

d) Does the Met Office intend to modify their own temperature records in line with GHCN?No.

No changes have been made in the Stykkisholmur series since about 1970, the Reykjavík and Akureyri series that I sent you have been slightly adjusted for major relocations and changes in observing hours. Because of the observing hour changes, values that where published before 1924 in Reykjavík and before 1928 in Akureyri  are not compatible with the later calculation practices. For other stations in Iceland values published before 1956 are incompatible with later values except at stations that observed 8 times per day (but the differences are usually small). The linked paper outlines these problems (in English):

http://www.vedur.is/media/vedurstofan/utgafa/greinargerdir/1995/Climatological1960.pdf

The monthly publication Vedrattan 1924 to 1997 (in Icelandic) is available at:

http://timarit.is/view_page_init.jsp?pubId=278&lang=is&navsel=666

and earlier data (in Icelandic and Danish – with a summary in French) at:

http://timarit.is/view_page_init.jsp?pubId=240&lang=is&navsel=666

http://timarit.is/view_page_init.jsp?pubId=241&lang=is&navsel=666

Monthly data from all stations from 1961 onwards :

http://www.vedur.is/Medaltalstoflur-txt/Manadargildi.html

Best wishes,

Trausti J.

The reason it is so important for climate scientists to make the 1940’s warmth disappear, is that it shows what actually drives the climate – and destroys their multi-billion dollar scam.

Reykjavik GISS V2             AMO

di2.nu/foia/1254108338.txt

Posted in Uncategorized | Leave a comment

NASA Now Tampering With Raw Data Too

The NASA GISS V2 temperature graph for Nuuk, Greenland showed a significant cooling trend since the 1930s.

Data.GISS: GISS Surface Temperature Analysis

The V4 unadjusted data now shows no cooling trend.

GHCN-Unadjusted is the raw data as reported by the weather station.

Data.GISS: GISS Surface Temperature Analysis

This next graph overlays the V4 data on the V2 data (blue.)  You can see how they cooled the past and warmed the present in the V4 “unadjusted” data, in order to make the cooling go away.


The next graph shows how NASA has altered the raw data.  For some reason, the data file for V4 only goes from 1961 to 2010.  I have no idea why that is, but you can see the spectacular data tampering NASA is doing.

This is the first time I have seen NASA or NOAA tampering with raw data.  They seem to be entering a whole new realm of scientific fraud.  This is new with V4. The V3 version below was still accurate.

Data.GISS: GISS Surface Temperature Analysis

They also don’t know where the station is any more, and have deep sixed it into the ocean. Along with their integrity.

Posted in Uncategorized | Leave a comment

The Russians Are Coming, The Russians Are Coming

The Russians are Coming. The Russians are Coming

Posted in Uncategorized | Leave a comment

The Polar Bear Catastrophe That Never Happened

The Polar Bear Catastrophe That Never Happened: Susan Crockford: 9780993119088: Amazon.com: Books

Posted in Uncategorized | Leave a comment

Eleven Years And Ten Months Left

The Green New Deal suffered a bit of  a setback yesterday, when none of it’s 100 Democratic sponsors voted for it.

But we were warned a long time ago.  In 1989, the British Commonwealth said that only global communism could prevent massive sea level rise by the year 2030.

GOVERNMENTS must yield national sovereignty to multilateral authorities able to enforce laws “across environmentally invisible frontiers”

A Commonwealth Expert Group set up to look at climate change estimated there was a 90 per cent certainty that    …. sea levels would rise by between one and four metres, by the year 2030.

Who would house the displaced populations of low lying areas like the Maldives, a chain of 1200 islands barely above sea level? Current attitudes to refugees and immigrants in most countries did not suggest that large population movements were feasible. Acceptance of an enhanced risk of large scale drowning was clearly not an option.

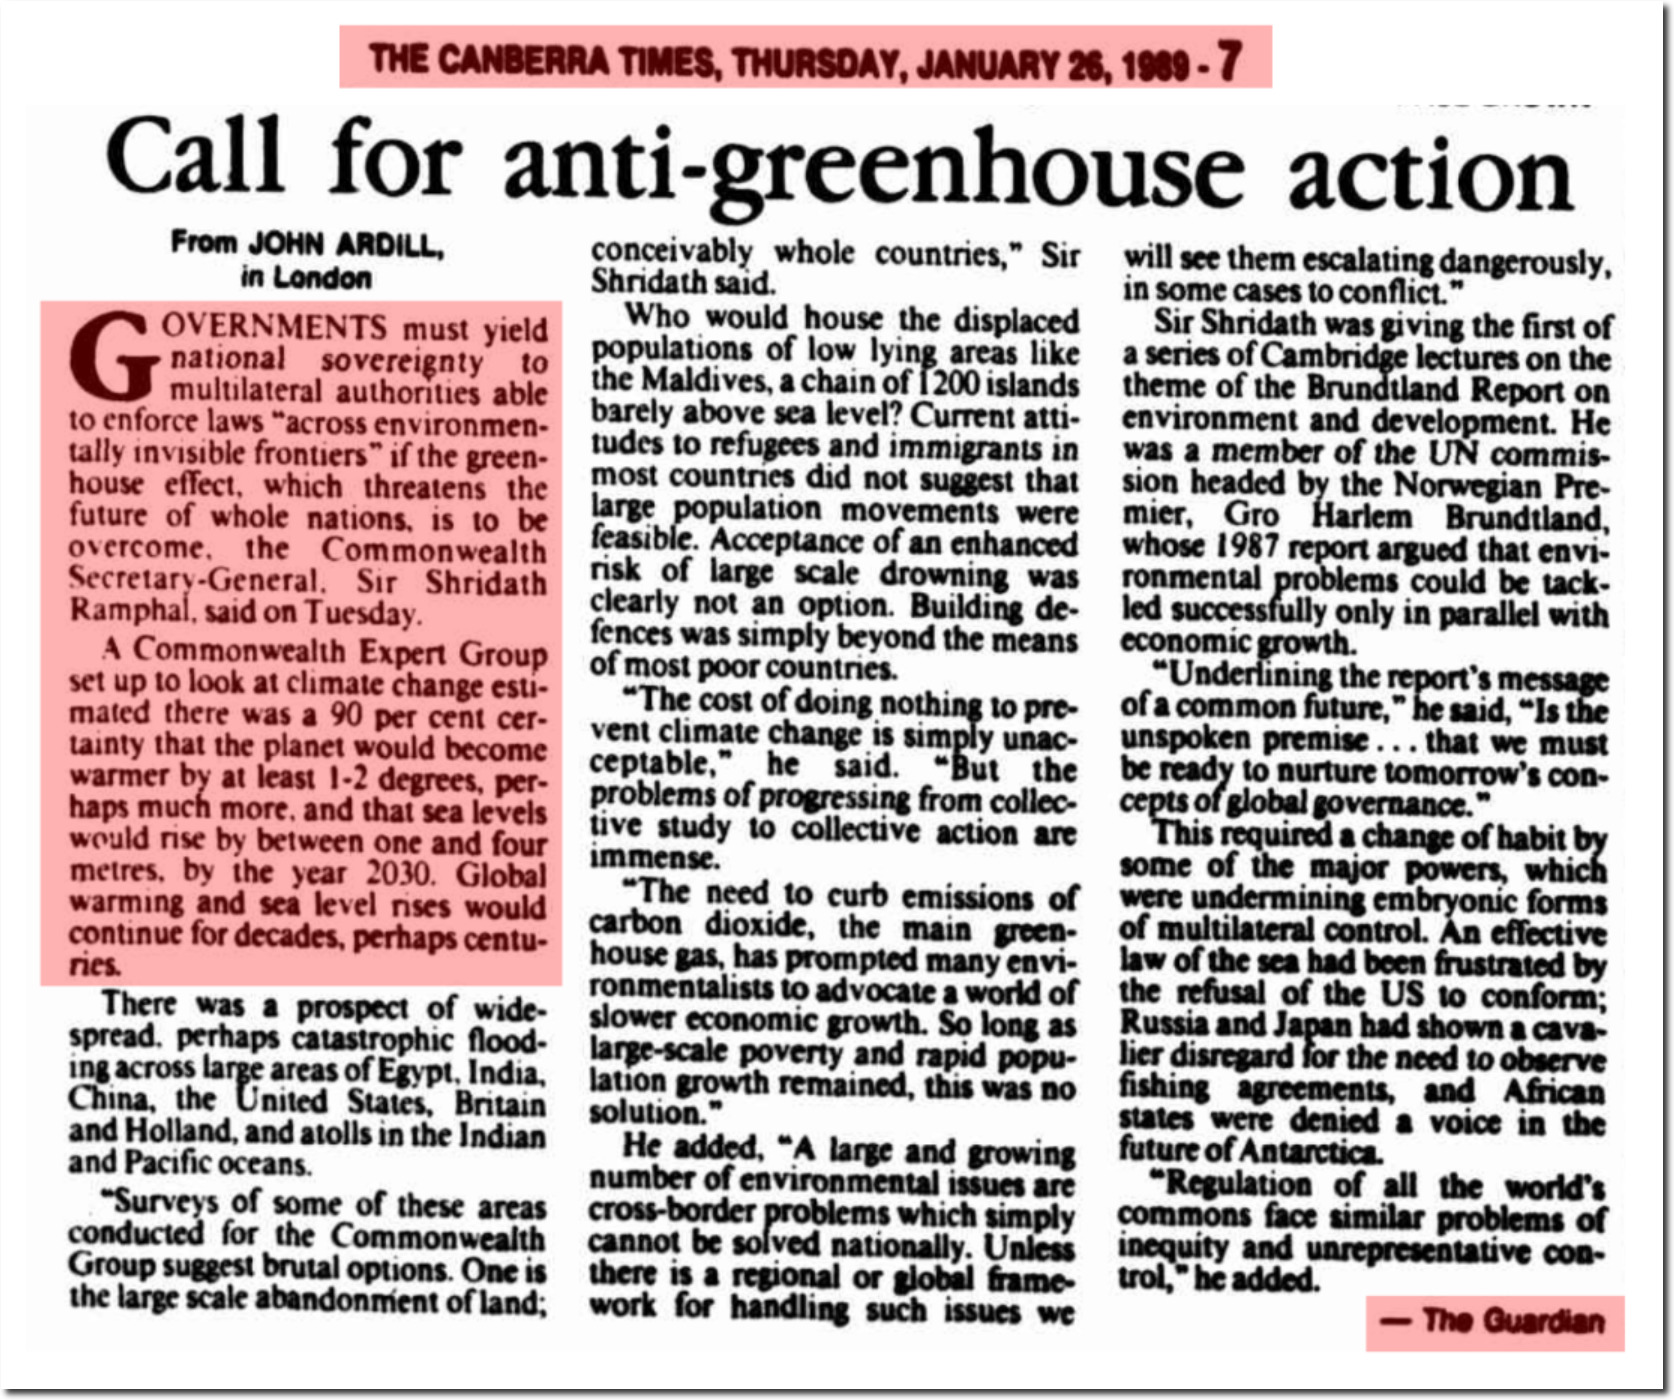
26 Jan 1989 – Call for anti-greenhouse action – Trove

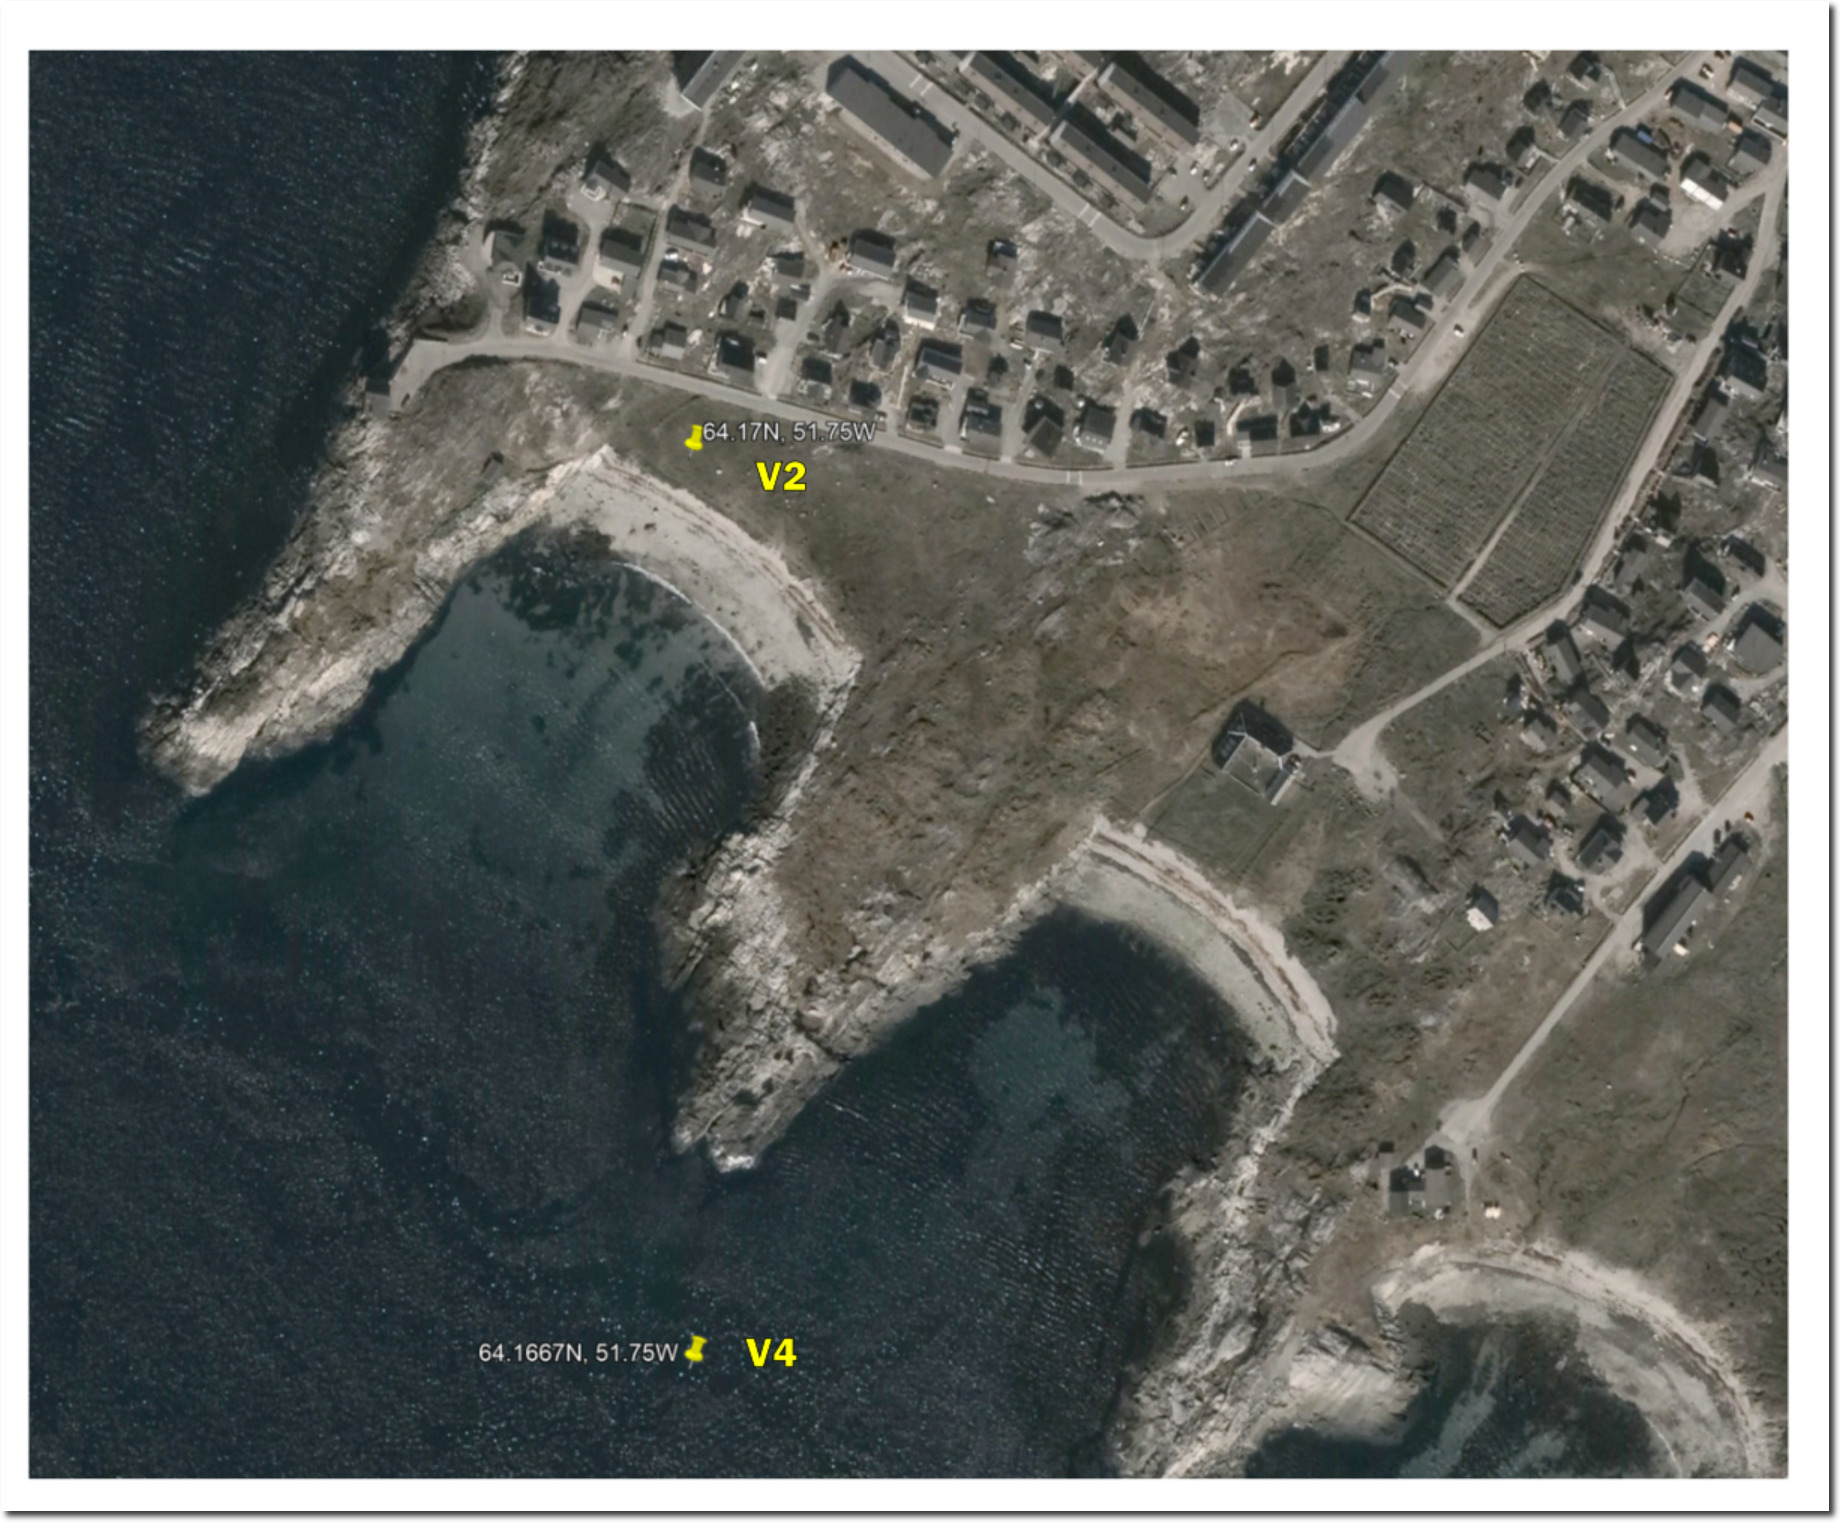
The Canberra Times said the Maldives would be underwater by 2018.

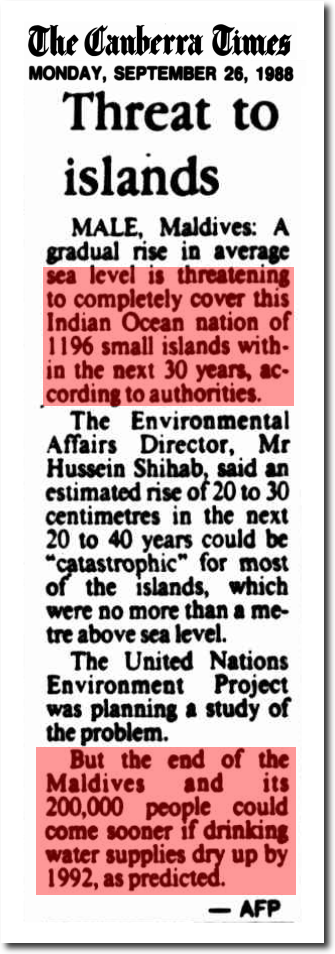
26 Sep 1988 – Threat to islands

This was a little more optimistic than the UN forecast, which predicted the end of civilization by the year 2000.

A senior U.N. environmental official says entire nations could be wiped off the face of the Earth by rising sea levels if the global warming trend is not reversed by the year 2000.

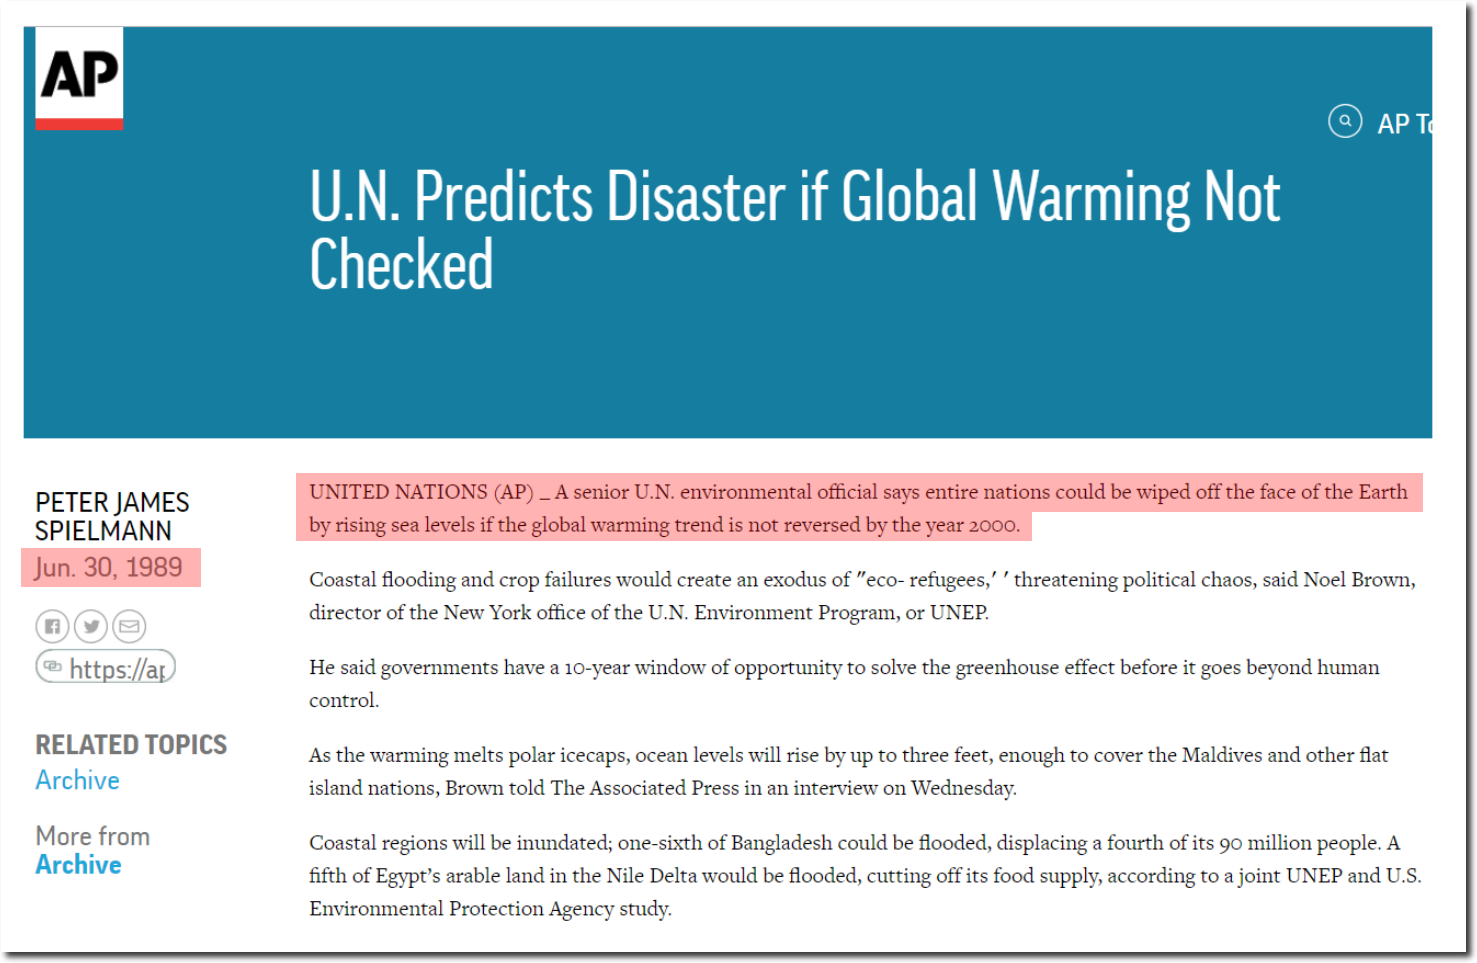
U.N. Predicts Disaster if Global Warming Not Checked

The link between communism and controlling sea level should be obvious to anyone currently attending a state funded school. And the New York Times says people like the idea of giving up air travel, their car, their income, and a reliable supply of energy.  Who needs heat anyway, when it is -38 degrees in Illinois?

Opinion | People Actually Like the Green New Deal – The New York Times

Posted in Uncategorized | Leave a comment