This is the second part of my series exposing fraud in the National Climate Assessment. In the first part, I discussed graph B (US Heat Waves) on their summary page 38. In this part I am discussing graph F (Arctic Sea Ice Extent.)
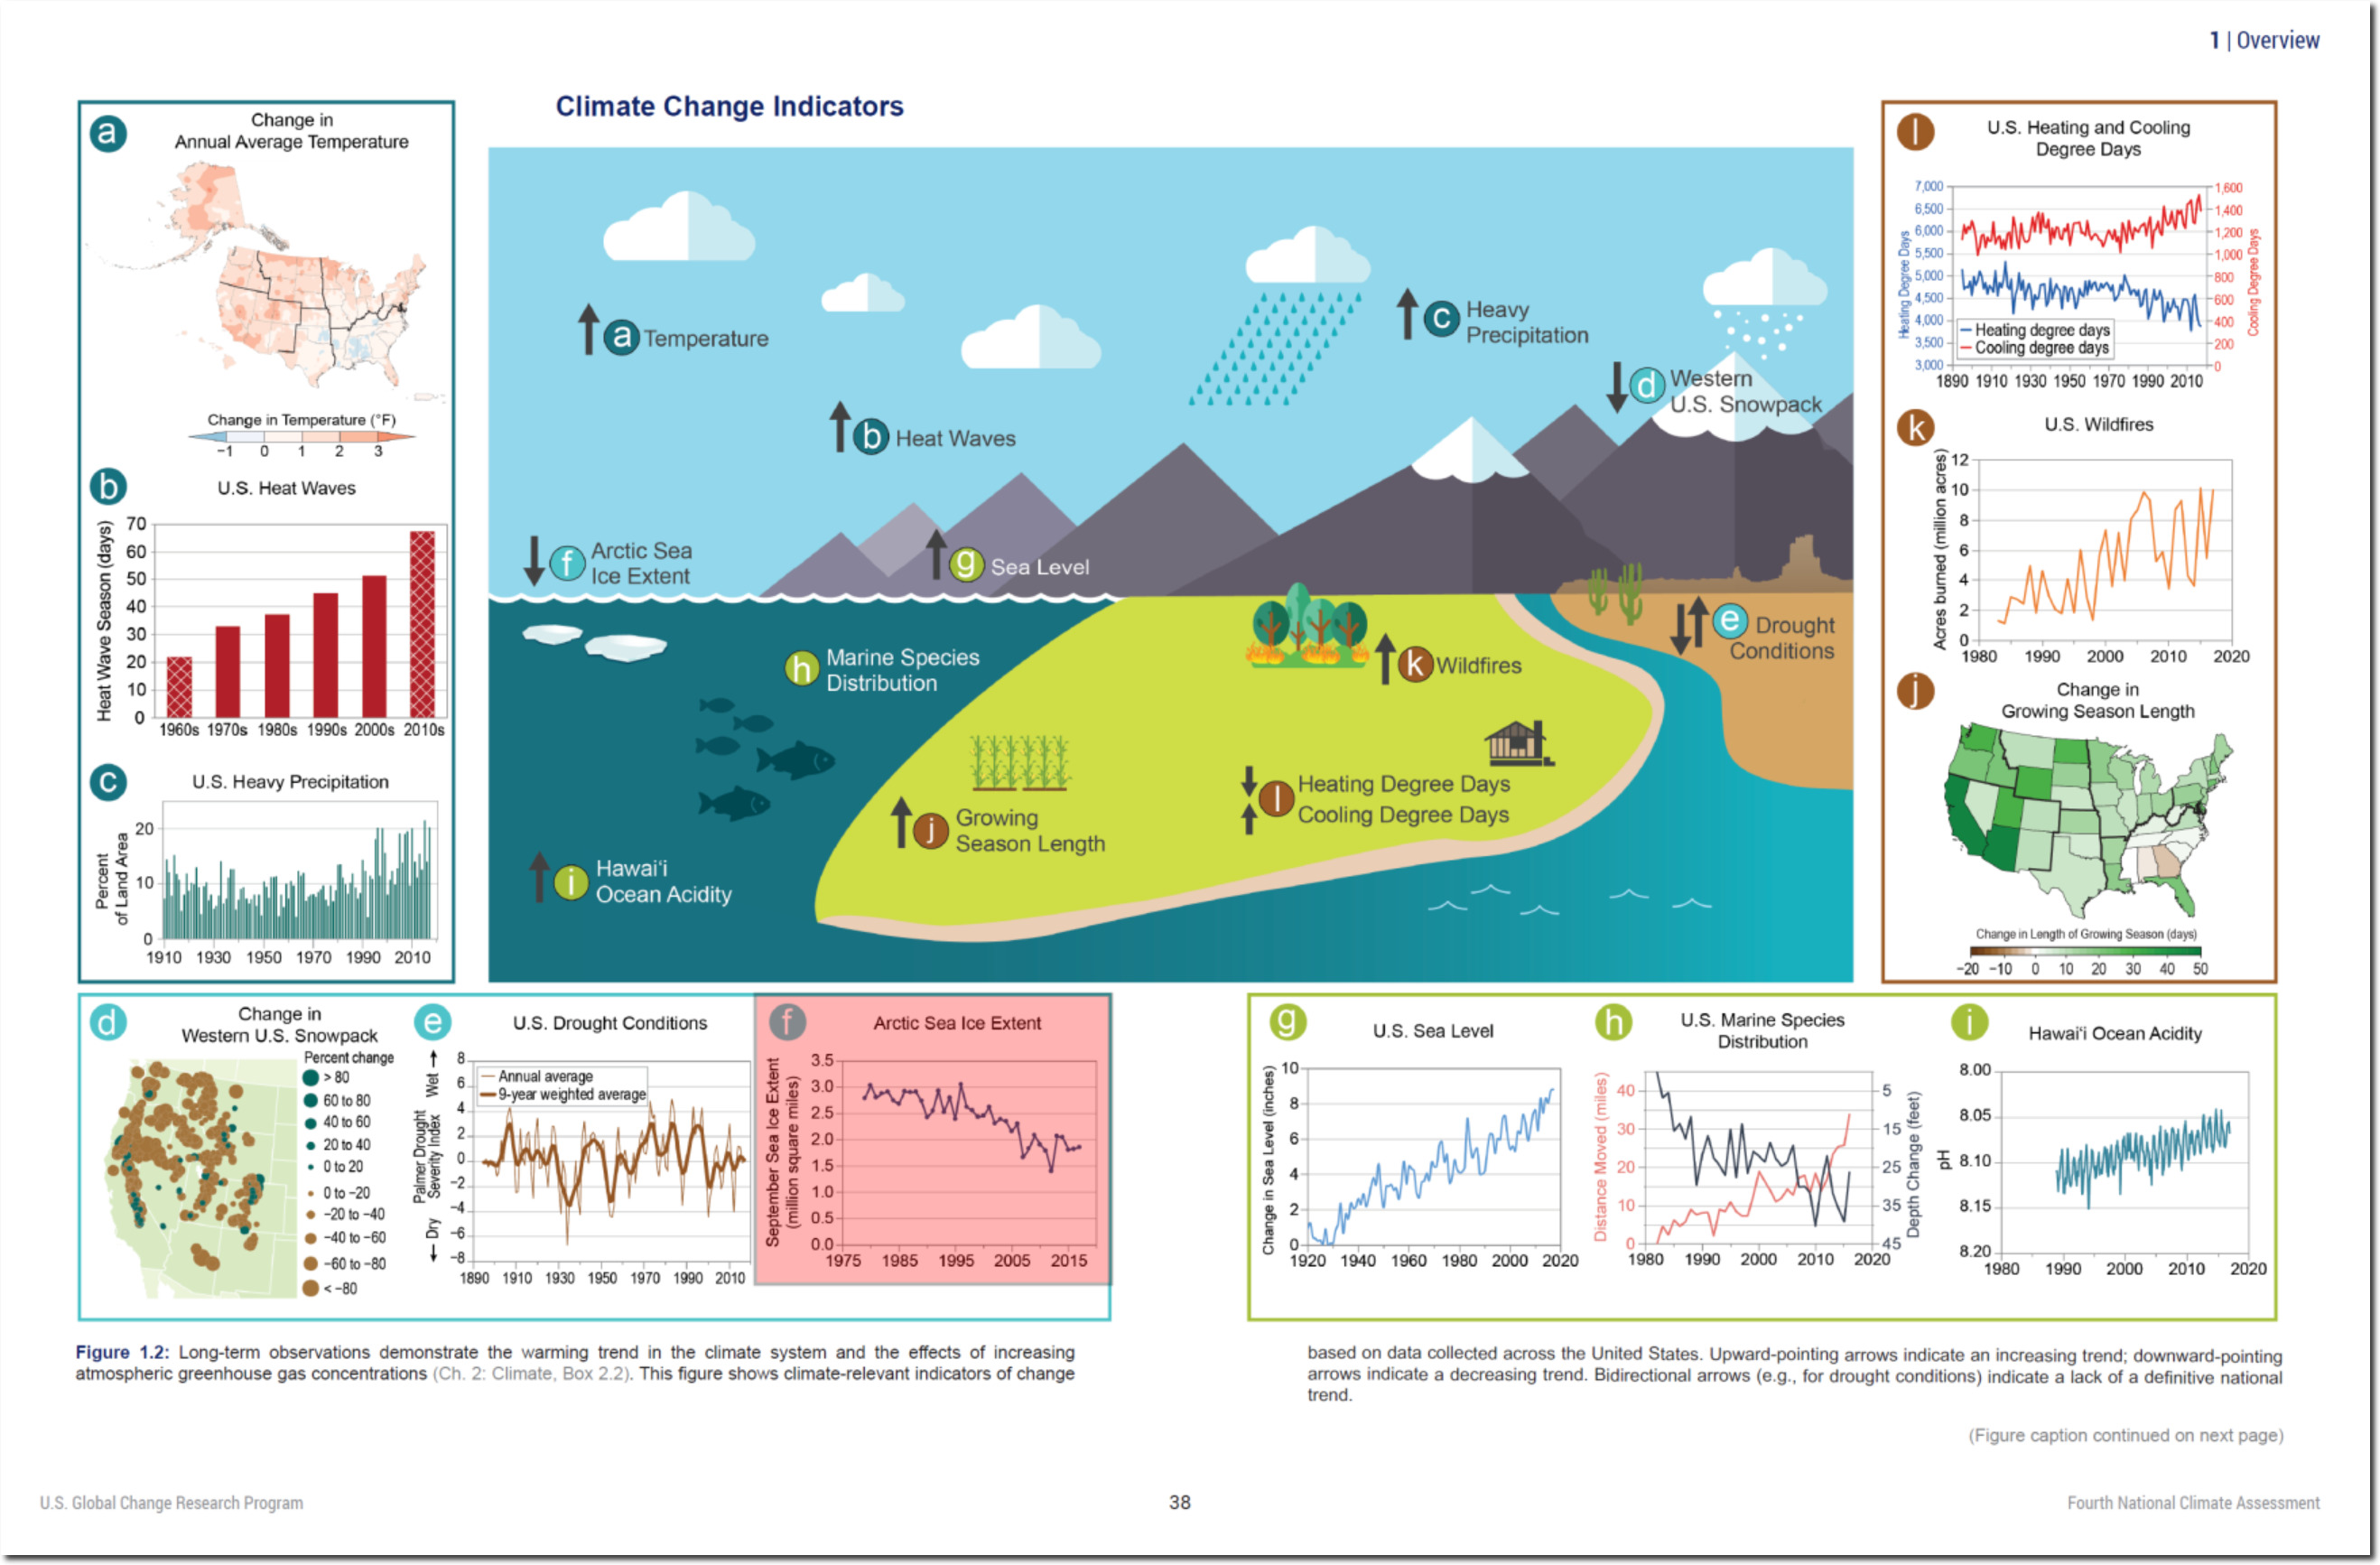
Fourth National Climate Assessment
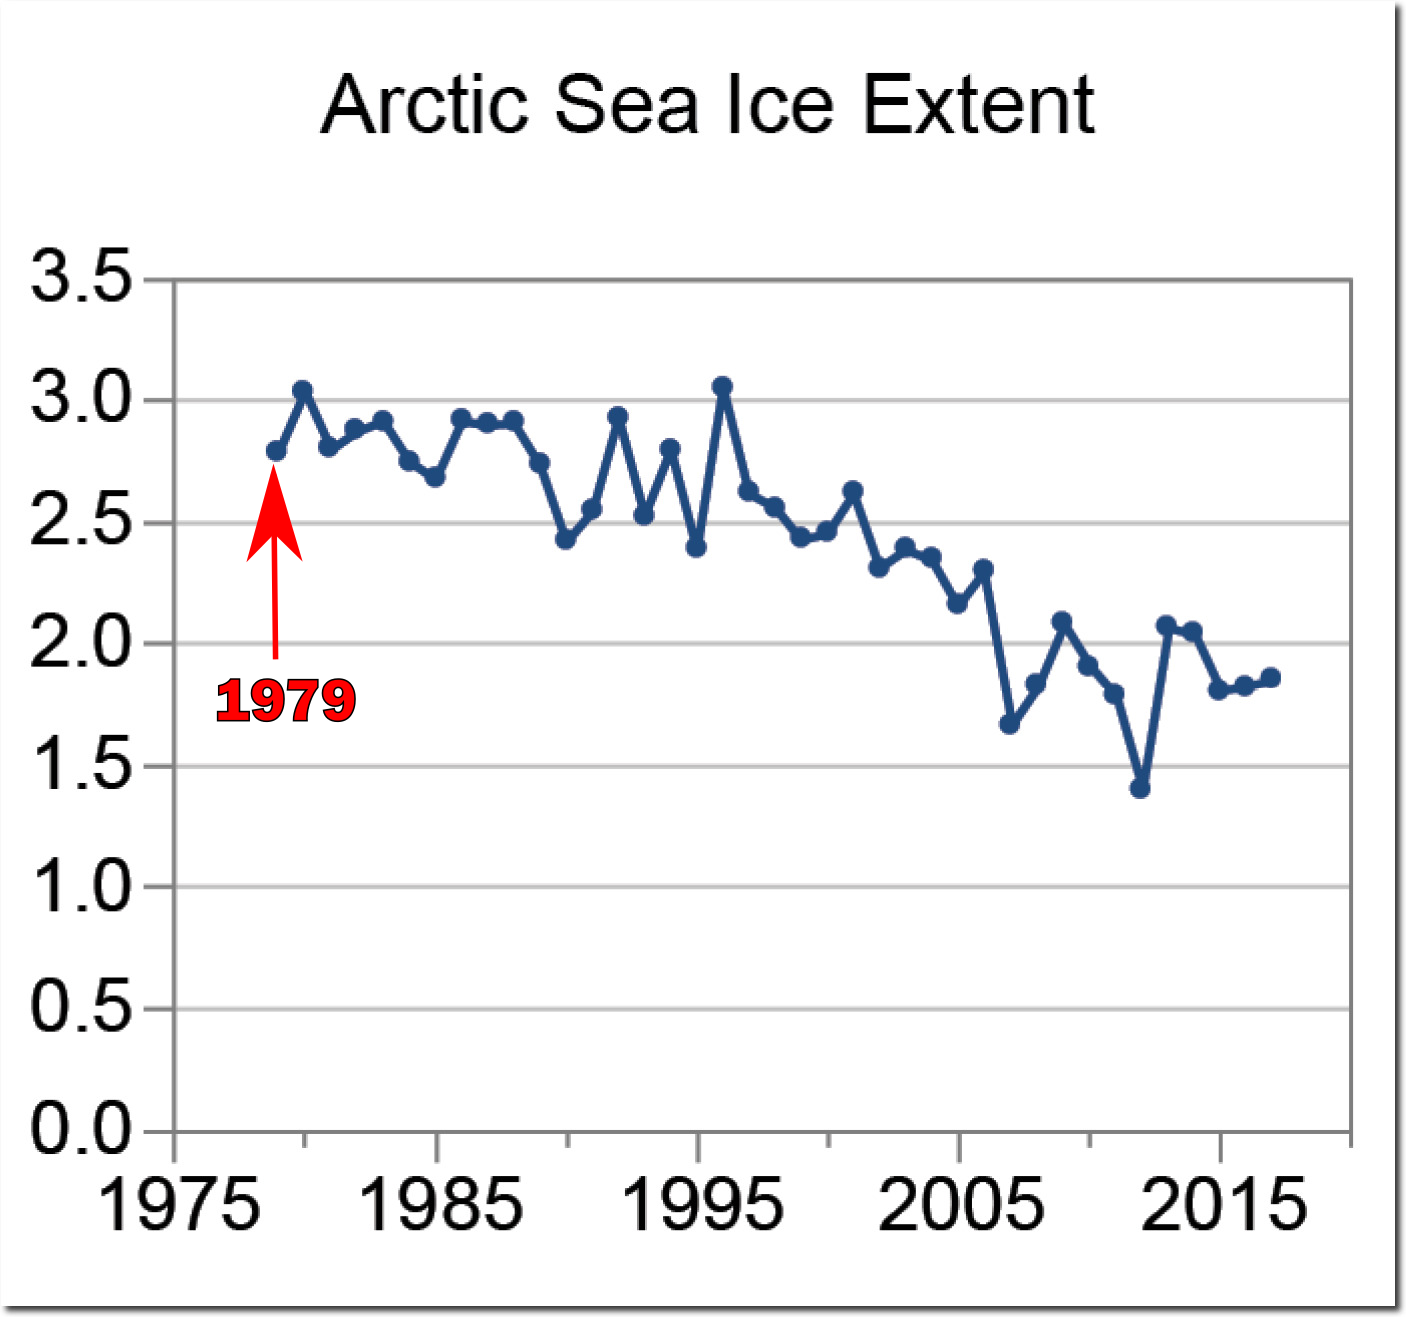
The graph shows a 50% decline in Arctic sea ice extent from 1979 to 2012, though they do not specify any units on the y-axis.
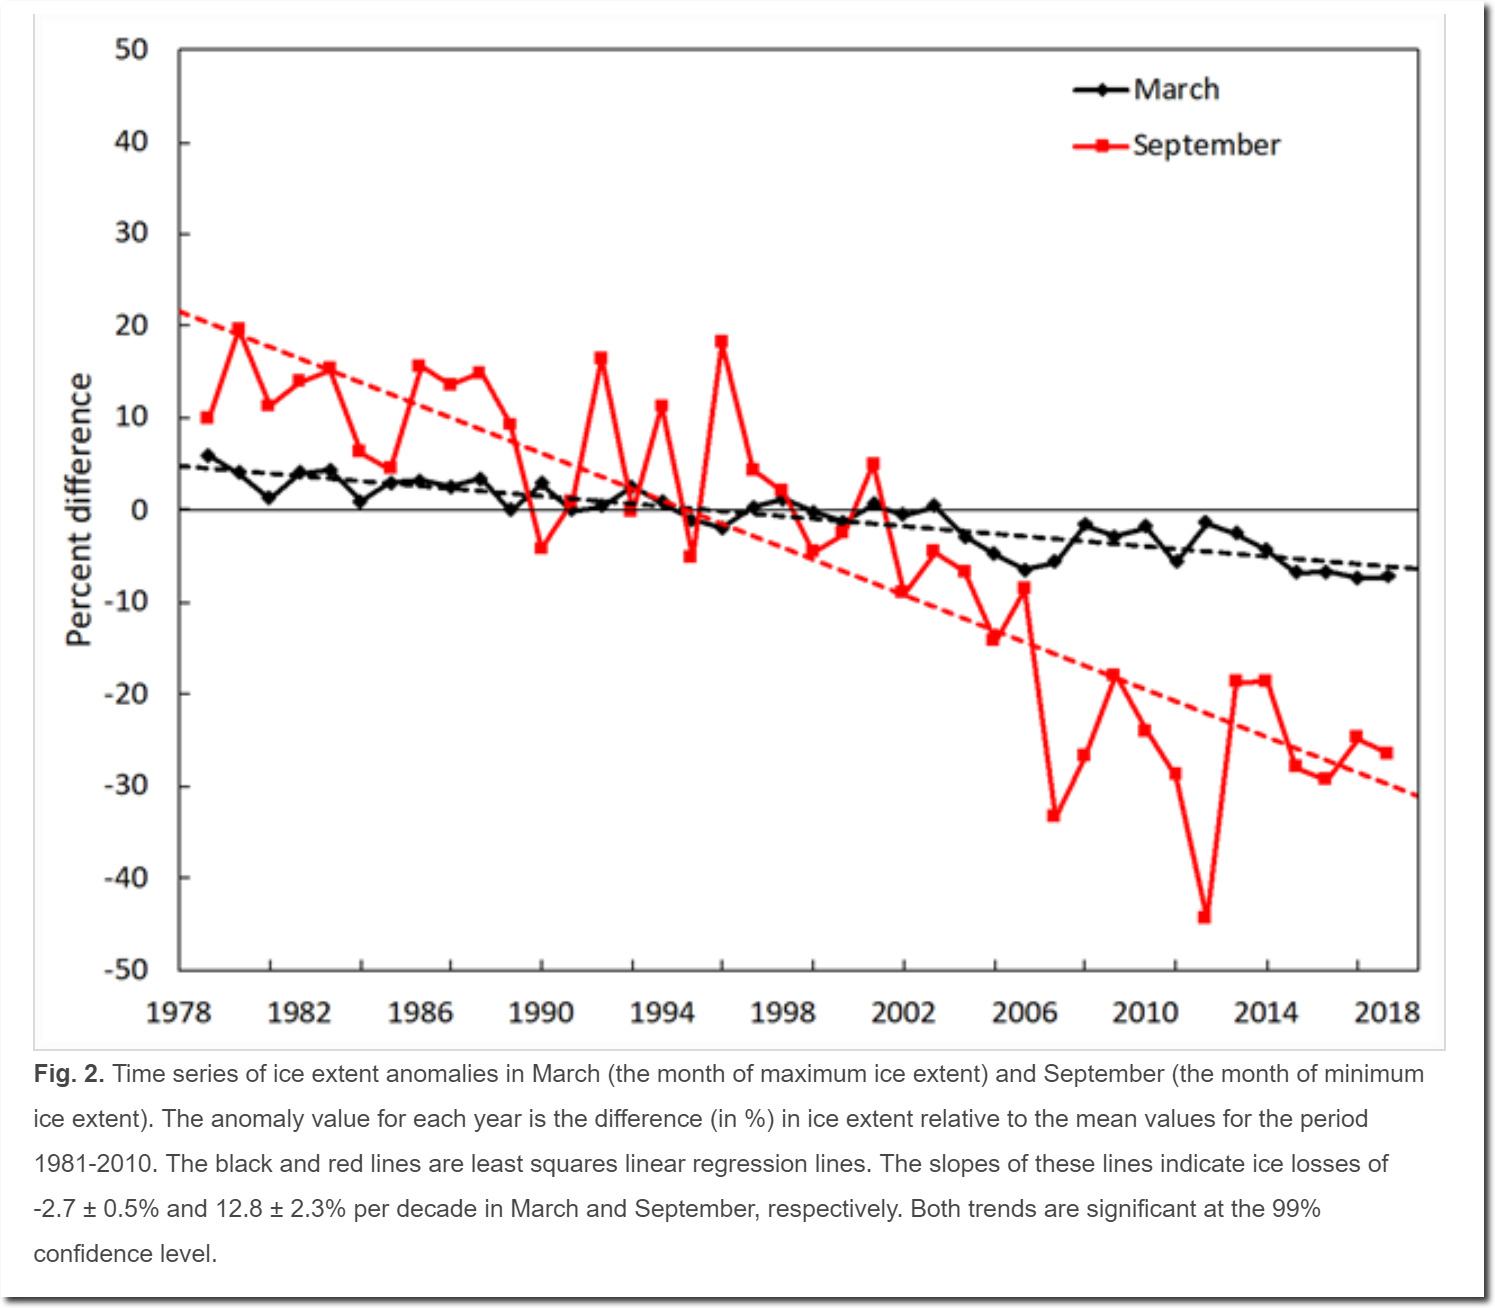
The graph was probably derived from the NOAA Arctic Report Card. which says
The Arctic sea ice cover continues the declining trends in the summer maximum and winter minimum extents. In 2018, the summer extent was the sixth lowest and the winter extent was the second lowest in the satellite record (1979-2018).
Sea Ice
The claim that satellite record begins in 1979 is incorrect, as the 1990 IPCC report showed NOAA satellite sea ice data since the early 1970s.
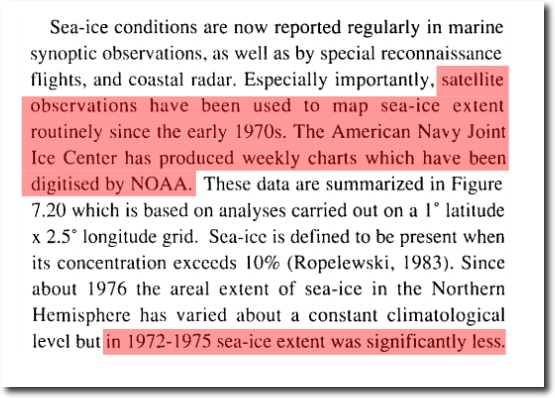
satellite observations have been used to map sea-ice extent routinely since the early 1970s. The American Navy Joint Ice Center has produced weekly charts which have been digitised by NOAA.
in 1972-1975 sea-ice extent was significantly less.
NOAA and the National Climate Assessment are hiding the pre-1979 data, probably because extent was “significantly less.” The figures below from the 1990 IPCC report, show the data which is being hidden.
1990 IPCC Report
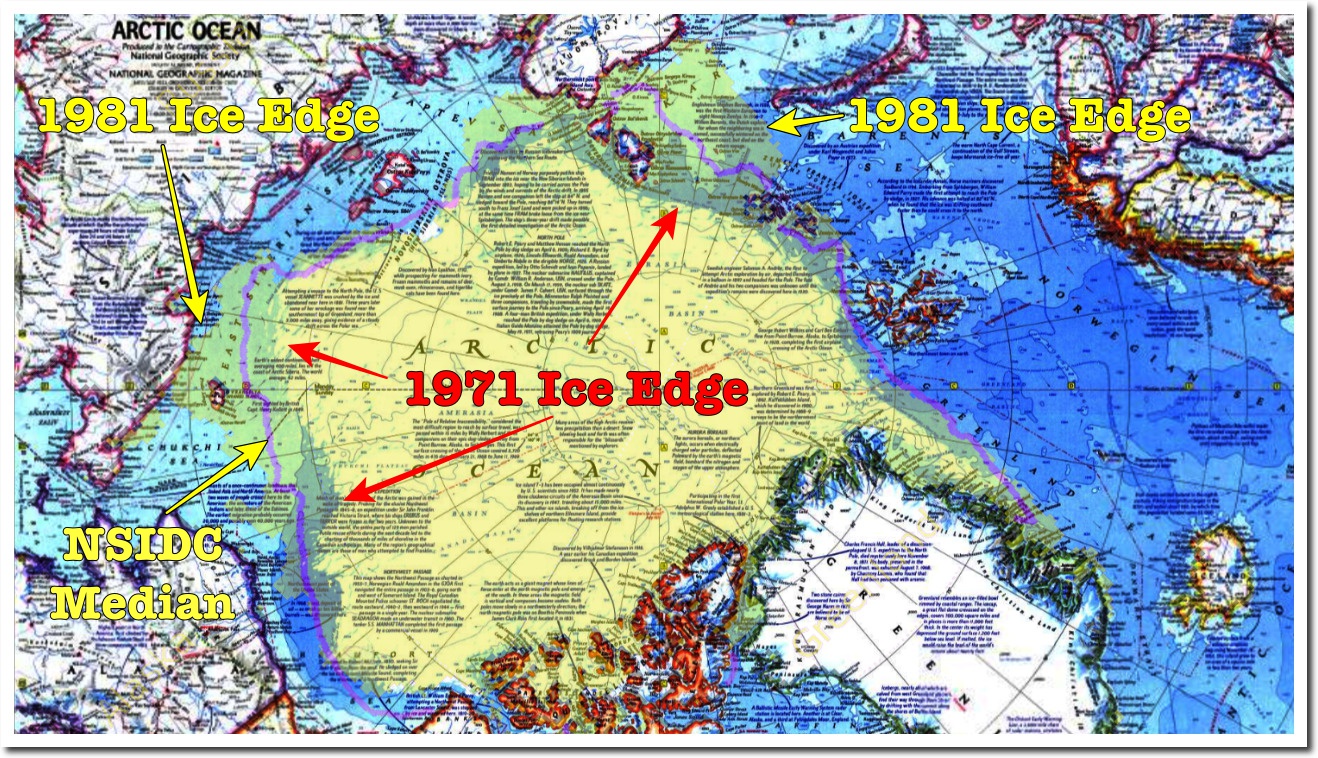
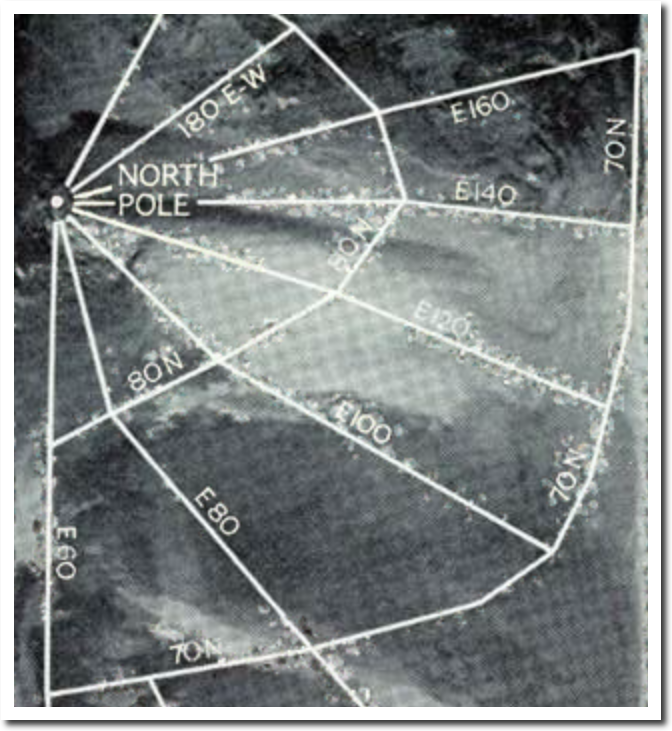
In 1971, National Geographic published this map of Arctic sea ice.
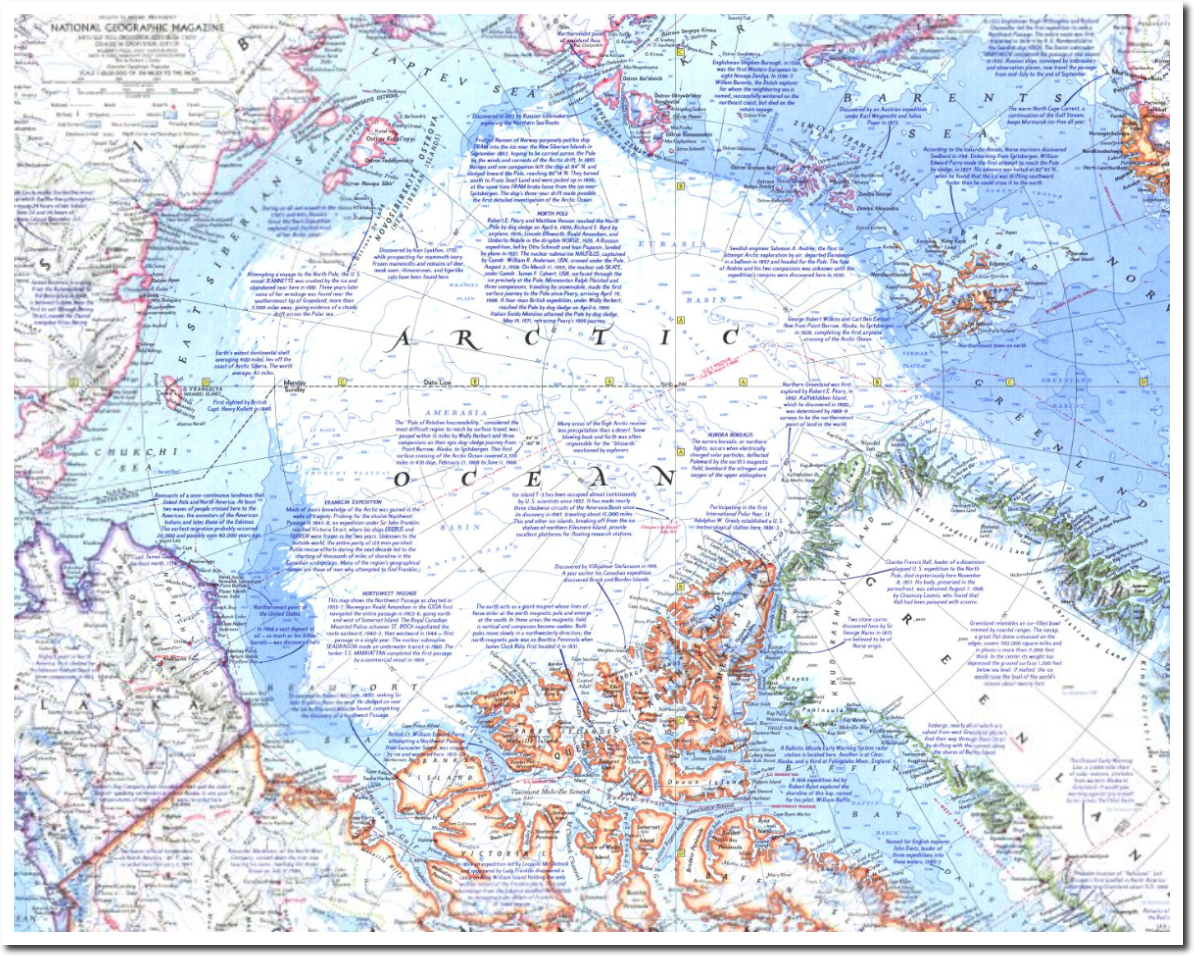
1971
Let’s compare that with ten years later, at the minimum on September 16, 1981.
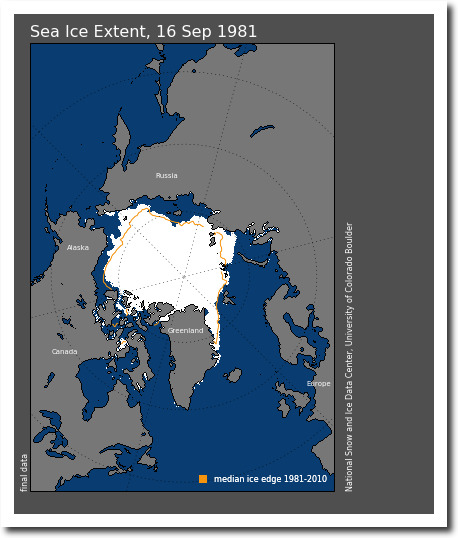
N_19810916_extn_v3.0.png (420×500)
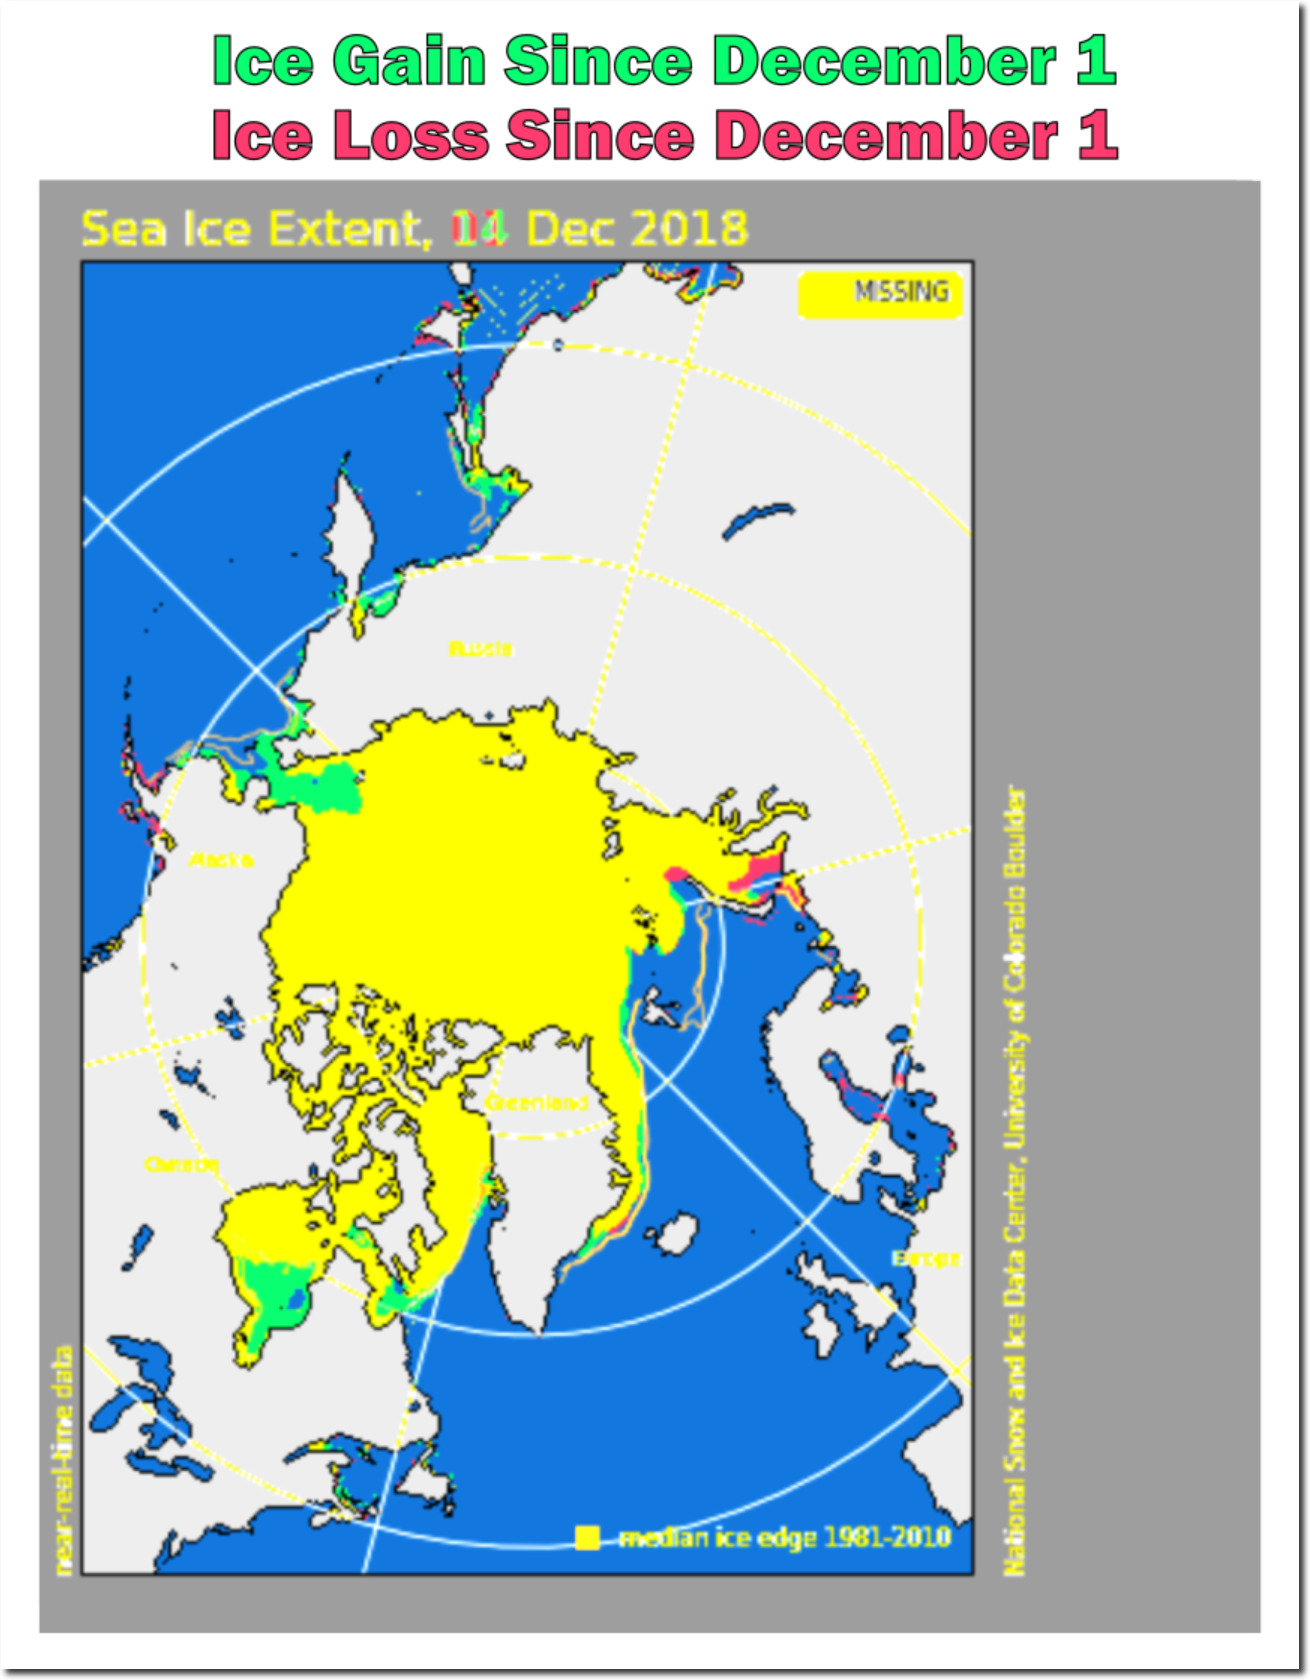
There was a large expansion of Arctic sea ice over the decade from 1971 to 1981.
The 1981 ice edge extended hundreds of miles past the 1971 ice edge. Even more telling is what NSIDC describes as the “1981-2010 median ice edge” – which extends far outside the 1971 edge. It is clear there was a lot less ice in 1971, which is why NOAA, Katharine Hayhoe, Michael Mann and their cohorts at the National Climate Assessment don’t want you to know about it.
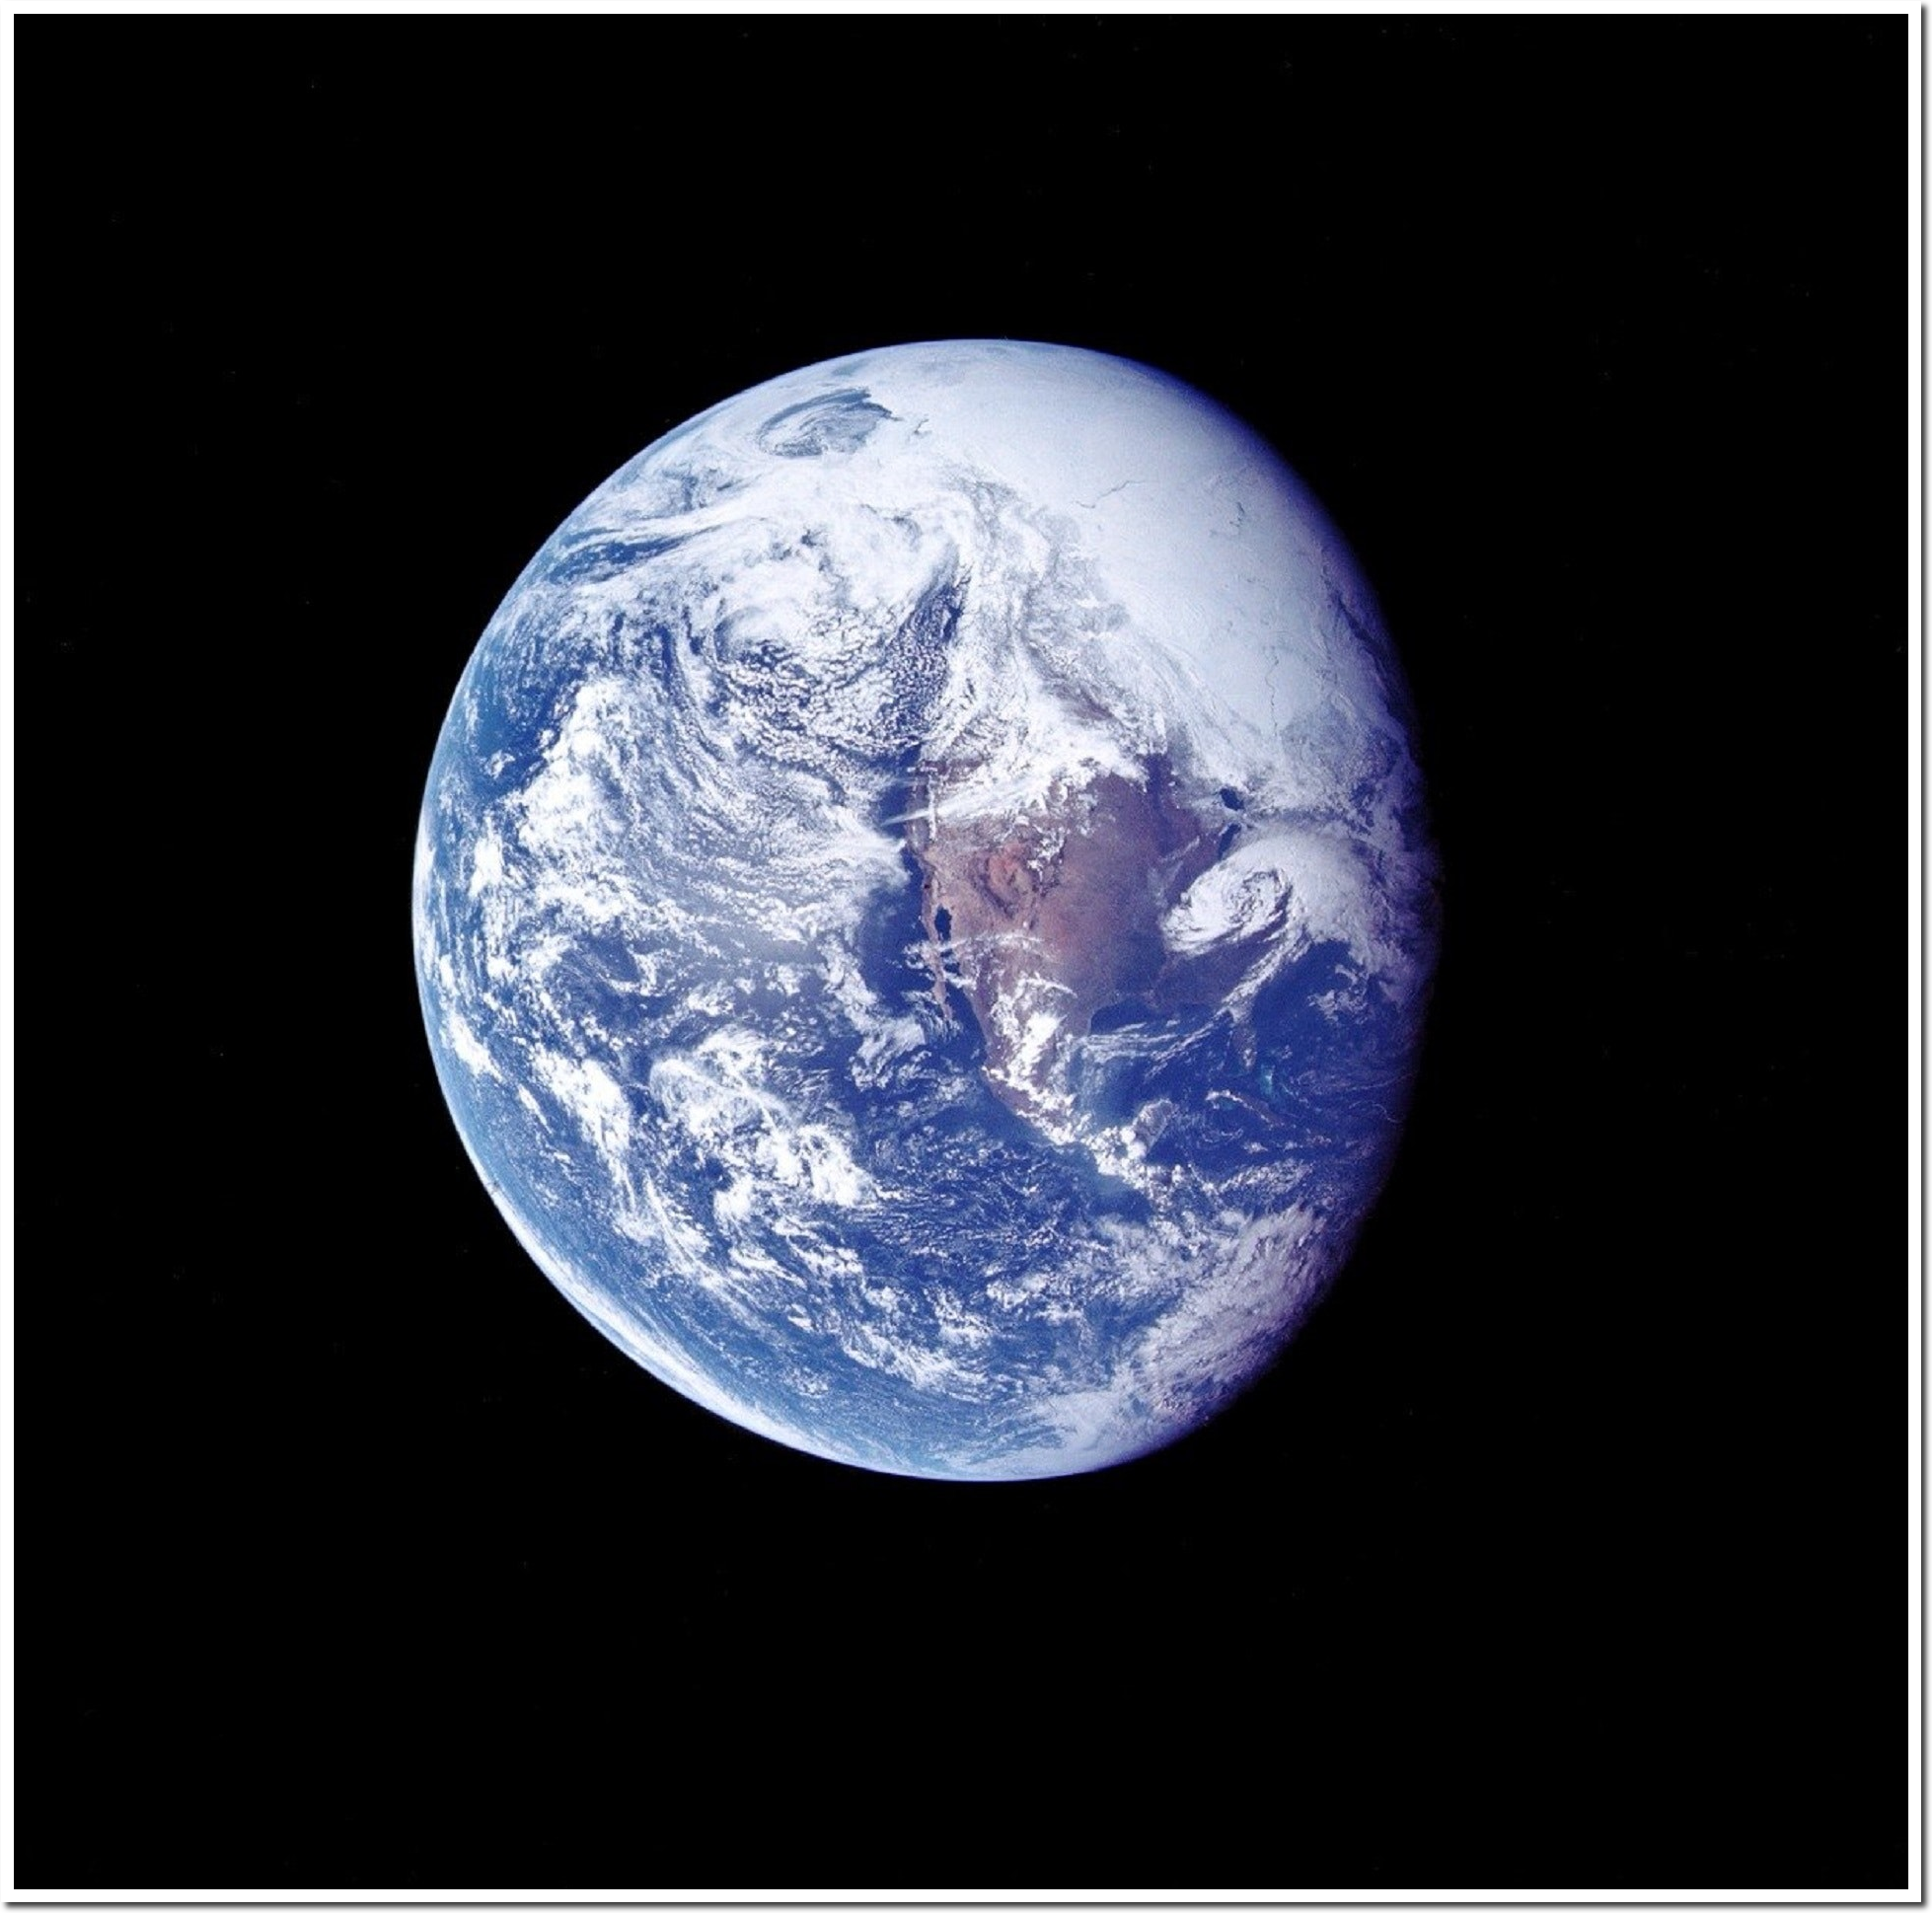
It shouldn’t surprise anyone that we have satellite data for Arctic sea ice ice prior to 1979, because we went to the moon in 1969. Here is a beautiful photo of Arctic sea ice taken by Apollo 16 in 1972, seven years before 1979.
In 1965, National Geographic published Arctic satellite imagery – fourteen years before the fake National Climate Assessment start date of 1979.
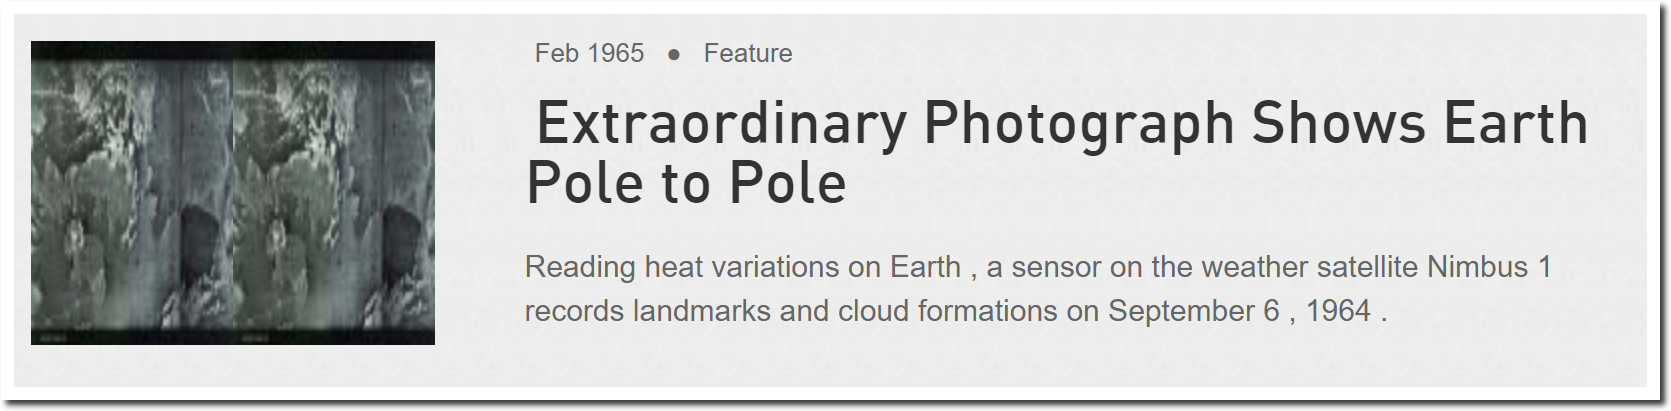
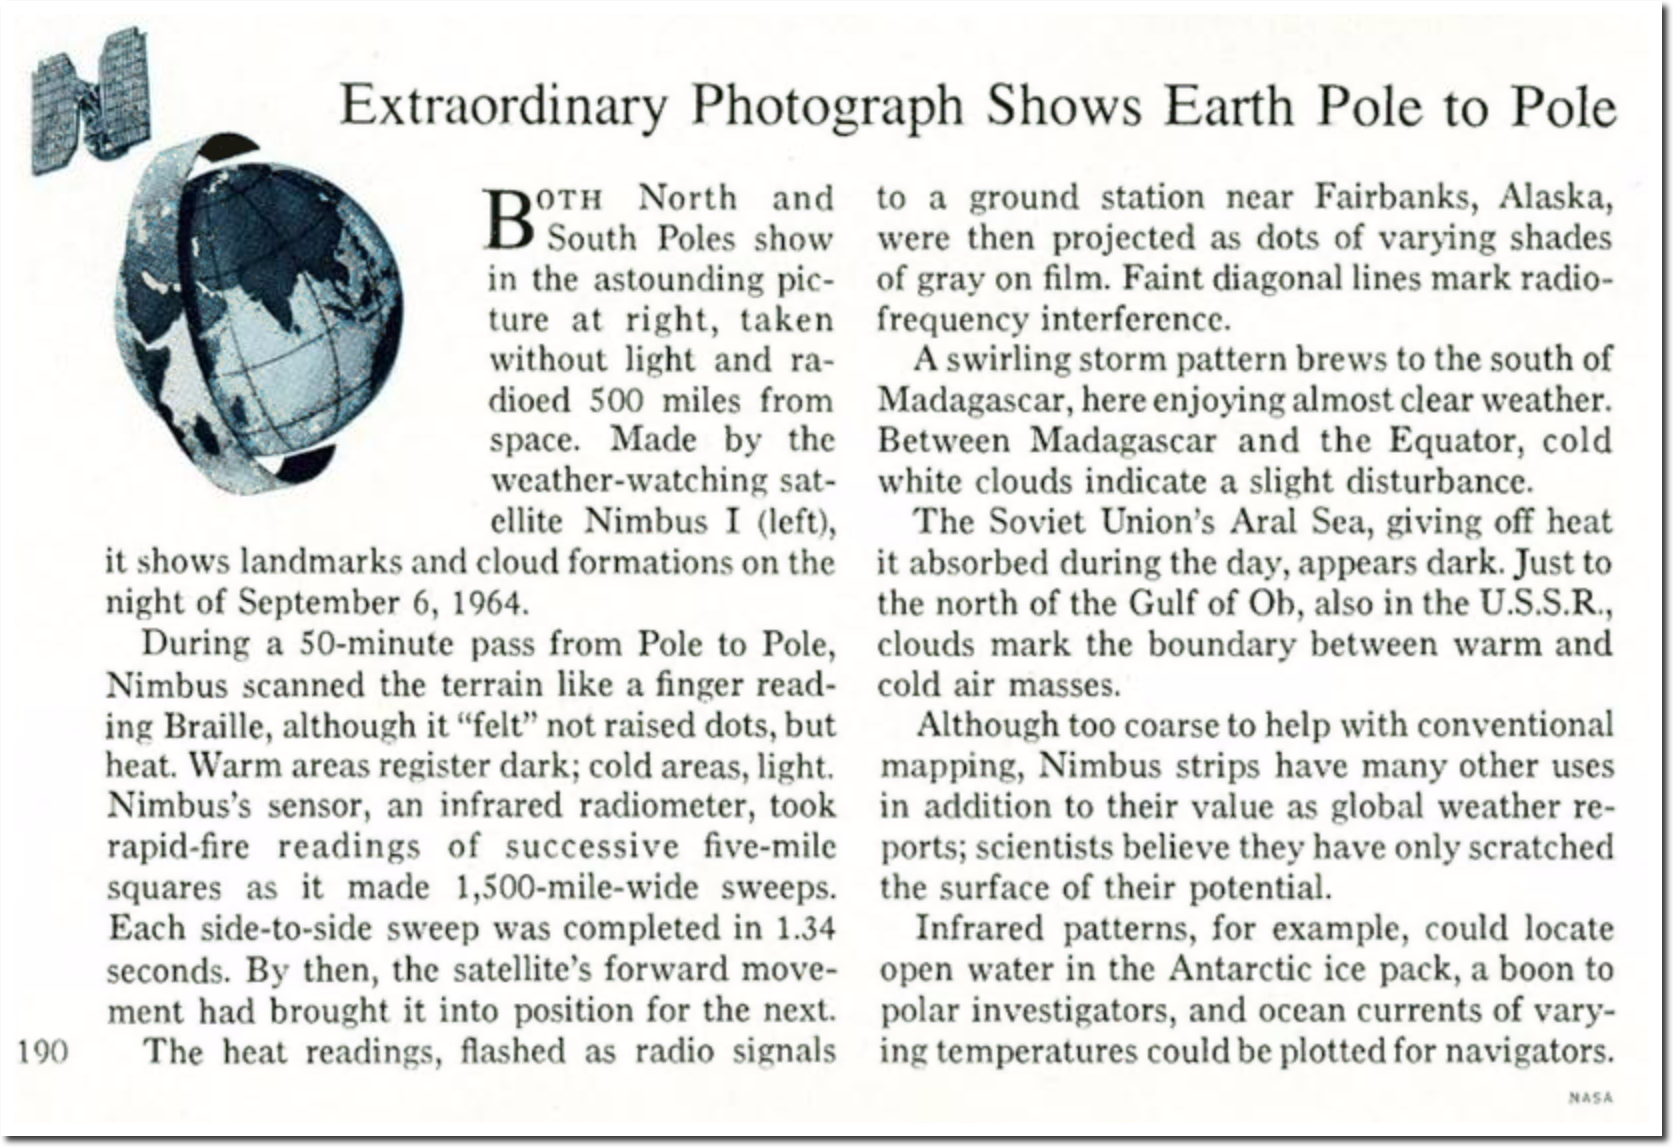
The National Geographic Archive | February 1965 | page 1
This satellite imagery of Antarctic sea ice from 1976 shows how detailed the data was, and also shows that there was almost no Antarctic sea ice remaining during the summer – near the peak of the 1970s ice age scare.
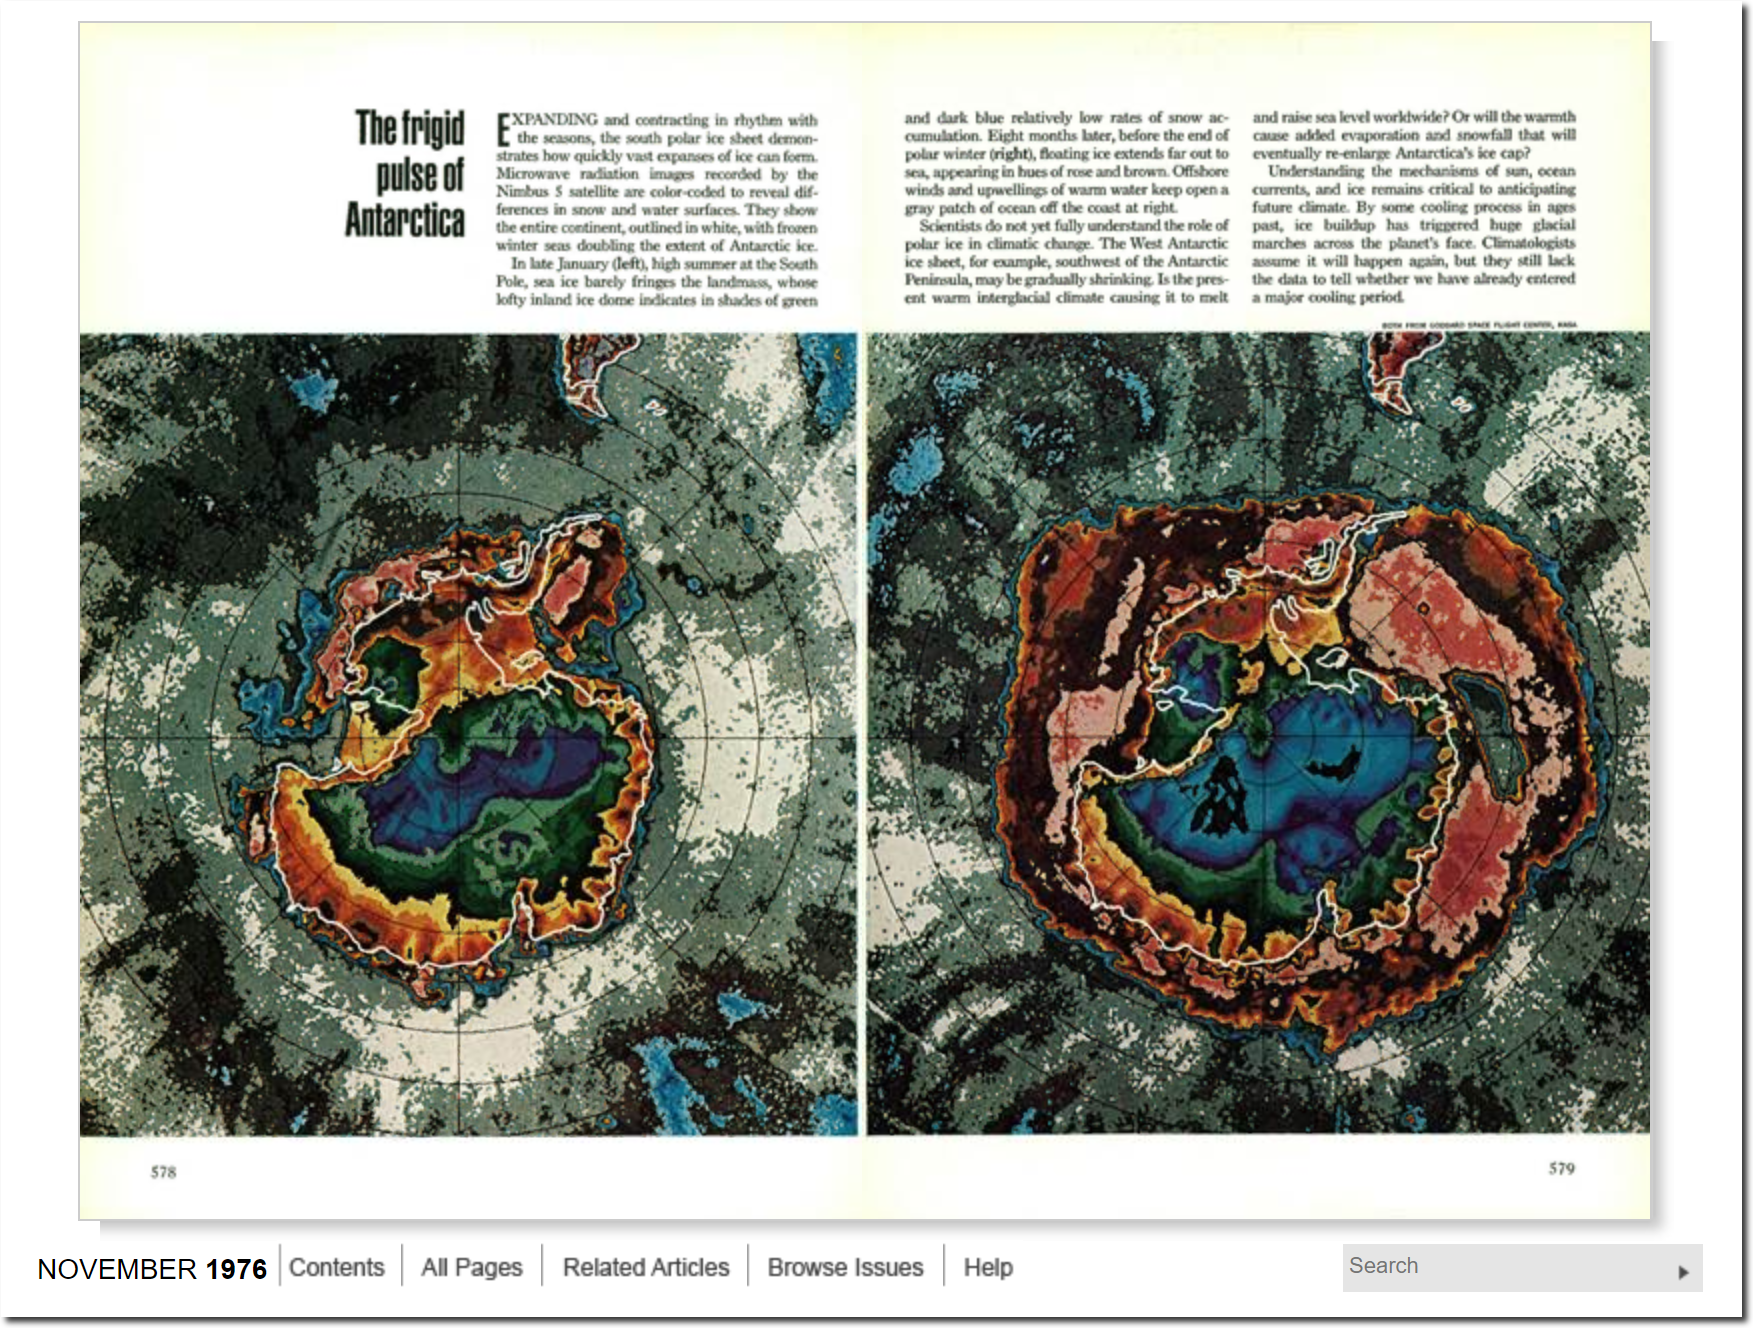
The National Geographic Archive | November 1976 | page 1
But the data hiding story gets even worse. During the decade prior to 1975, Arctic sea ice extent increased by 12% – so extent was even lower prior to 1975. By 1975, Icelandic Ports were blocked with ice for the first time in a century, and climate scientists were warning of a new ice age. So we know that sea ice extent was much lower prior to the 1970s.
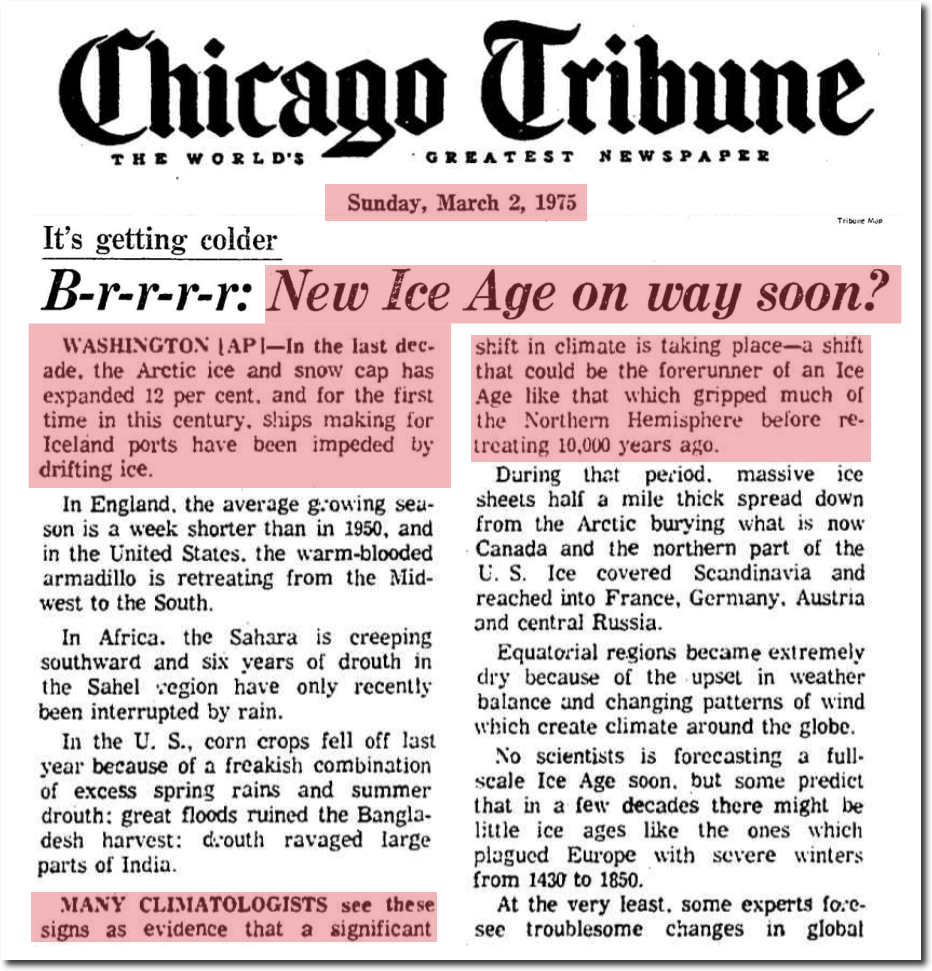
March 2, 1975 – B-r-r-r-r: New Ice Age on way soon? | Chicago Tribune Archive
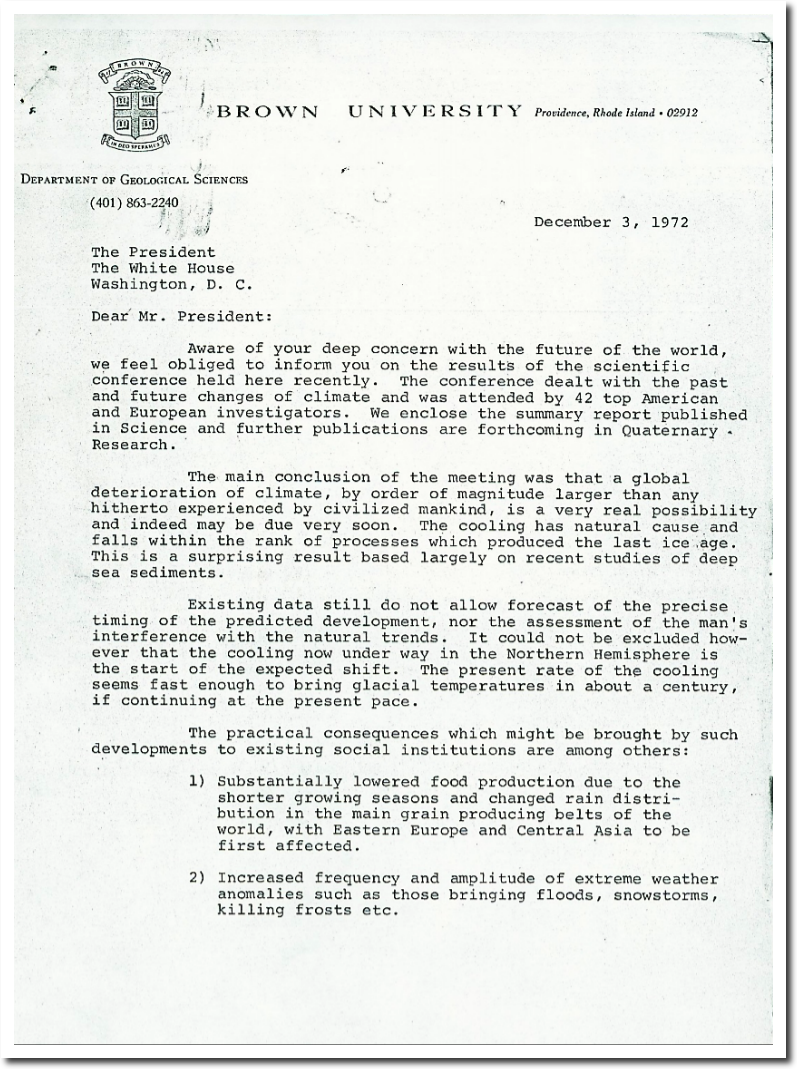
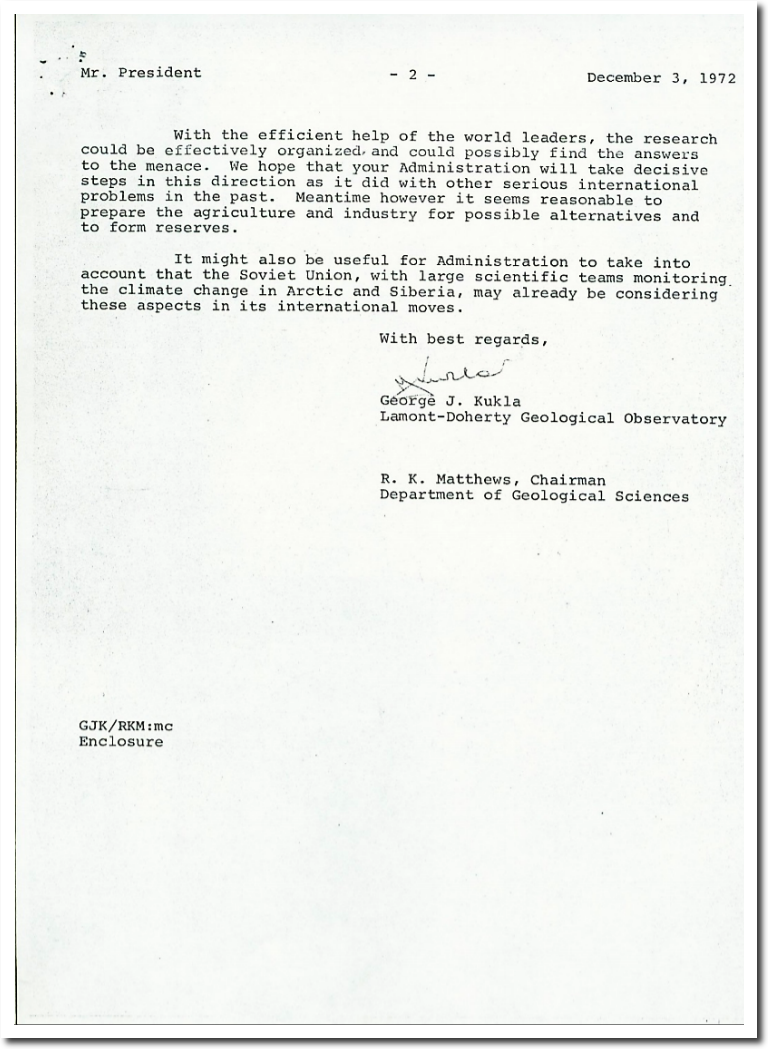
In 1972, forty-two top American and European scientists sent a letter to President Nixon warning of a new ice age within a century.
THE ROLE OF NOAA’S CLIMATE PREDICTION CENTER IN THE DEVELOPMENT OF CLIMATE SERVICES
By 1970, the US and Soviet Union were worried about a new ice age, and ominously thickening Arctic sea ice.
U.S. and Soviet Press Studies of a Colder Arctic – The New York Times
The 1985 DOE CO2 report was the predecessor of the IPCC, and shows that extent was very low in the 1950s, and then began to increase rapidly in the 1960s and 1970s – triggering fears of an ice age – as I will document shortly.

Projecting the climatic effects of increasing carbon dioxide (Technical Report) | SciTech Connect
If we combine the 1985 DOE graph and the 1990 IPCC graph at the same scale on both axes, it becomes clear why NOAA and the National Climate Assessment start their graphs in 1979. That year was the high point of the last century, and by cherry picking a high point, they can mislead readers into believing sea ice extent is trending linearly down. If they showed the entire series, it would become clear that current sea ice extent and thickness is comparable to the 1950s.
Historical data confirms the warmth and low ice extent of the 1950s. Sixty years ago, the New York Times reported that the polar ice cap had lost 40 percent of its thickness and 12 percent of its area, and were predicting an ice-free Arctic within a generation.
Some scientists estimate that the polar ice pack is 40 per cent thinner and 12 per cent less in area than it was a half-century ago, and that even within the lifetime of our children the Arctic Ocean may open, enabling ships to sail over the North Pole
Although the idea that a solid ice sheet covers the central Arctic has lingered stubbornly in the popular fancy, the northern cap of ice worn by our planet is actually a thin crust—on the whole, only about seven feet thick—over an ocean two miles deep in places.
October 19, 1958

The Changing Face of the Arctic; The Changing Face of the Arctic – The New York Times
Polar temperatures are on an average six degrees higher than those registered by Nansen 40 years ago. Ice measurements were on an average only 6½ feet against from 9¼ to 13 feet.
February 23, 1940
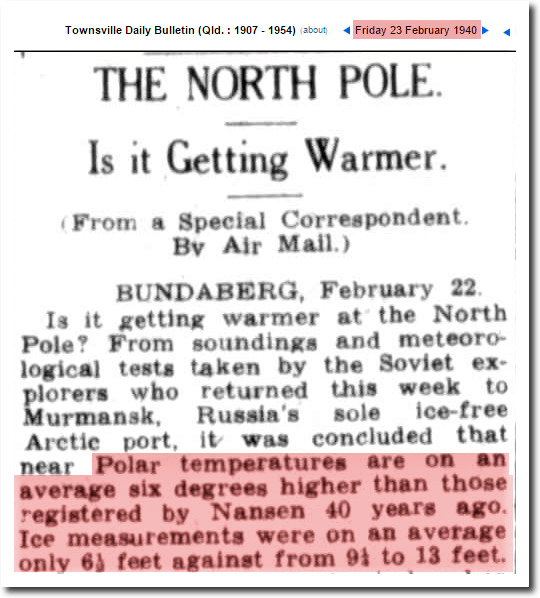
23 Feb 1940 – THE NORTH POLE. Is it Getting Warmer. | BUNDABER…
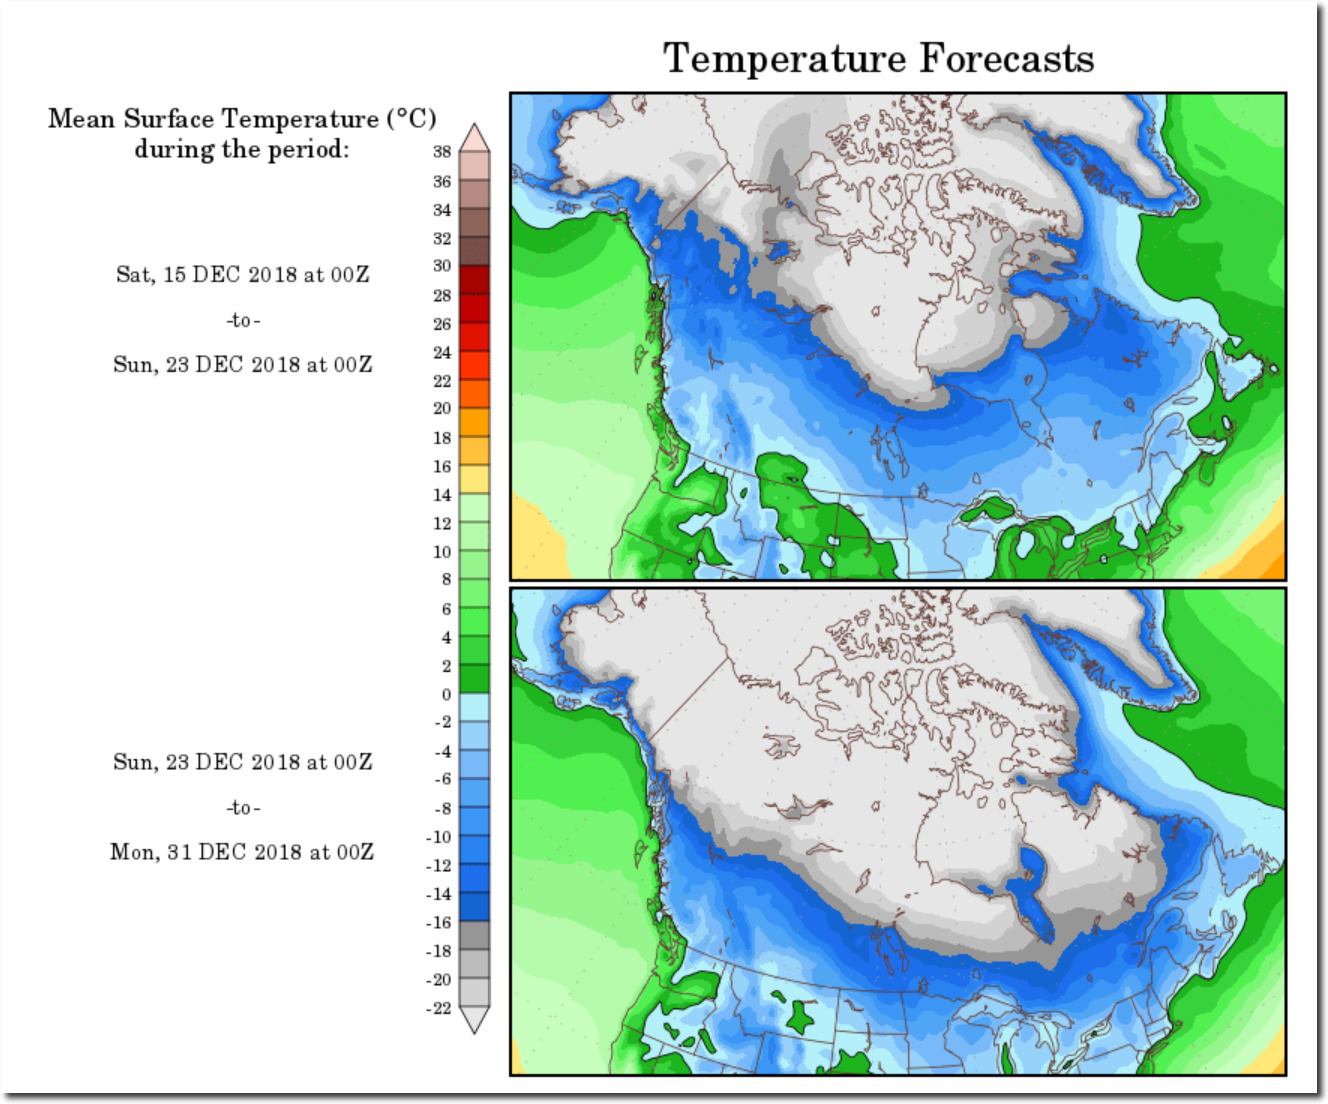
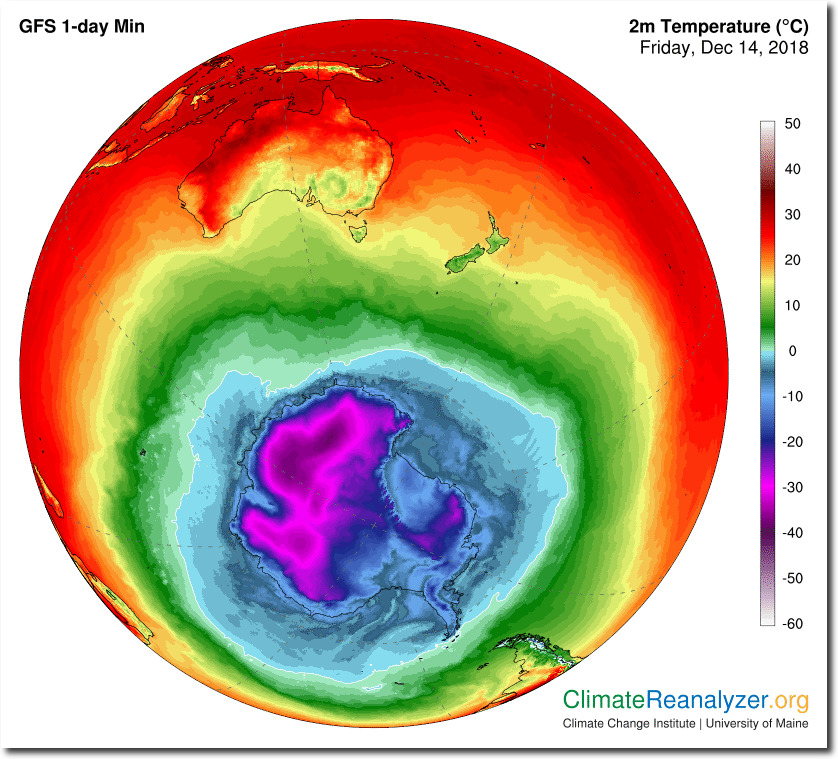
Arctic sea ice was the same thickness in the 1940s and 1950s as it is now – two meters.
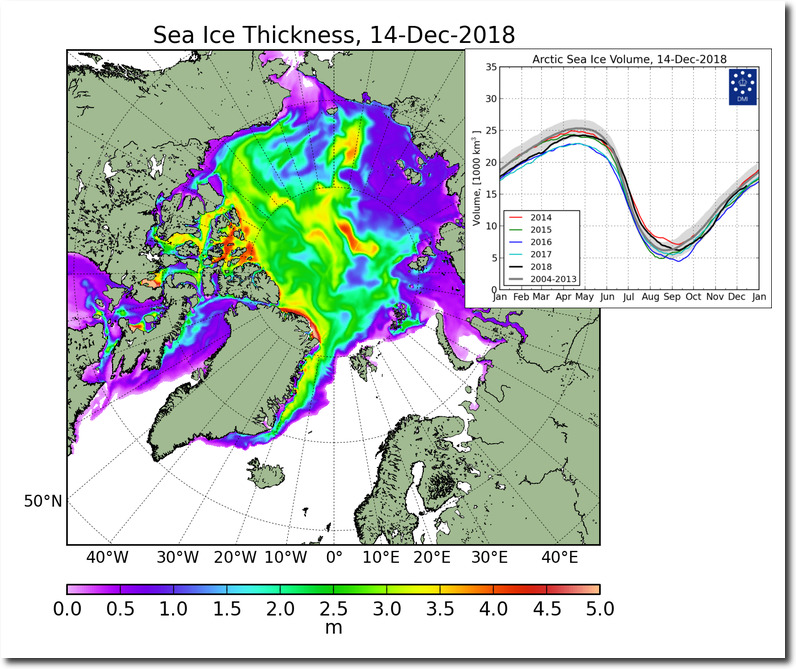
FullSize_CICE_combine_thick_SM_EN_20181214.png (1337×1113)
Sea ice expanded rapidly in the 1960s and and 1970s, but from the 1920s through the 1950s, the Arctic was having a meltdown.
https://docs.lib.noaa.gov/rescue/mwr/050/mwr-050-11-0589a.pdf
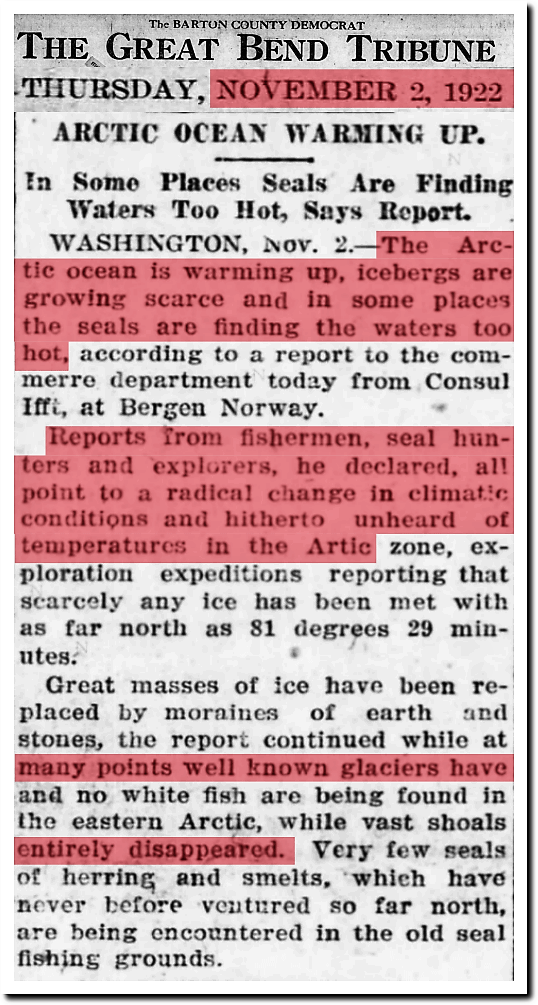
2 Nov 1922, Page 1 – Great Bend Tribune at Newspapers.com

17 Dec 1939, Page 15 – Harrisburg Sunday Courier
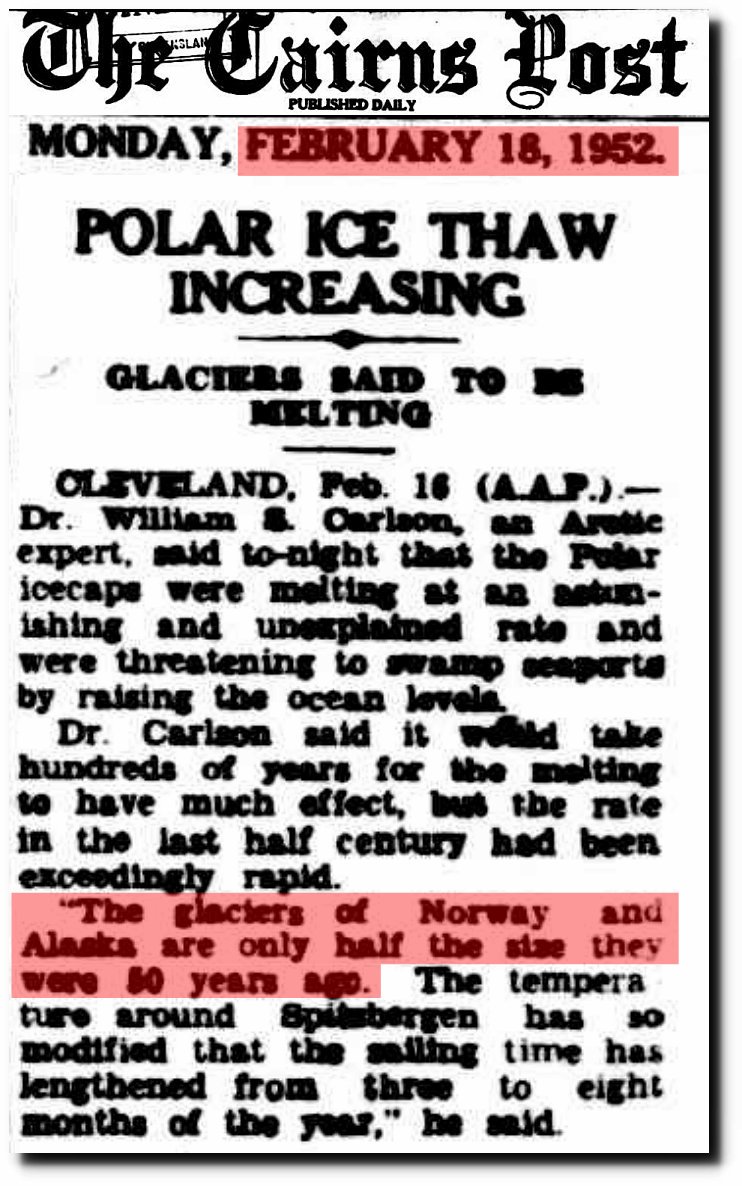
18 Feb 1952 – POLAR ICE THAW INCREASING
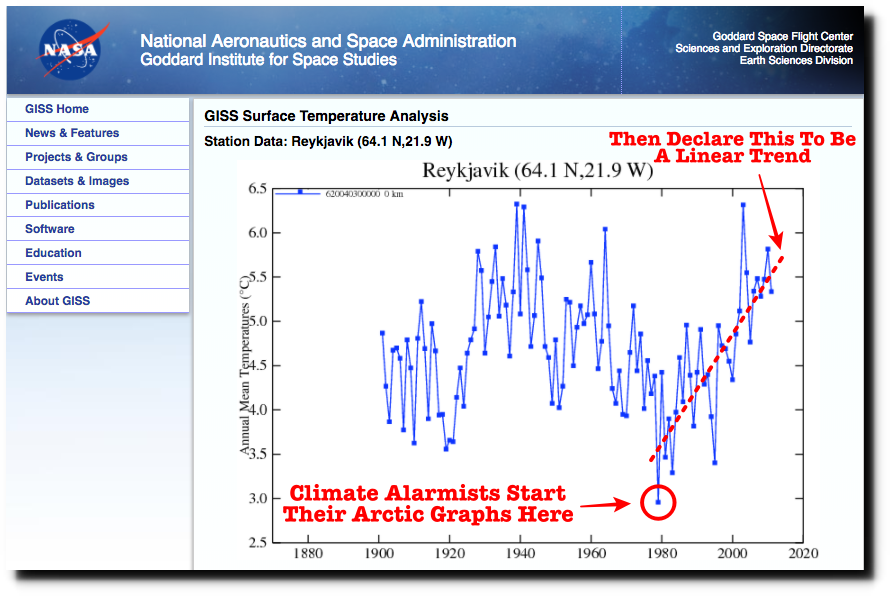
Evidence is overwhelming the Arctic climate and sea ice is cyclical, and raw, untampered data shows this is true. The NASA graph below of Reykjavik, Iceland temperatures shows why NOAA and the National Climate Assessment start their graphs in 1979 – which was the coldest year on record in Iceland.
V2 Measured
By starting their sea ice graphs in 1979, alarmists can fool people into believing sea ice extent is driven by CO2, instead of oceanic cycles.
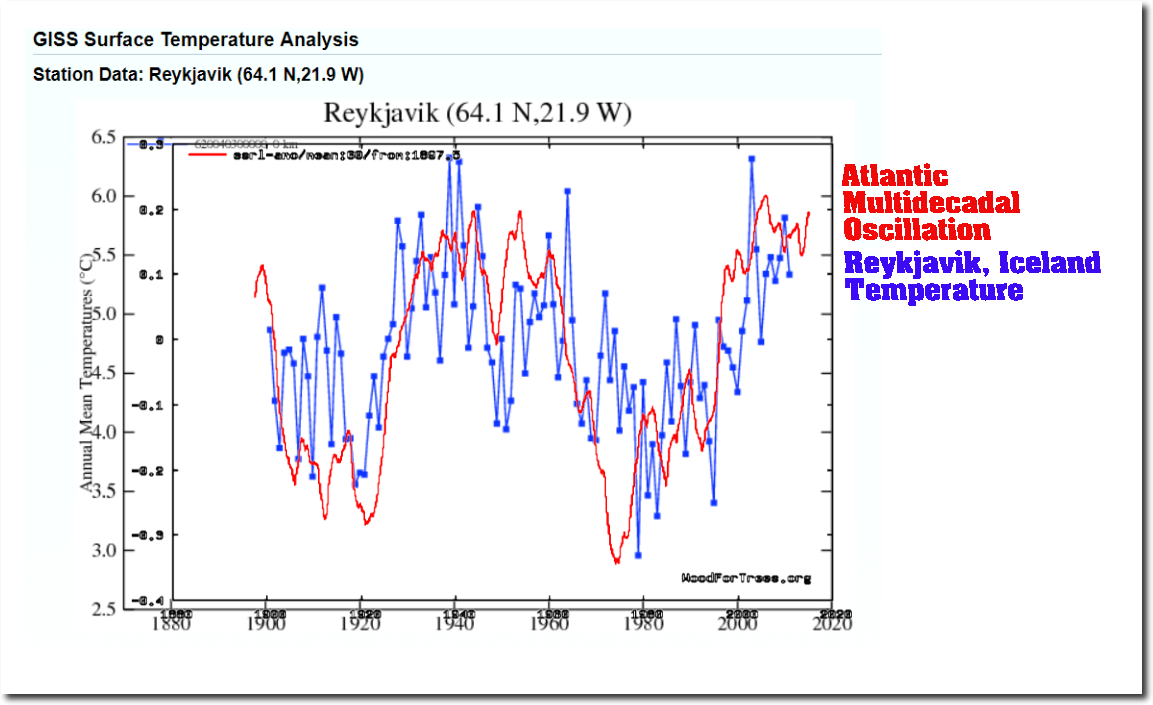
Reykjavik GISS V2 AMO
The reality of Arctic climate ruins the global warming scam, so NASA now tries to hide the past warmth of the Arctic – by tampering with the data to cool the past.
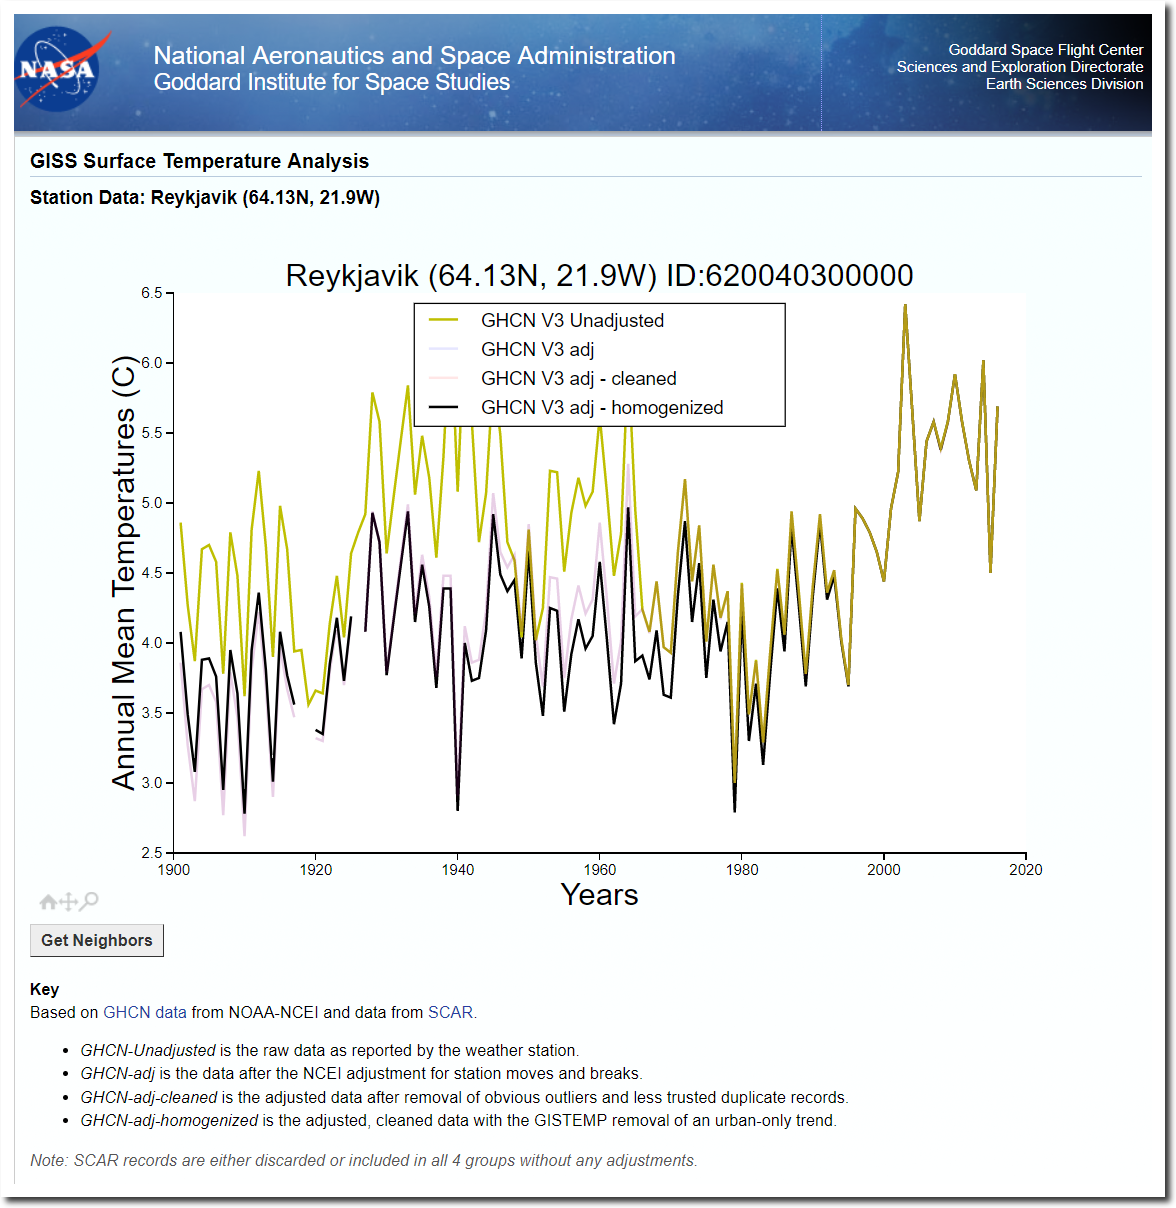
October 2017 V3 Measured Vs Homogenized
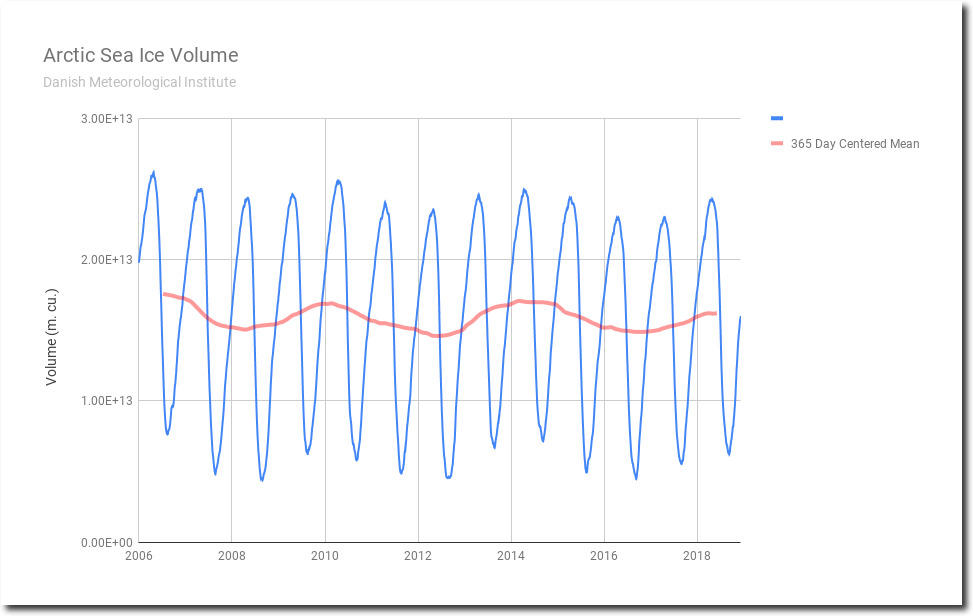
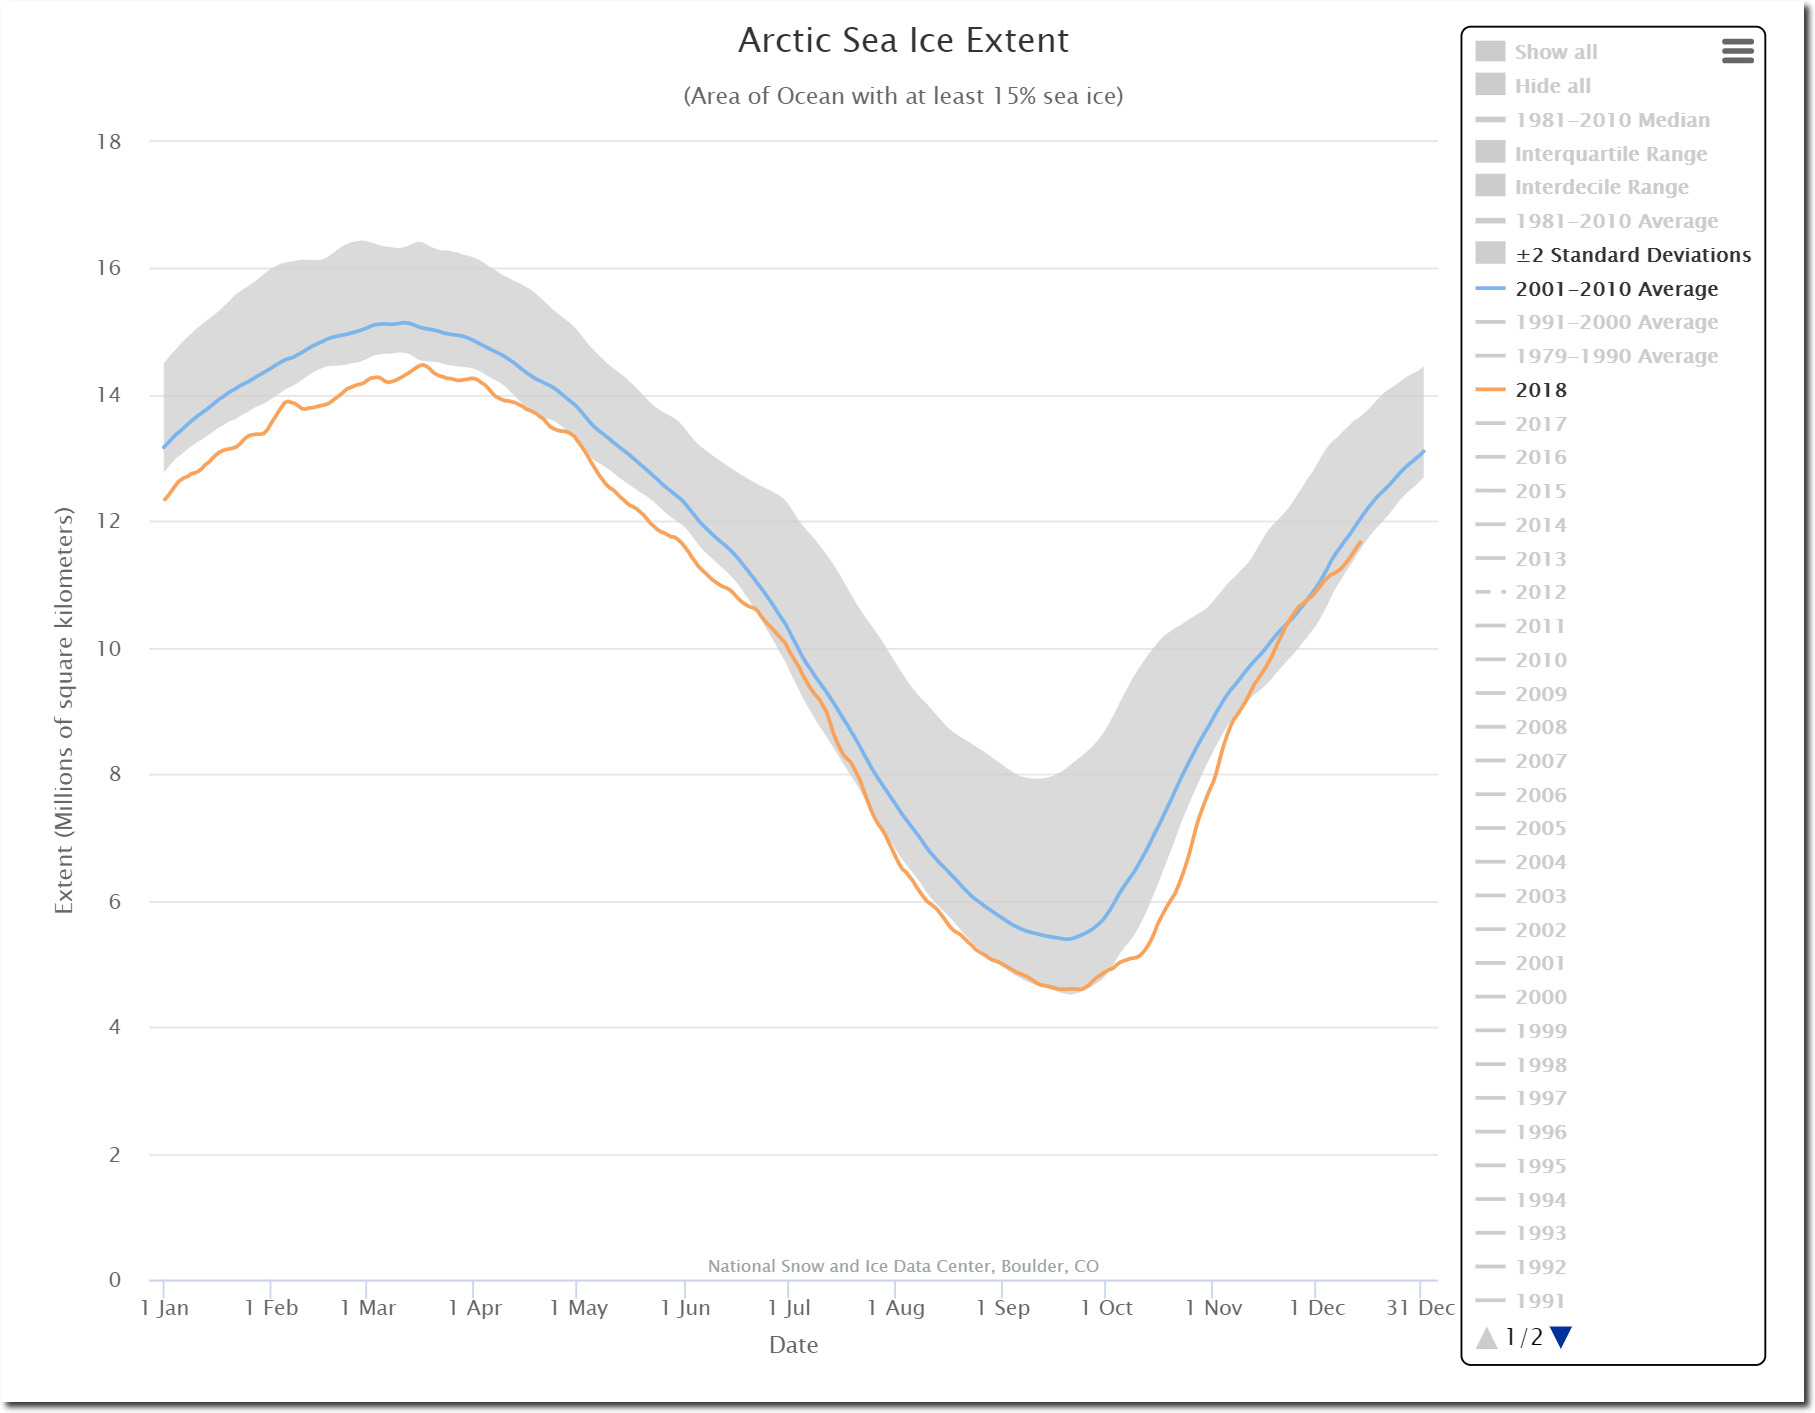
Neither extent nor volume of Arctic sea ice shows any trend over the last 12 years. Every year, climate scientists scream it is the hottest year ever, and the ice will soon disappear – but reality provides no evidence to back up their claims,
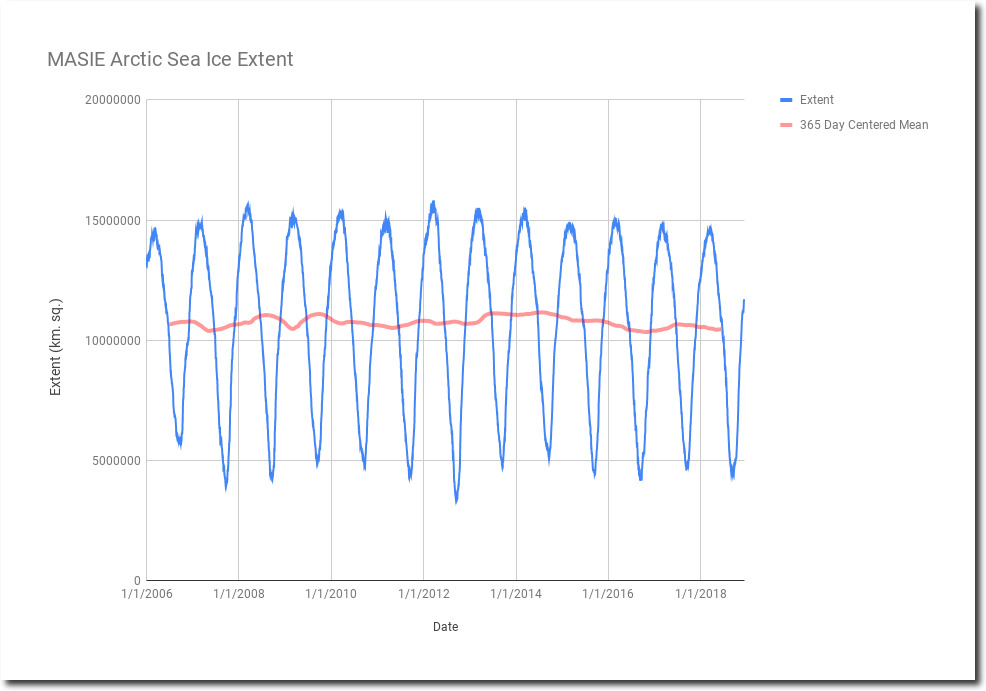
data spreadsheet
data spreadsheet
Climate scientists have been consistently wrong about the Arctic for 100 years, and all of their predictions have failed.
Expert: Arctic polar cap may disappear this summer_English_Xinhua
North Pole May Be Ice-Free for First Time This Summer
Star-News – Google News Archive Search
BBC NEWS | Science/Nature | Arctic summers ice-free ‘by 2013’
Gore: Polar ice cap may disappear by summer 2014
The Argus-Press – Google News Archive Search
There is no indication anything has changed in the Arctic, other than normal 60 year cycles – but climate scientists have huge amounts of funding dependent on demonizing CO2 for politicians. So they lie, cheat, hide data and tamper with data.
Twenty thousand years ago, Chicago was covered with a mile of ice. CO2 was much lower than it is today.
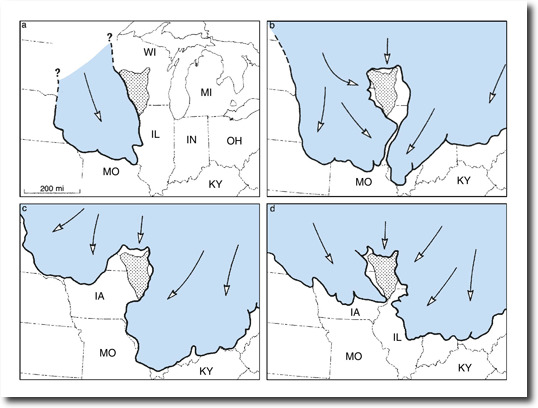
Illinois State Geological Survey Glaciers Smooth the Surface | ISGS
Six thousand years ago, the Arctic was ice-free. CO2 was also much lower than it is today.
Less Ice In Arctic Ocean 6000-7000 Years Ago — ScienceDaily
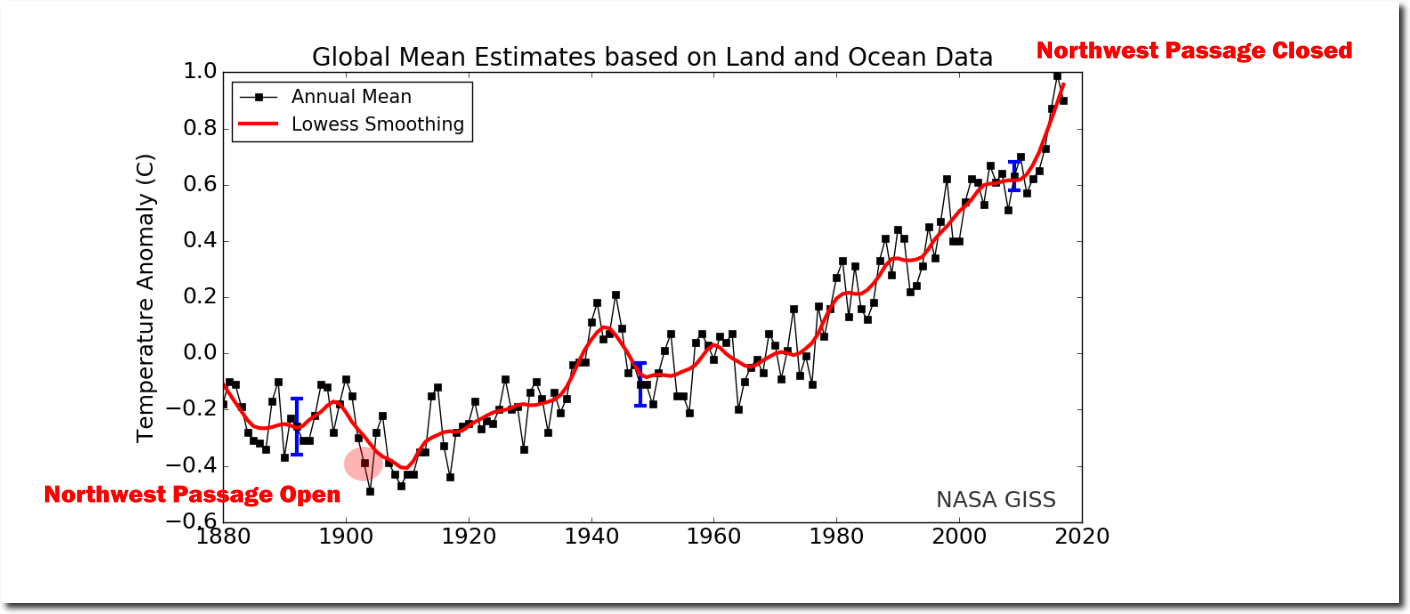
The Northwest Passage was open in September, 1903, which NASA describes as one of the coldest years on record.
I saw it open before my ship the first year of my voyage, and would not take advantage of the chance because my programme was to make observations at the magnetic pole.

TimesMachine: March 9, 1907 – NYTimes.com
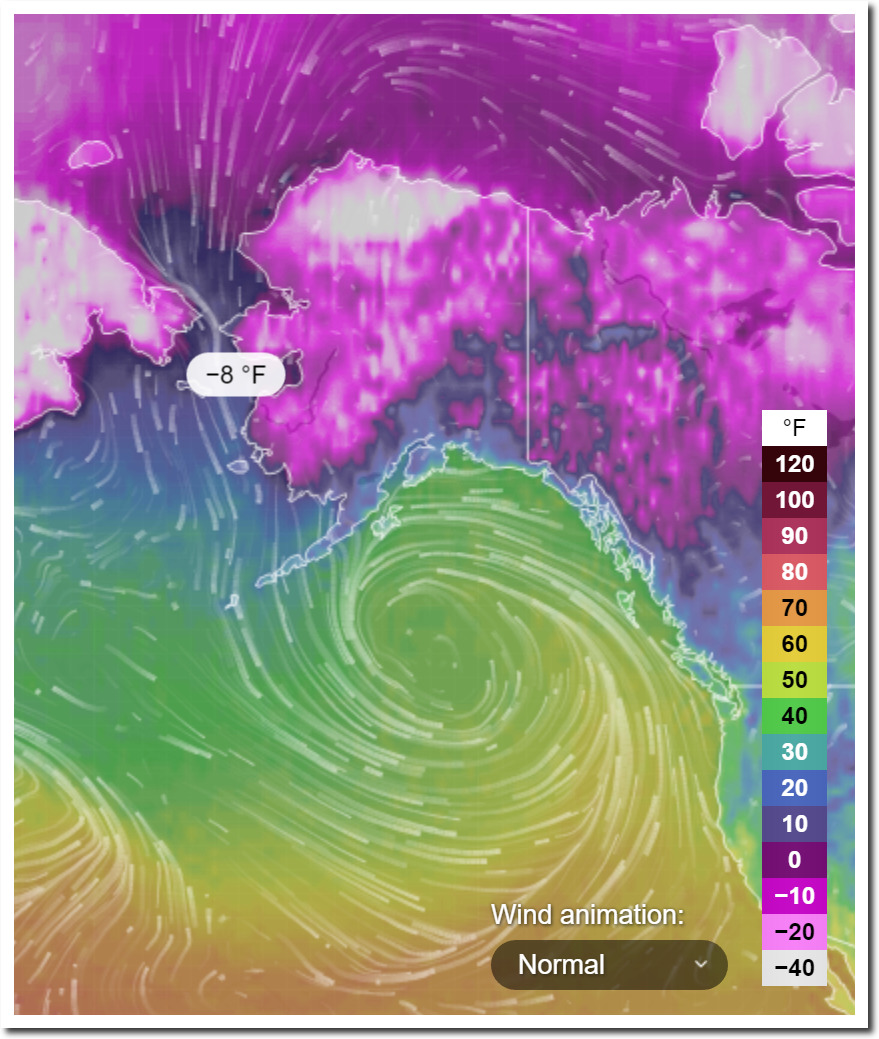
The Northwest Passage was not open this year.
The Northwest Passage was open during one of NASA’s coldest years on record, but was blocked with ice this year, which NASA says was one of the hottest years on record.
graph.png (1130×600)
There is no evidence CO2 has any impact on Arctic ice, but huge amounts of evidence that government climate scientists are defrauding the public.


