One Of The Least Hot Summers In The Midwest

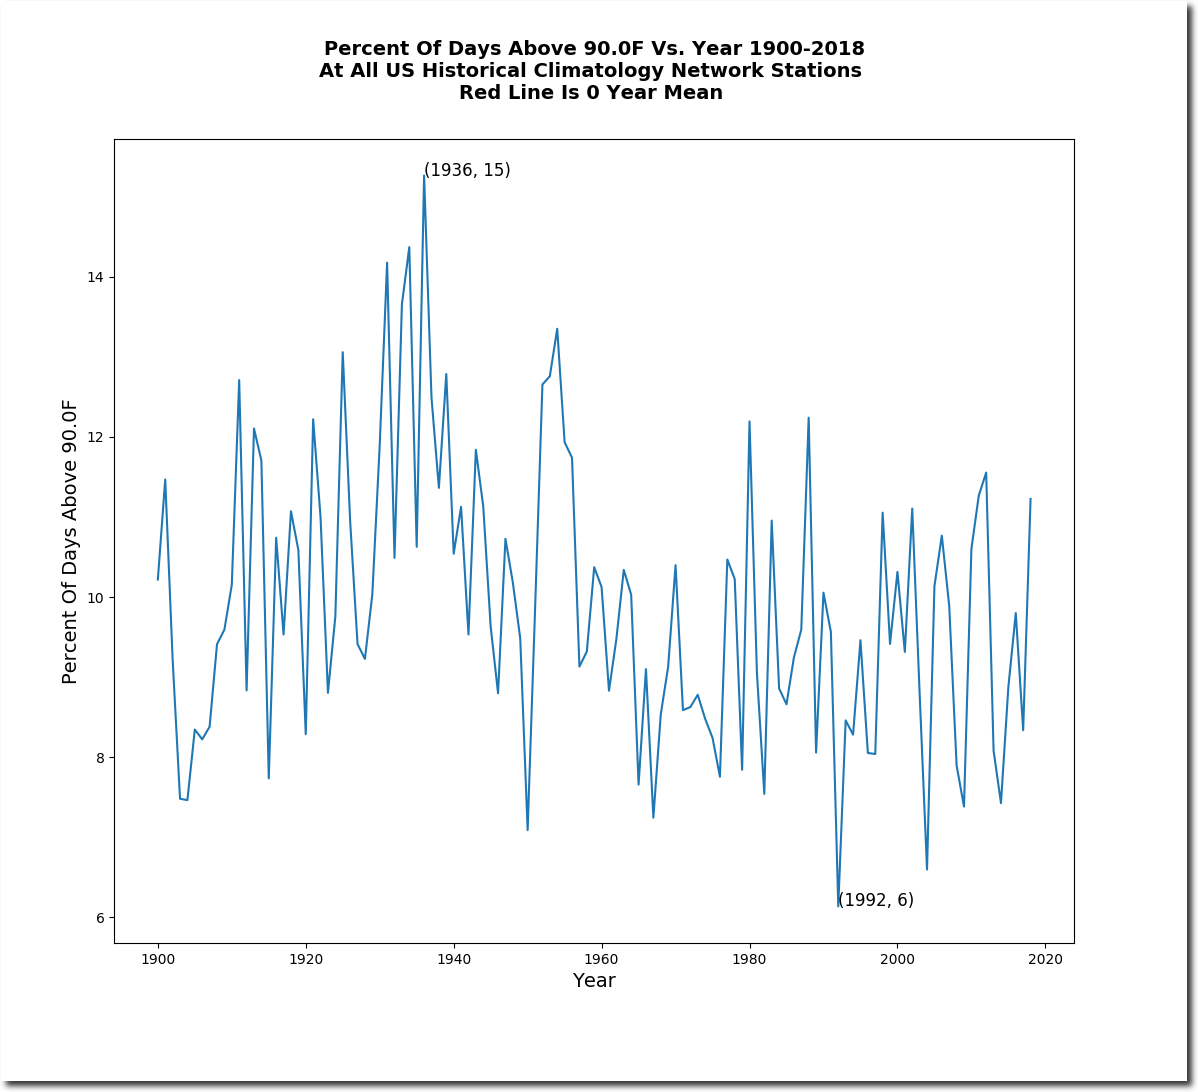
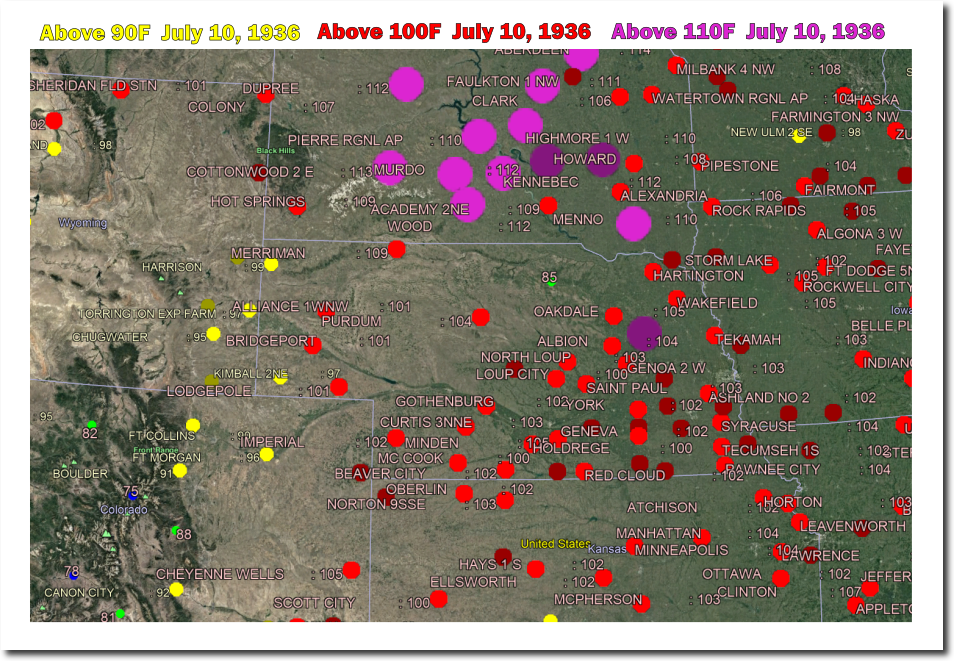
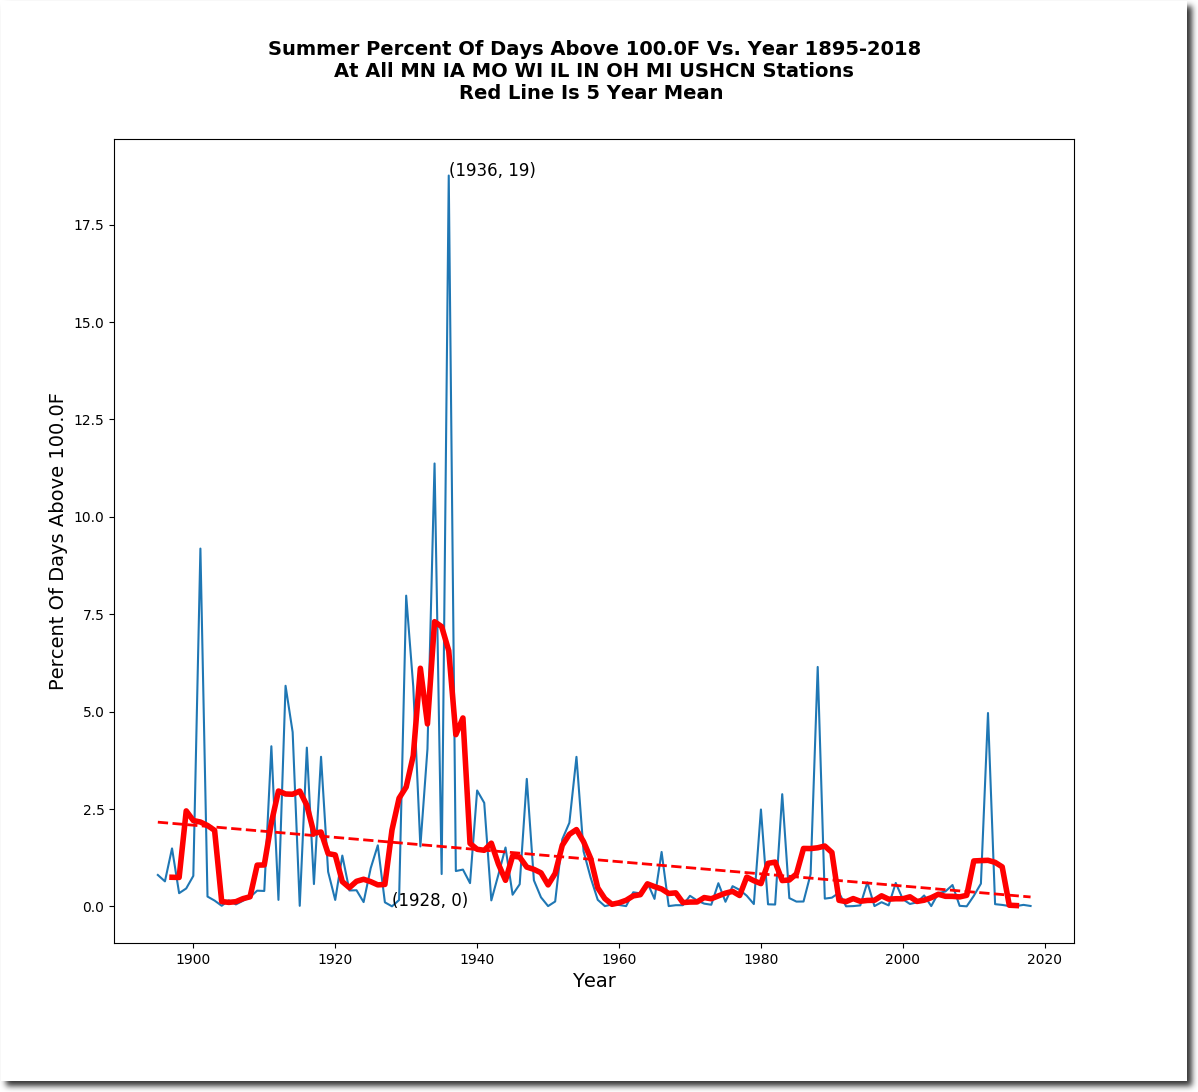
Midwestern USHCN stations have recorded 17,772 June/July/August measurements over 100 degrees since 1895, including 2,624 in 1936 alone. This year there were only eight measurements over 100 degrees.

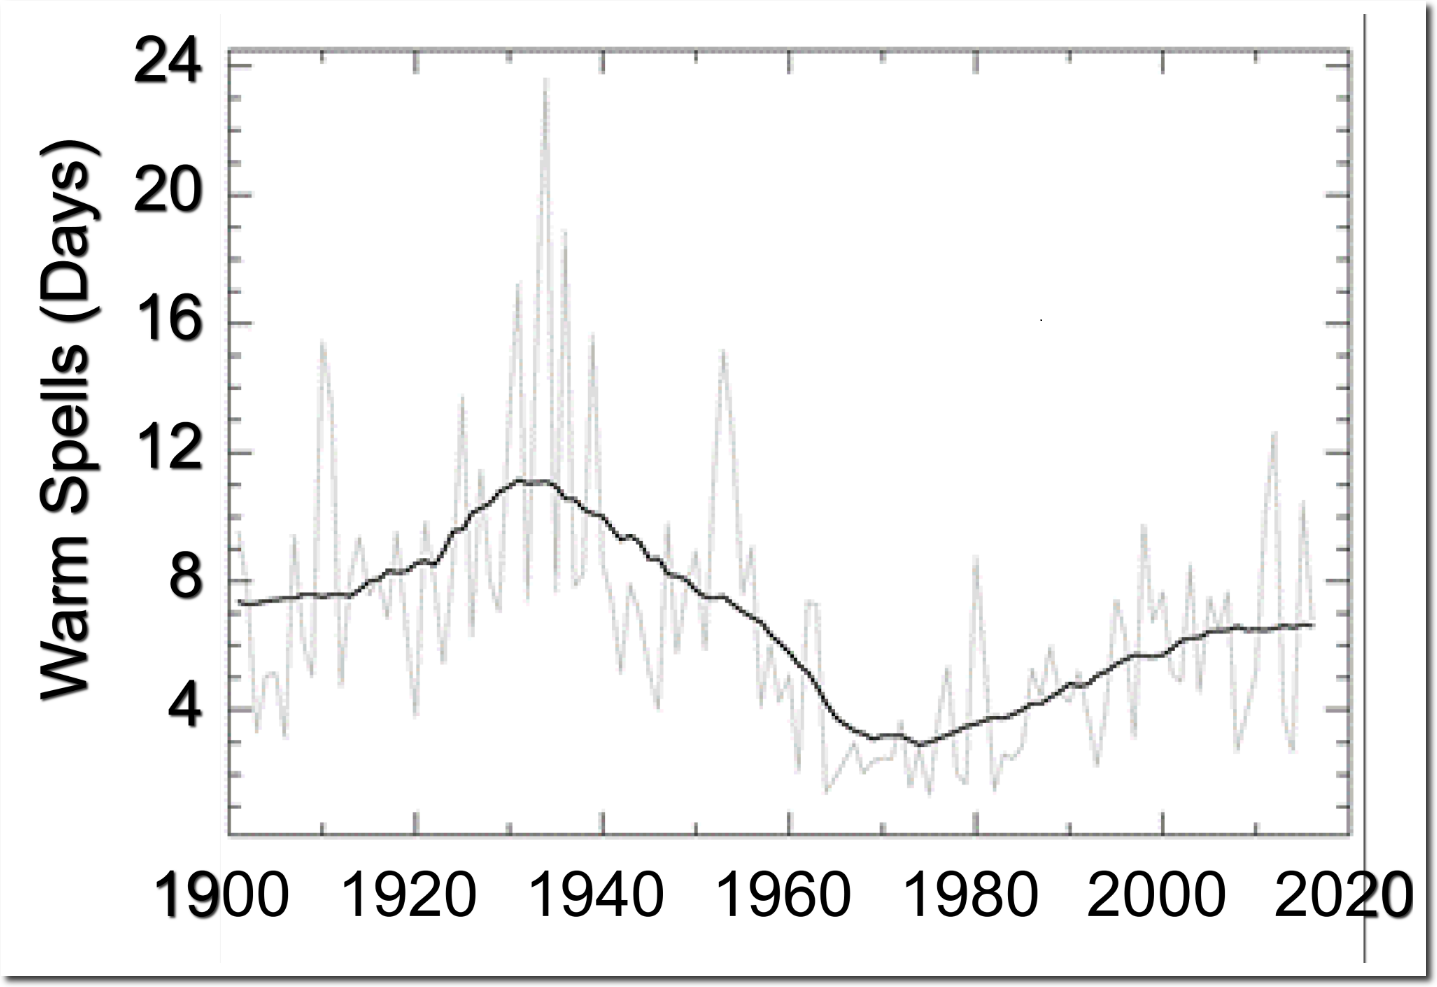
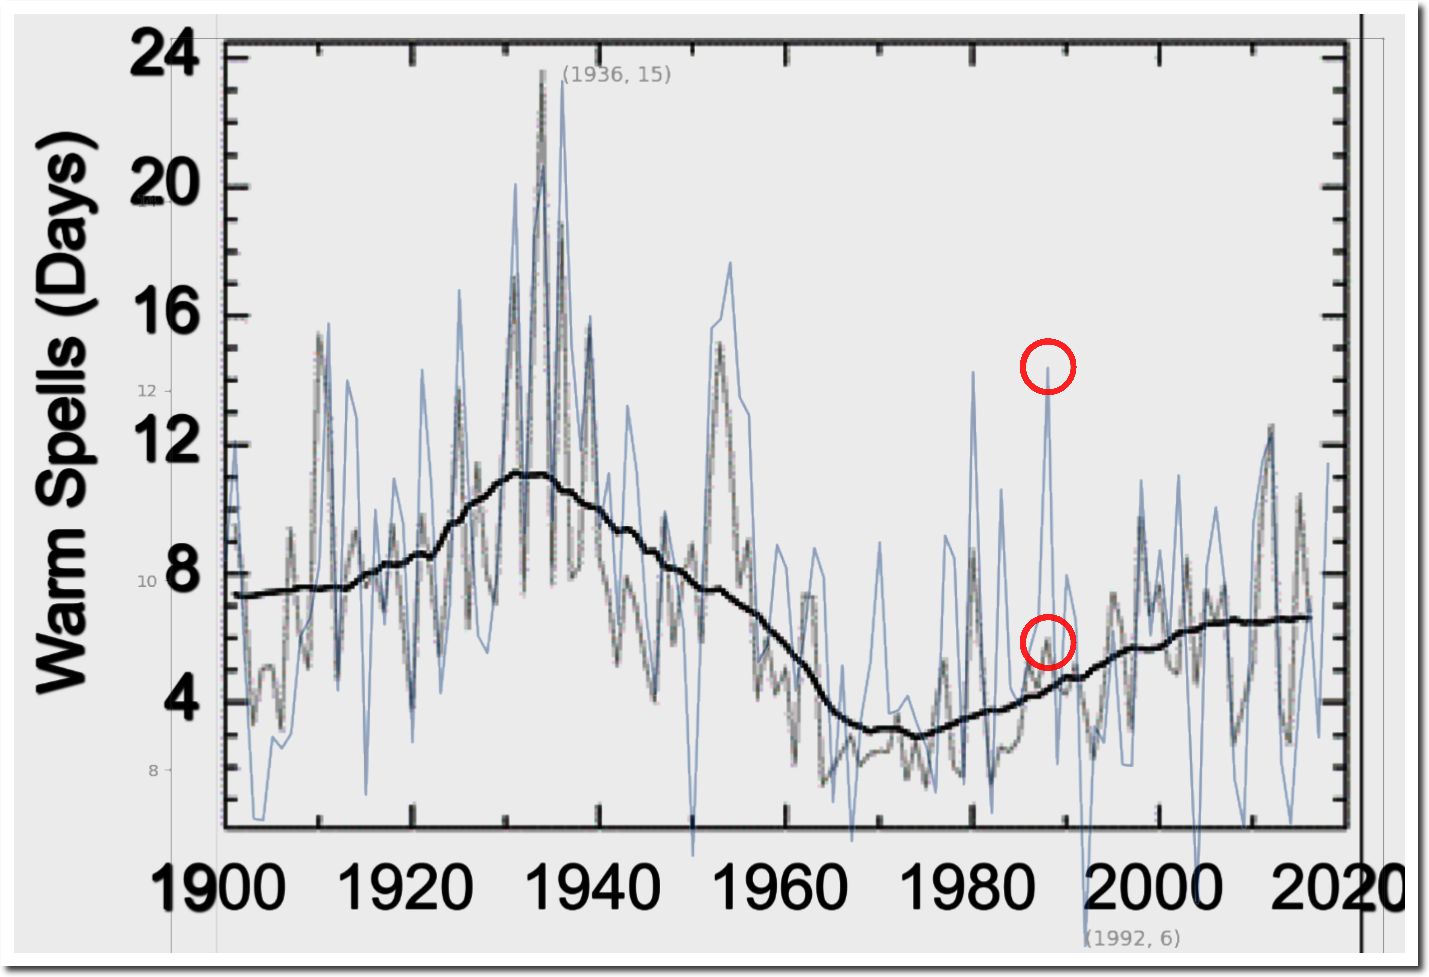
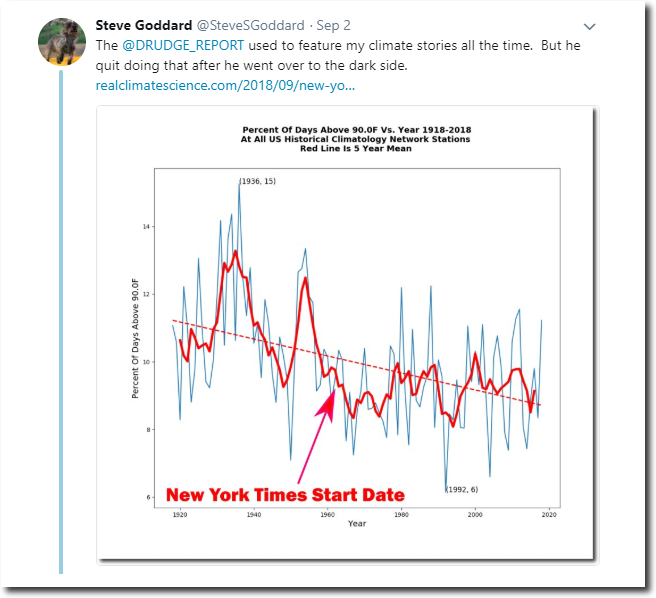
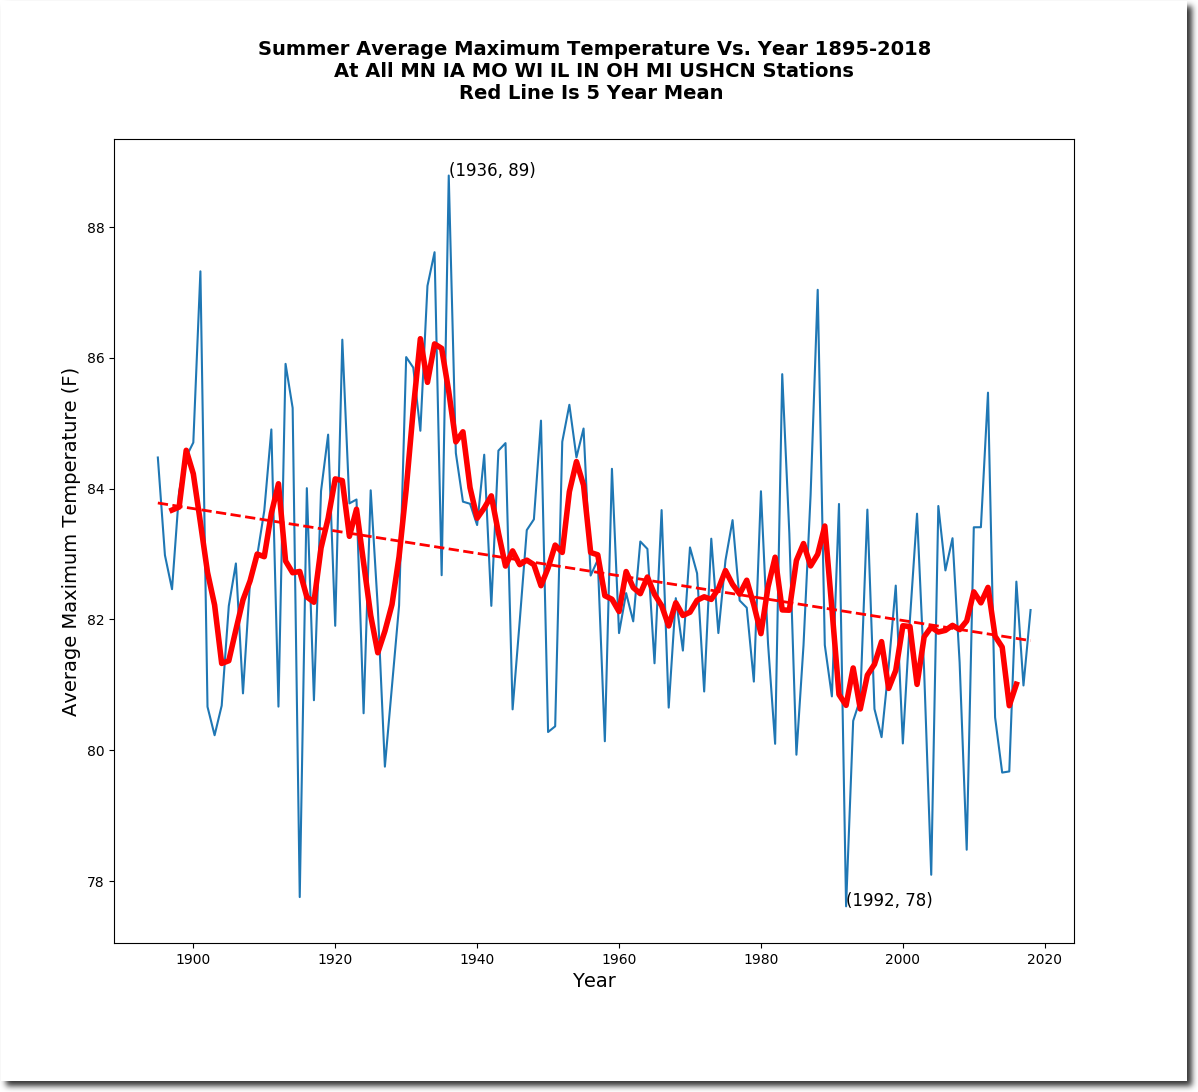
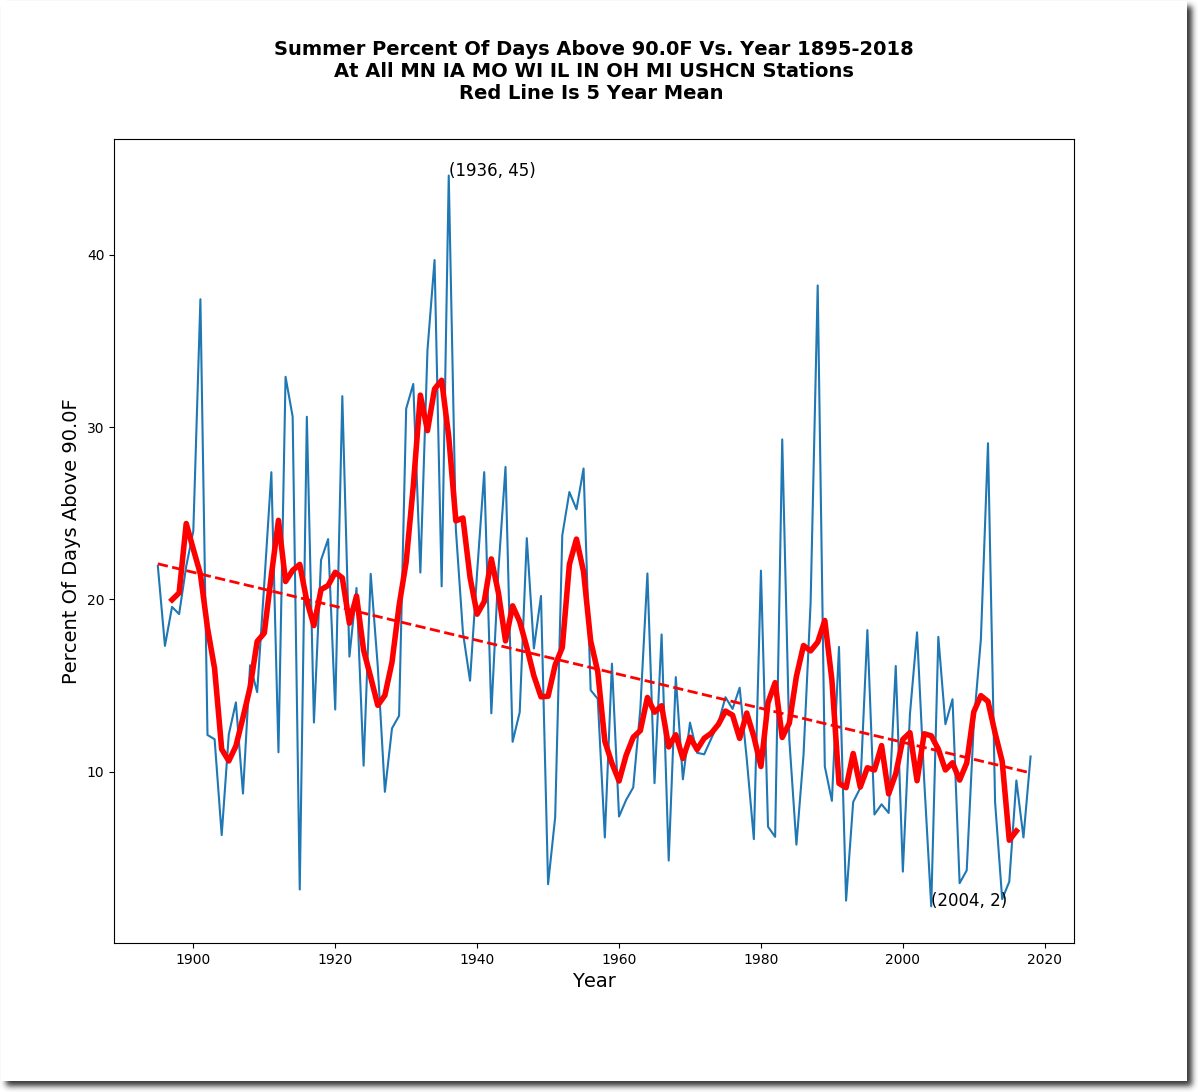
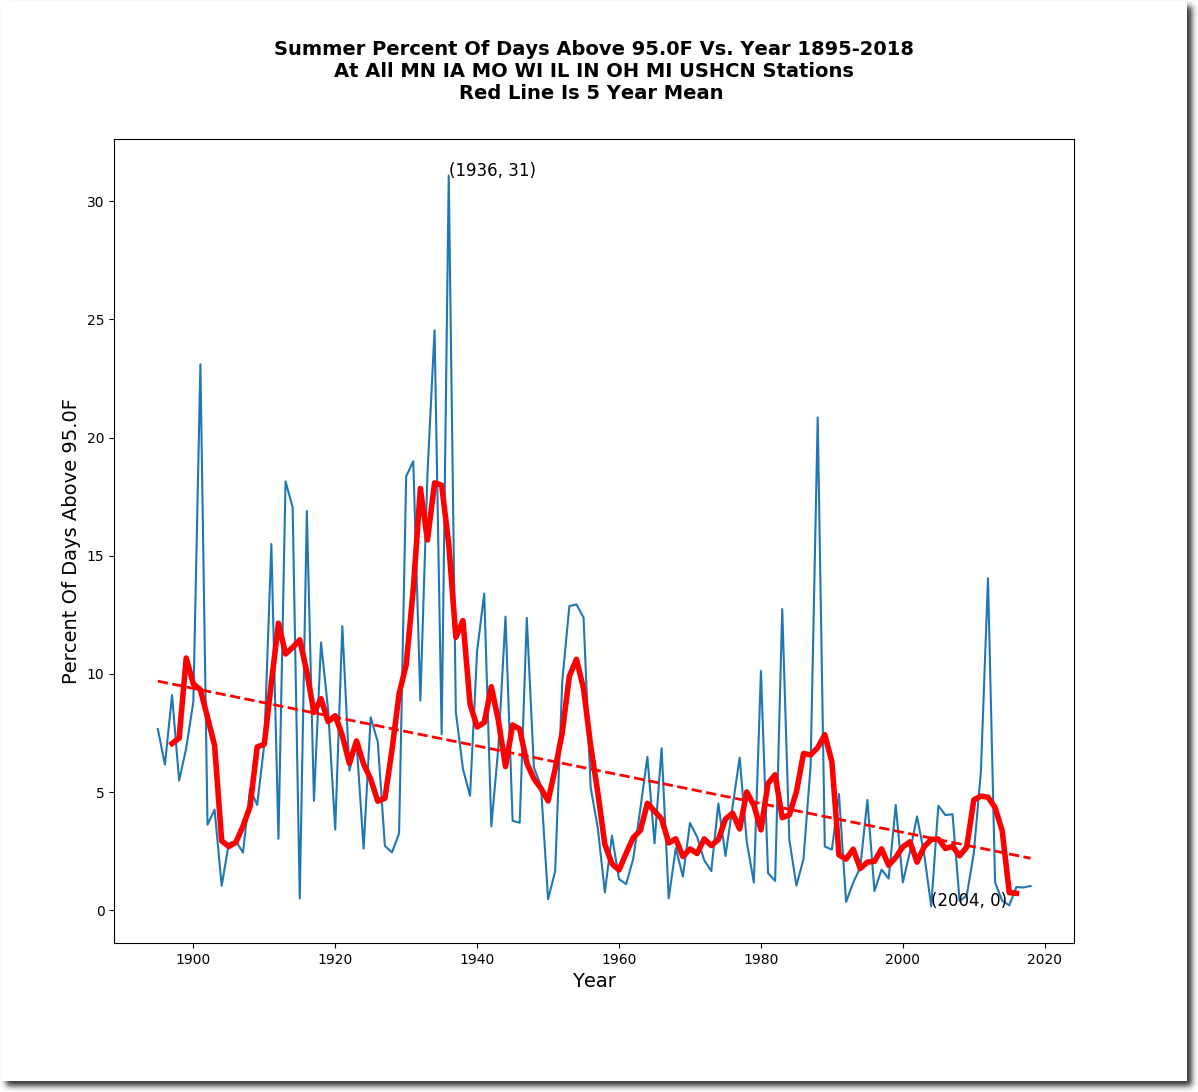
The frequency and intensity of hot summer afternoons in the Midwest has plummeted since the 19th century.


The New York Times claims the exact opposite, because their job is to push propaganda – not report news. This is the wildly fraudulent New York Times graph for Harrisburg, Illinois, purporting to show the number of 90 degrees days.

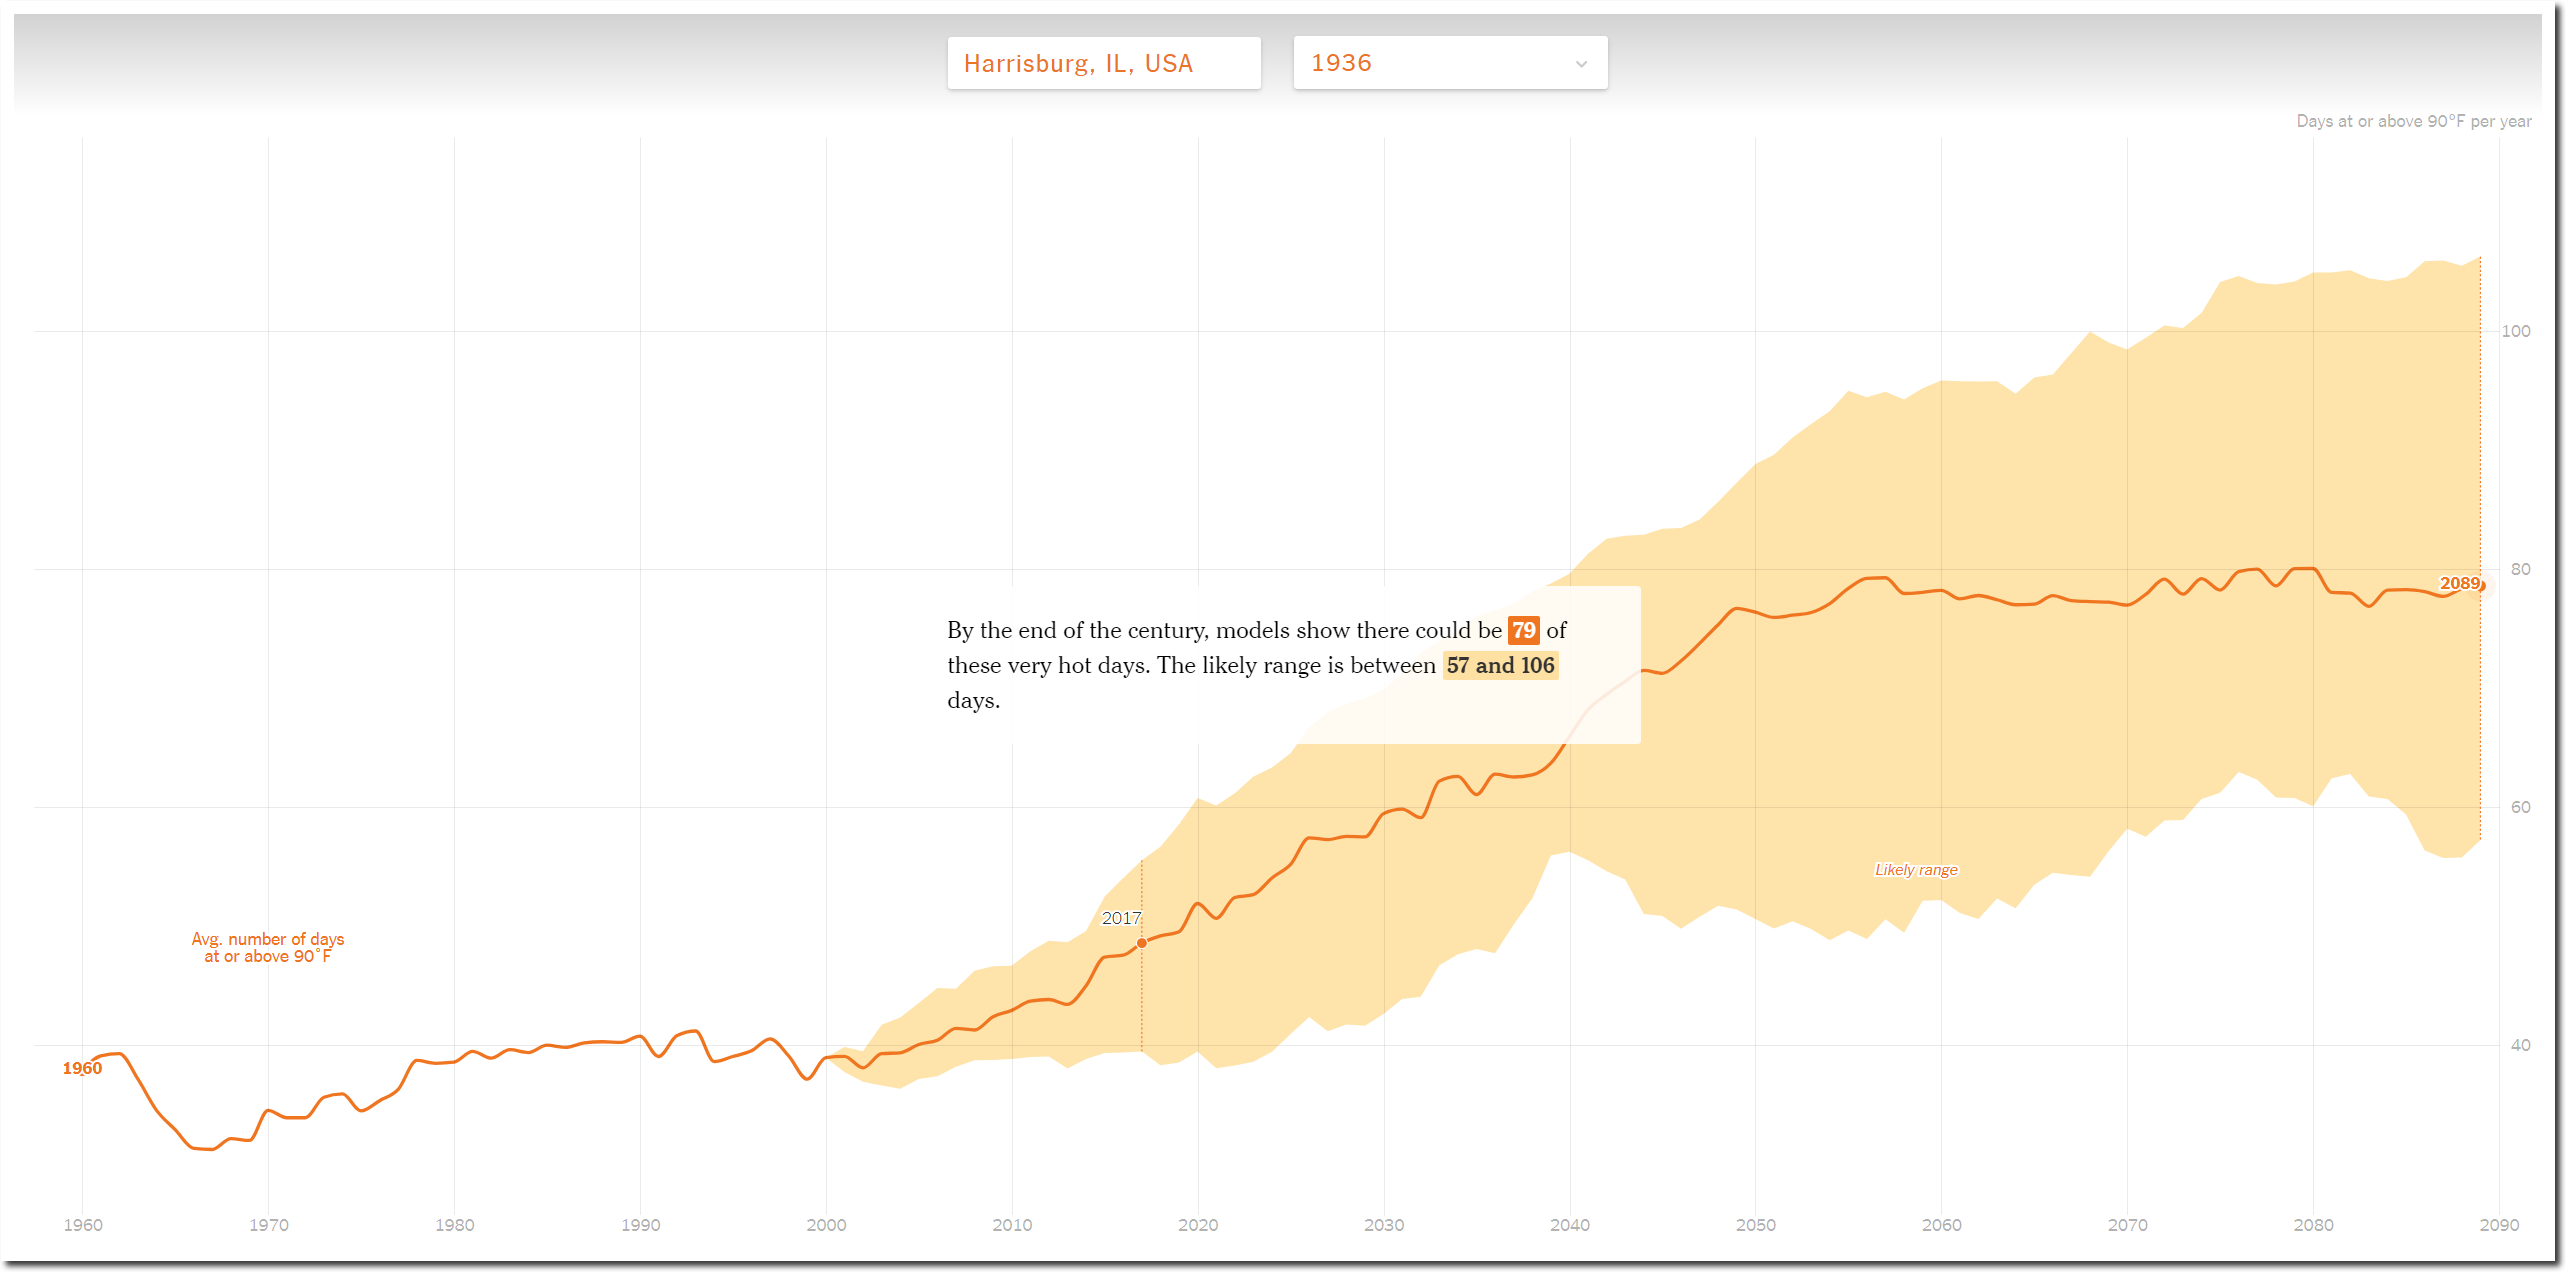
How Much Hotter Is Your Hometown Than When You Were Born? – The New York Times

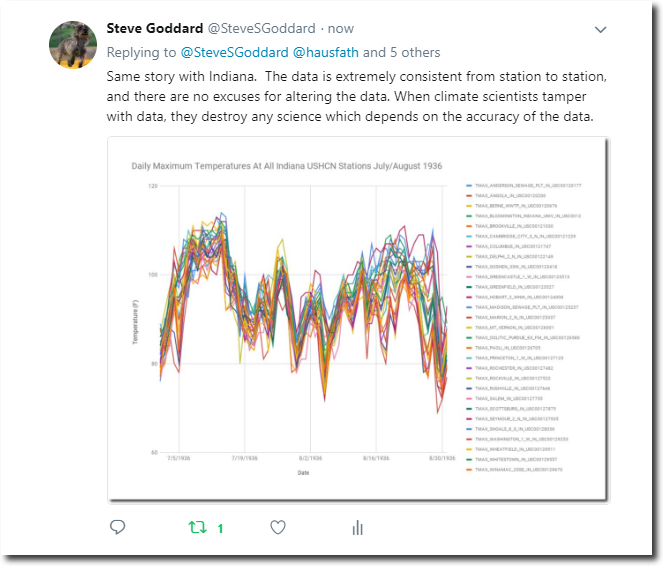
And this is what the actual thermometer data looks like. The downwards trend is the exact opposite of the New York Times graph.

Posted in Uncategorized | Leave a comment

Experts

Posted in Uncategorized | Leave a comment

The Wins Just Keep Coming!

CNN is very angry about the defeat of ISIS, ambassadors not being murdered in spontaneous YouTube protests, peace with North Korea, the end of the Cold War, the booming economy, peace on the streets of America, no cities being burned, the lack of racial strife ….  They miss the good old days of Obama/Hillary … when every day was an actual crisis.

And now they are hysterical about an actual competent scientist working in government, and an “impeachable Trump tweet.

His public stance on climate change is in opposition to near universally accepted science.

Trump to name climate change skeptic as emerging tech adviser – CNNPolitics

That is Dr. Happer on the right in front of Albert Einstein’s house last March. Global warming was hitting us very hard that day.

Posted in Uncategorized | Leave a comment

More Nebraska

On July 17, 1936, there was a large spread in temperatures across Nebraska, from 118 degrees at Hartington to 100 degrees at Kimball.

Does this mean there was something wrong with the data?  Not at all – it was much hotter in eastern Nebraska than western Nebraska. The USHCN daily temperature data is very credible. Mosher and his junk science cohorts have no excuse for tampering with it.

More than a third of the US was over 100 degrees that day.

Daily temperature data is currently not being tampered with, and it exposes New York Times fraud and wrecks the global warming scam.  That is why people like Mosher are desperate to destroy it.

Posted in Uncategorized | Leave a comment

Today’s Global Warming Fraud At The New York Times

The New York Times is blaming Roger Federer’s September 3rd loss on global warming.


Roger Federer Is Tough to Beat. Global Warming Might Have Pulled an Upset. – The New York Times

It was the 10th warmest September 3 on record in New York, nine degrees cooler than  September 3, 1929.  Last year was 69 degrees.

September 3rd nighttime temperatures in New York peaked in 1898, and have been declining ever since.

Apparently no one at the New York Times actually reads the New York Times.

TimesMachine: Wednesday September 4, 1929 – NYTimes.com

1896 Heatwave

Posted in Uncategorized | Leave a comment

Close Enough For Government Work

The National Climate Assessment has this graph, which shows how much hotter the US used to be.

Temperature Changes in the United States – Climate Science Special Report

But somehow they lost the very hot summer of 1988, when James Hansen started the global warming scam, the Mississippi River nearly dried up, and Yellowstone burned.

This is the actual data.

The next graph overlays the actual data above, on the government graph below. 1988 is gone – you really can’t make up incompetence like this.

But then again ….

19 Jun 1988, 1 – The Jackson Sun at Newspapers.com

Posted in Uncategorized | Leave a comment

Temperature Variation In Nebraska

Someone on Twitter suggested the daily variation seen across stations in Nebraska temperatures was due to measurement error.

In fact, it is due primarily to Nebraska being a large state with a wide temperature variation.

People are always trying to out-think reality, and then adjust reality to fit their view of the world.

Posted in Uncategorized | Leave a comment

Can Miami Rebuild?

Drudge says Miami was slammed by a storm.

This is what Miami looks like this afternoon.

EarthCam – Miami Cams

This is what Miami looked like in September, 1926

Posted in Uncategorized | Leave a comment

Earliest Arctic Minimum On Record?

MASIE data currently shows the Arctic sea ice minimum on August 31, with a significant increase in ice extent since then.

Previous Arctic minimum dates.

2006 : September 24
2007 : September 18
2008 : September 22
2009 : September 12
2010 : September 25
2011 : September 21
2012 : September 24
2013 : September 17
2014 : September 19
2015 : September 17
2016 : September 11
2017 : September 10

Index of /DATASETS/NOAA/G02135/north/daily/images/

Things are not looking promising for Democratic Party prophets.

The Argus-Press – Google News Archive Search

Gore: Polar ice cap may disappear by summer 2014

Posted in Uncategorized | Leave a comment

Mosher Spills The Beans

NOAA does not currently tamper with the daily temperature data, but Mosher says they are working on it.

with the US record I’d steer clear of daily records, way too many inhomogenieties in the early observation practice. Some folks are working on methods to correct these on a daily basis, but today can only do it monthly. meh, well known if you work with the data.

  • Mosher

I keep lots of archives of the daily temperature data in many different locations, so it is going to be very difficult for them to destroy the evidence.

Posted in Uncategorized | Leave a comment