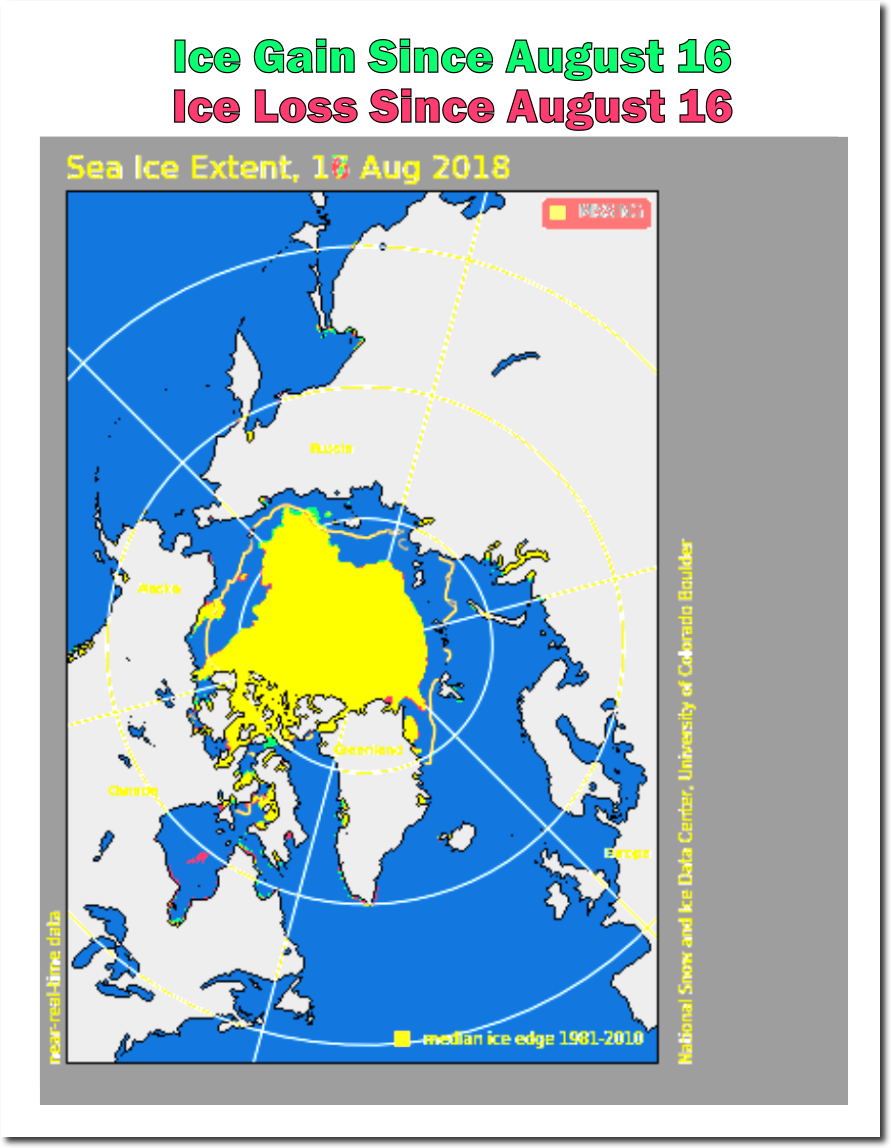
Like the day before, there was almost no change in Arctic sea ice extent yesterday.
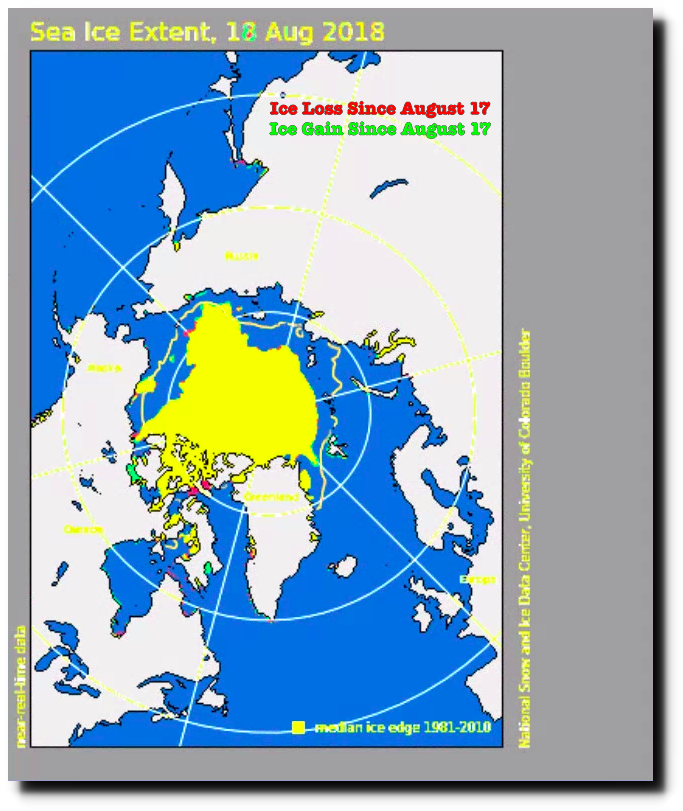
Index of /DATASETS/NOAA/G02135/north/daily/images/2018/08_Aug/
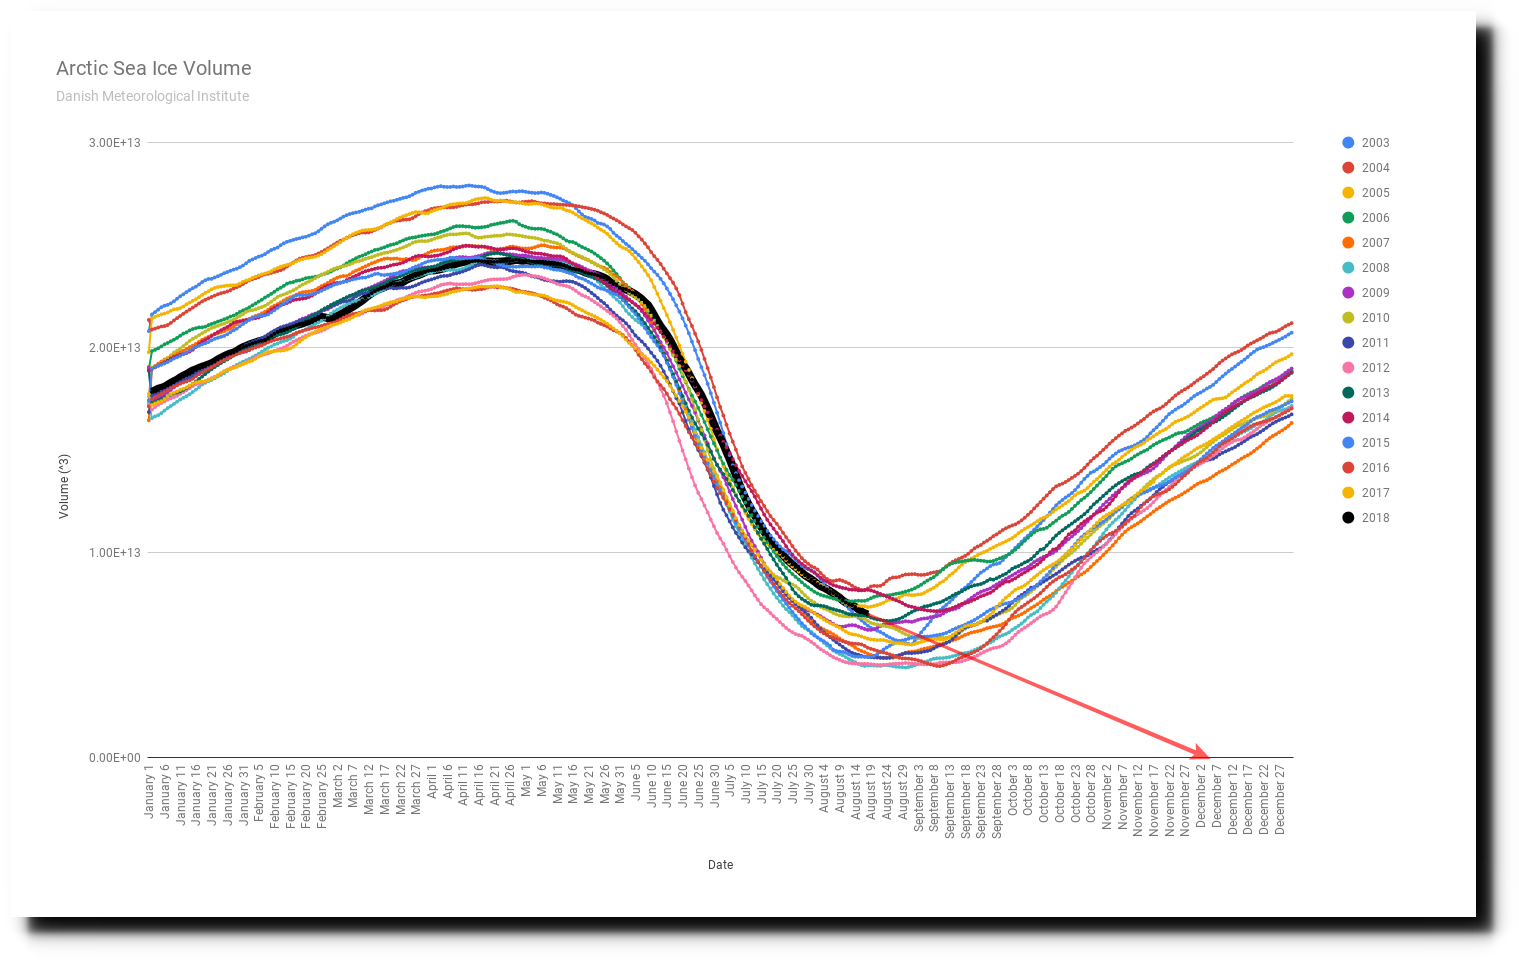
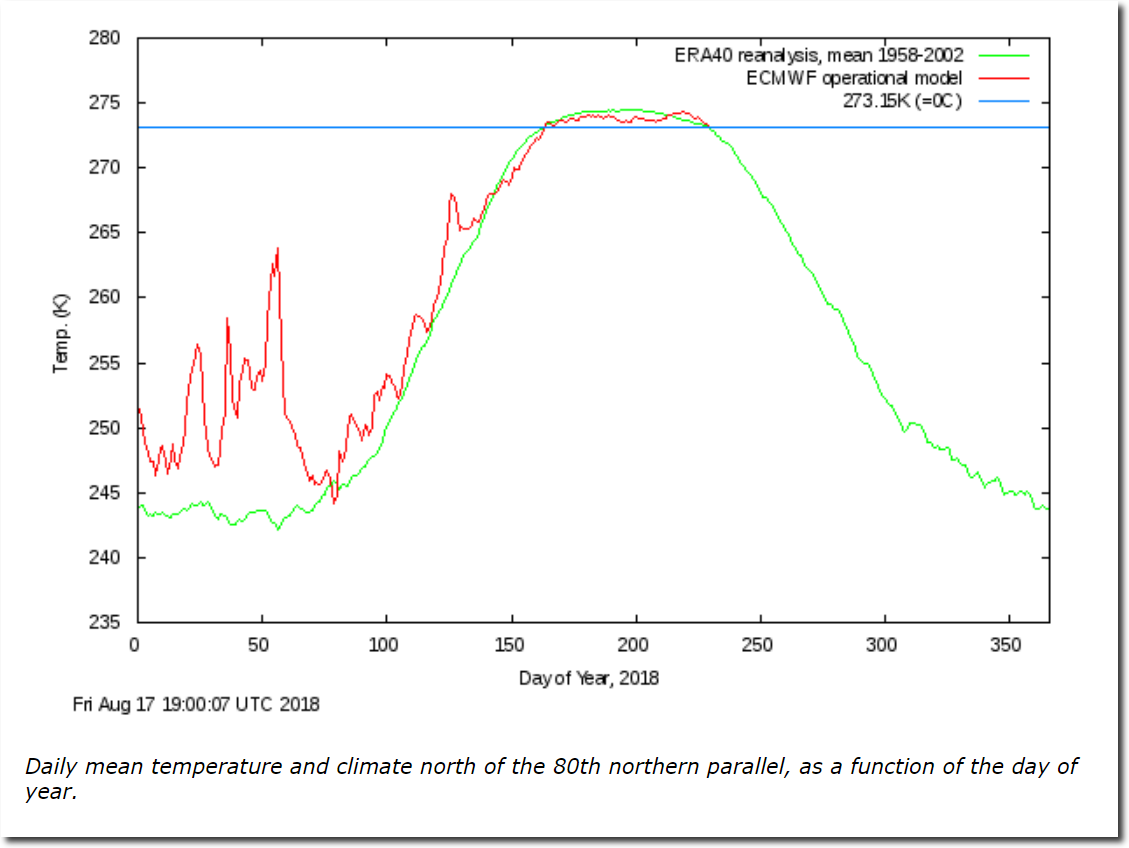
Nevertheless, at current volume melt rates, the Arctic will be ice-free on December 7, 2018 at 3:41 PM.