What If This Happened Now?

This week in 1969, Hurricane Camille hit the Gulf Coast with 200 MPH winds, about 3X the wind speed of Hurricane Sandy at landfall.

This was right at the beginning of the global cooling scare.

18 Mar 1970 – FURNACE OR ICE AGE? – Trove

MAMADOXIE on twitter sent these pictures over.


Posted in Uncategorized | Leave a comment

Because : Science

Posted in Uncategorized | Leave a comment

Reader Locates Global Warming

Posted in Uncategorized | Leave a comment

Global Warming Finally Located

La Jolla, California scientists have finally located global warming, right under their noses.

81-degree reading likely sets record for highest temperature ever measured in California waters – SFGate

This remarkable find required all the skill of finding a needle in a haystack.

anomnight.8.13.2018.gif (1174×640)

These Scripps experts will have to look even harder to find rising sea level.  The animation below shows the beach in front of their office, which hasn’t changed since 1871.

1871    Present

Posted in Uncategorized | Leave a comment

Racist Democrats

Democrats Dukakis, Clinton and Gore fired black women Omarosa and Brazille, just because they were dishonest and corrupt. So basically the same as all Democratic politicians. Check out this article from 2004.

Omarosa’s Long History of Being Fired | PEOPLE.com

Before getting fired by CNN and the DNC for getting caught while hacking the 2016 election for Hillary, Donna Brazille was fired by Dukakis for lying during the 1988 election.

27 Jan 2000, Page 16 – Standard-Speaker at Newspapers.com

Apparently it is only bad for black women to be dishonest and corrupt Democrats.  If they were white, they might be the party’s nominee.

“She was a liar. She was an unethical, dishonest lawyer. She conspired to violate the Constitution, the rules of the House, the rules of the committee and the rules of confidentiality.”

  • Hillary’s Watergate Boss  Jerry Zeifman

21 Nov 1996, Page 19 – The News Journal at Newspapers.com

Dukakis apparfently had some integrity, but now lying about everything is standard operating procedure for essentially all Democratic politicians.

Posted in Uncategorized | Leave a comment

Plummeting Afternoon Temperatures In The Midwest

Midwest afternoon temperatures have been declining for a century.

Summer starts ten days later, and ends ten days earlier than it did a century ago.

The percent of stations reaching 90 degrees has declined over the past century.

The frequency of hot days has plummeted over the past century.


Meanwhile, all of the usual global warming fraudsters claim the exact opposite.

Facts are facts, and junk science is junk science, and never the twain shall meet.

Posted in Uncategorized | Leave a comment

The Incredible Heatwave Of August, 1936

Mt. Vernon, Illinois had eighteen straight days over 100 degrees during August, 1936, and afternoons averaged 105 degrees during that heatwave.

The only other year which cam close to that was 1901, when they had fifteen straight days over 100F. Illinois almost never gets above 100 degrees any more.

There were a total of 46 days over 100 degrees during 1936 at Mt. Vernon.

Mt Vernon averaged 101 degrees during July and August, 1936 – sixteen degrees warmer than this year.

August 15, 1936 was an incredibly hot day in the US, with an average maximum temperature of 94 degrees, and much of the Midwest over 110 degrees.

August 15 temperatures have plummeted in the US over the past century.


It is cold and wet here in Boulder, as the fake news about record heat and fires continues unabated.

Indicator 3.16: Area and percent of forest affected by abiotic agents

23 Jul 1933, Page 12 – Great Falls Tribune at Newspapers.com

TimesMachine: October 9, 1938 – NYTimes.com

Posted in Uncategorized | Leave a comment

July 8th, 1905 – California’s Hottest Day

On July 8th, 1905 California averaged an incredible 104 degrees. More than half of the state was above 105 degrees, and more than a third of the state was 110 degrees or above. Orland, in Northern California was 120 degrees.  CO2 was 300 PPM at the time.


Posted in Uncategorized | Leave a comment

“HATE HAS NO HOME HERE”

This is where I lived in Philadelphia.  I went in that Wal-Mart once, and was the only white person in the store.

The rich white Democratic progressives live on the east side of Highway 309, and they keep the black people in the projects on the west side.

Q. What kind of people put a sign in front of their house with the word “HATE” in bold, capital letters?

A. Progressive Democrats

Posted in Uncategorized | Leave a comment

The Canada Y2K Bug

I have been analyzing the Canadian temperature record, and it is a farce. There are less than 25 stations in Canada with a relatively complete long term daily temperature record .

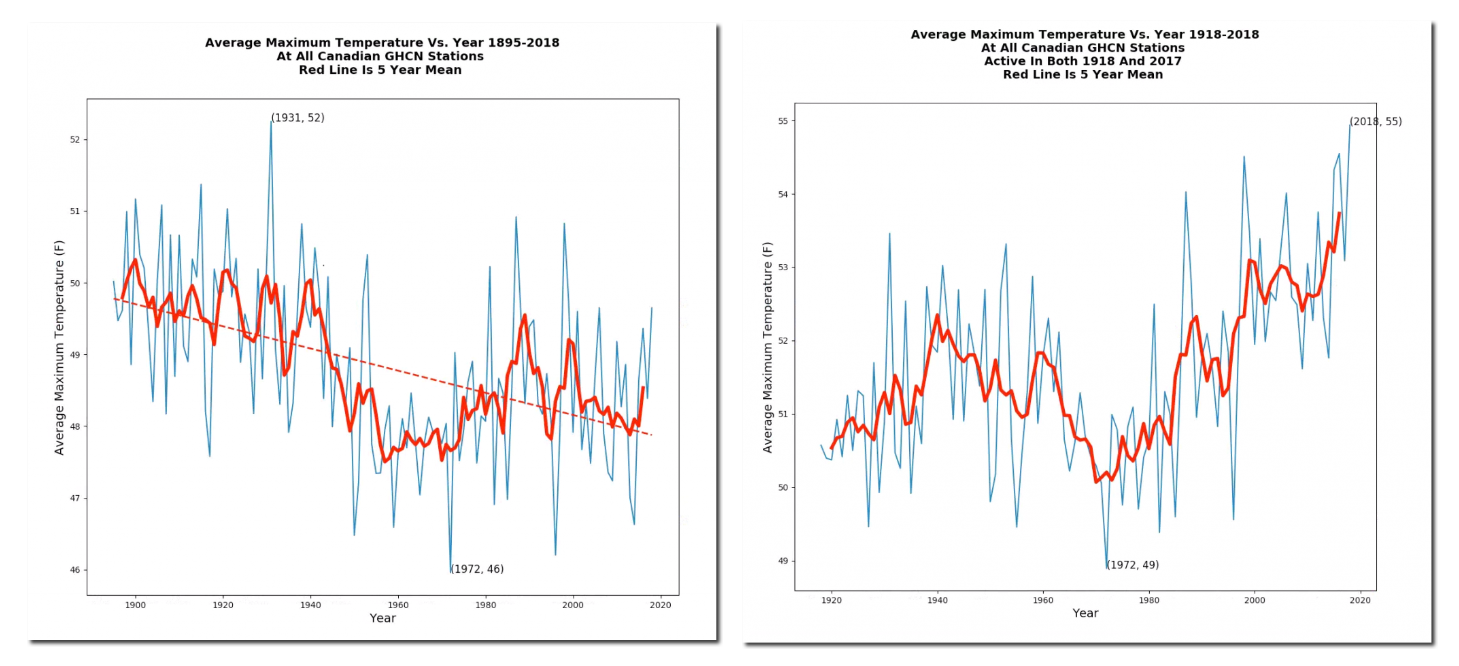
The average maximum temperature for all Canadian GHCN stations has plummeted since the 19th century, but the trend is meaningless because the average latitude of the stations has moved four degrees further from the equator during that time period.


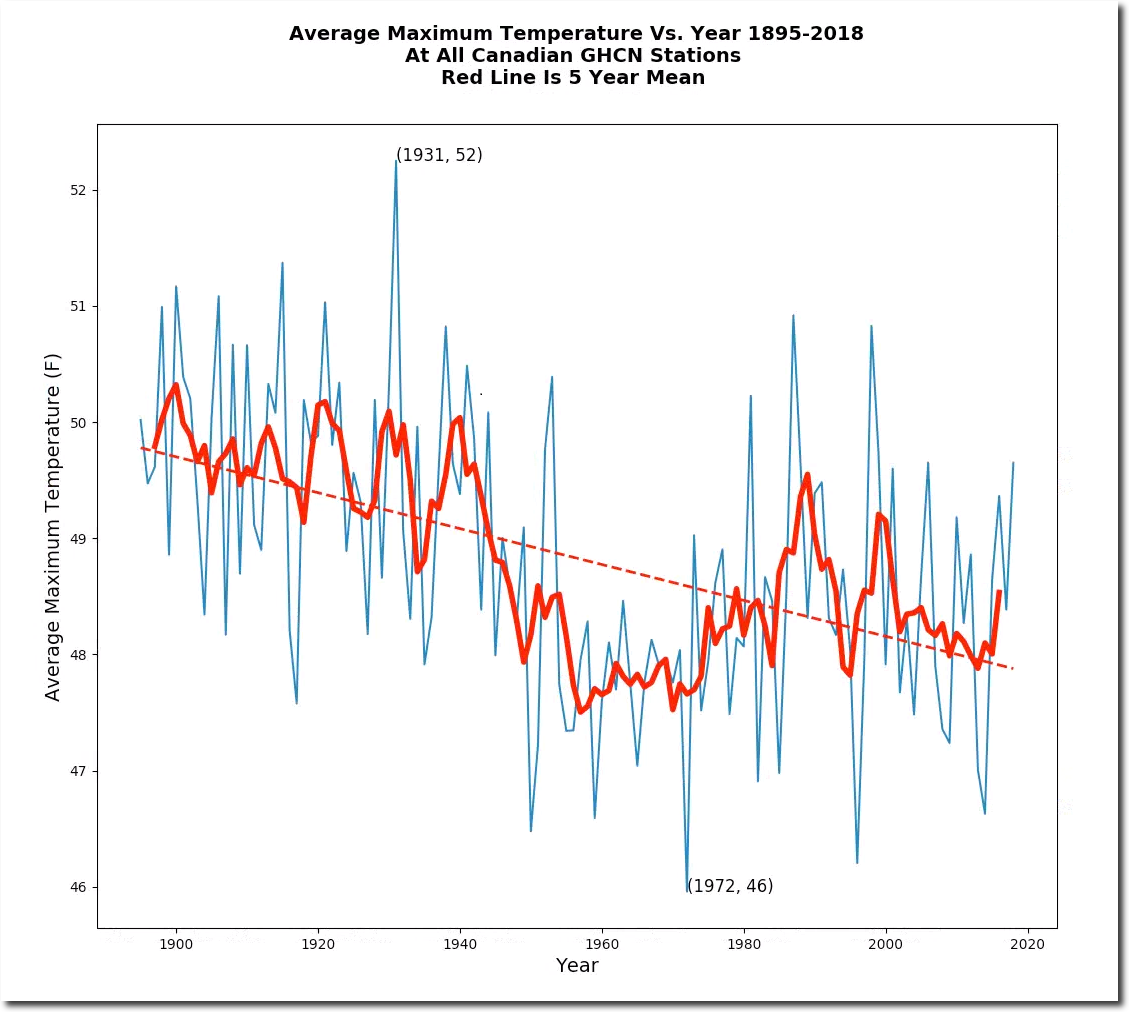
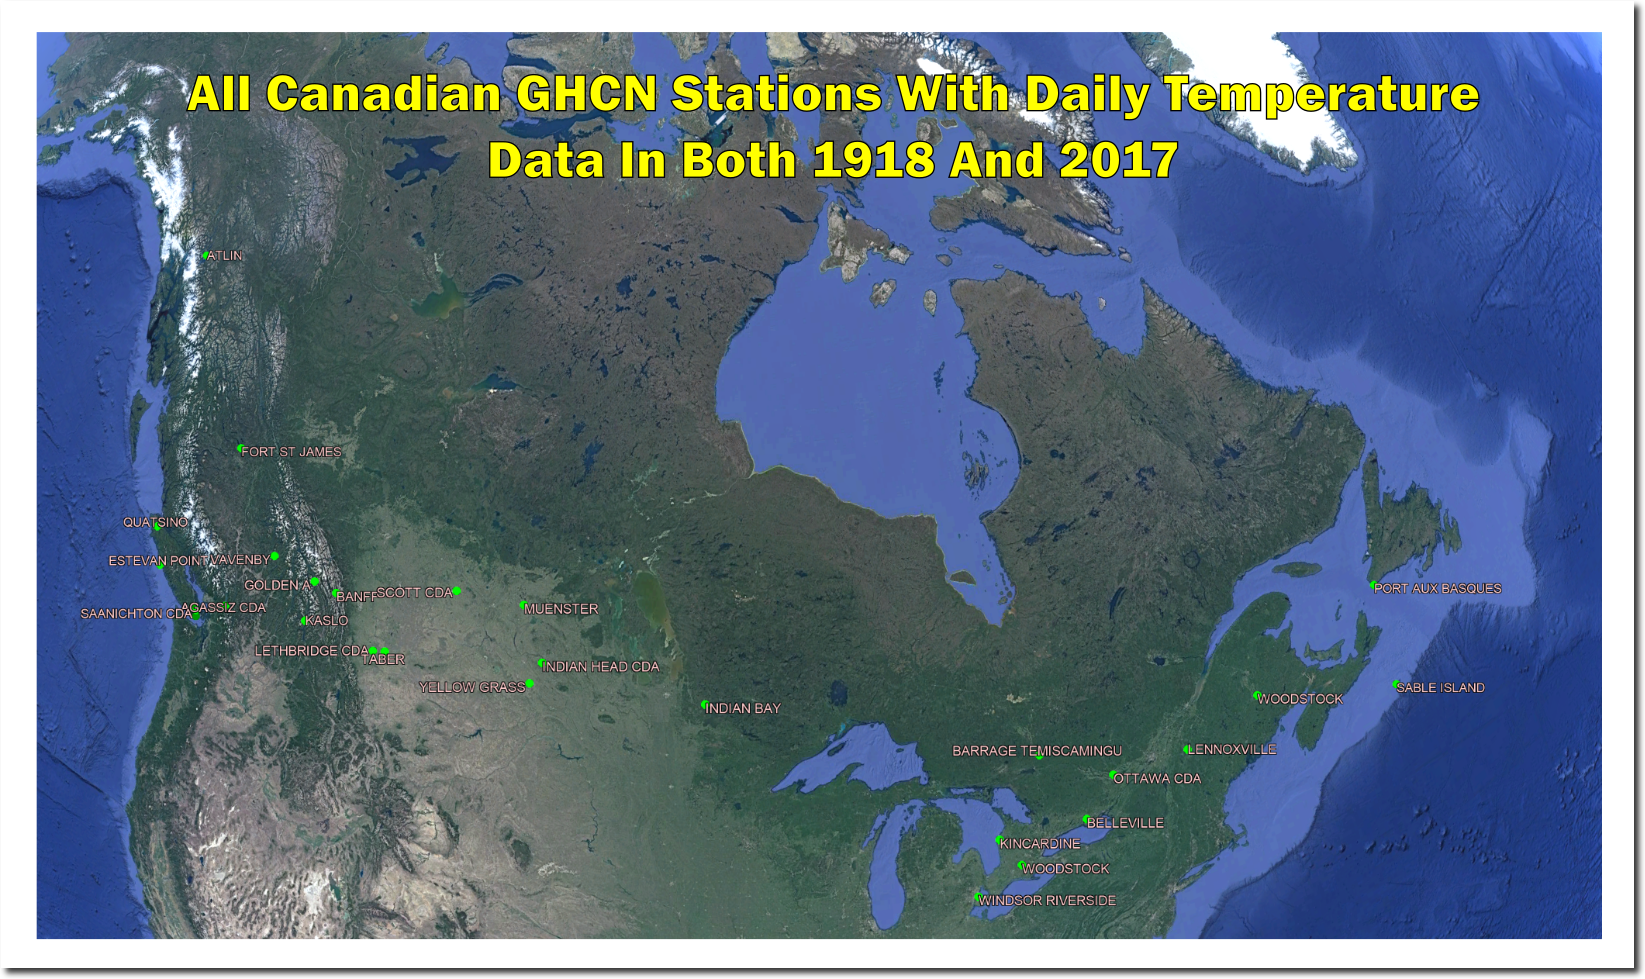
If we look at only the stations which were active in both 1918 and 2017, they show a big jump in temperature at the year 2000. But there are some problems which make the trend meaningless.

First (huge) problem is that there are only about 20 GHCN stations in Canada which have reported consistently for the past century, compared with more than 700 in the US.

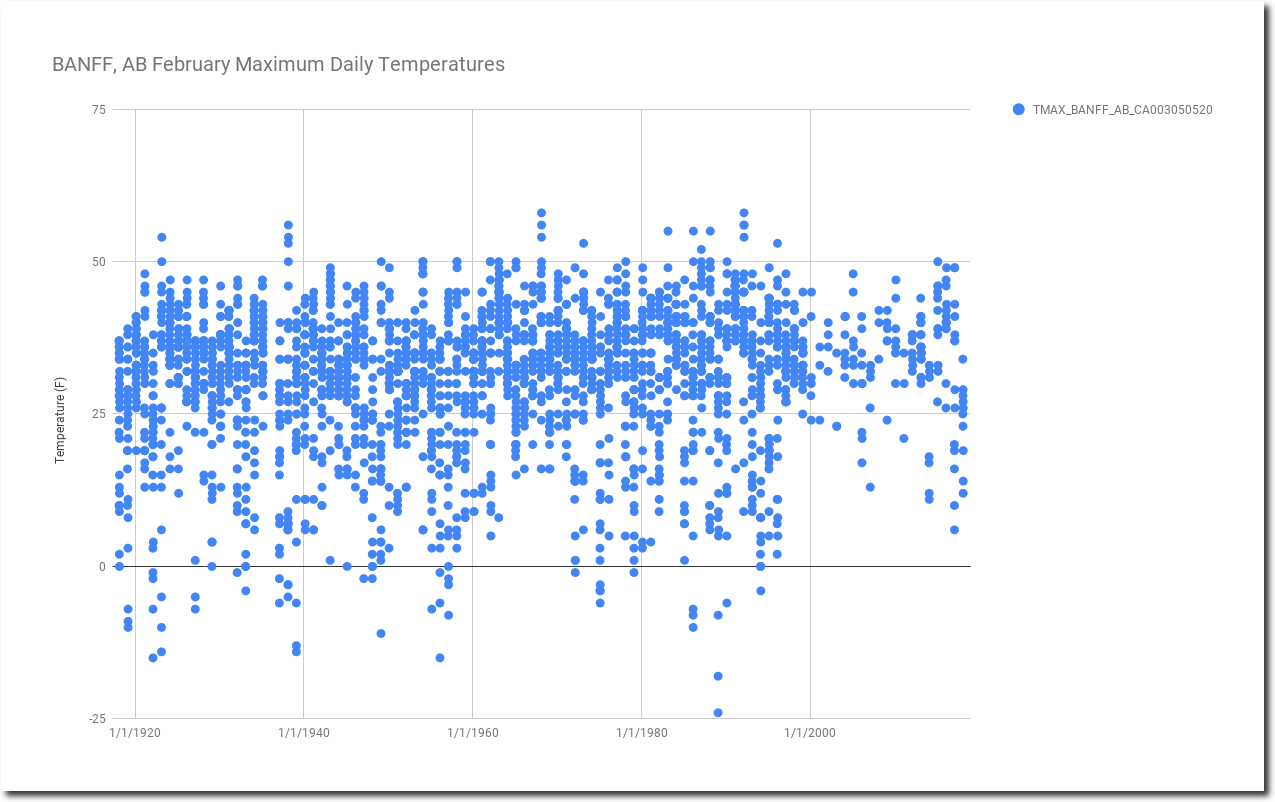
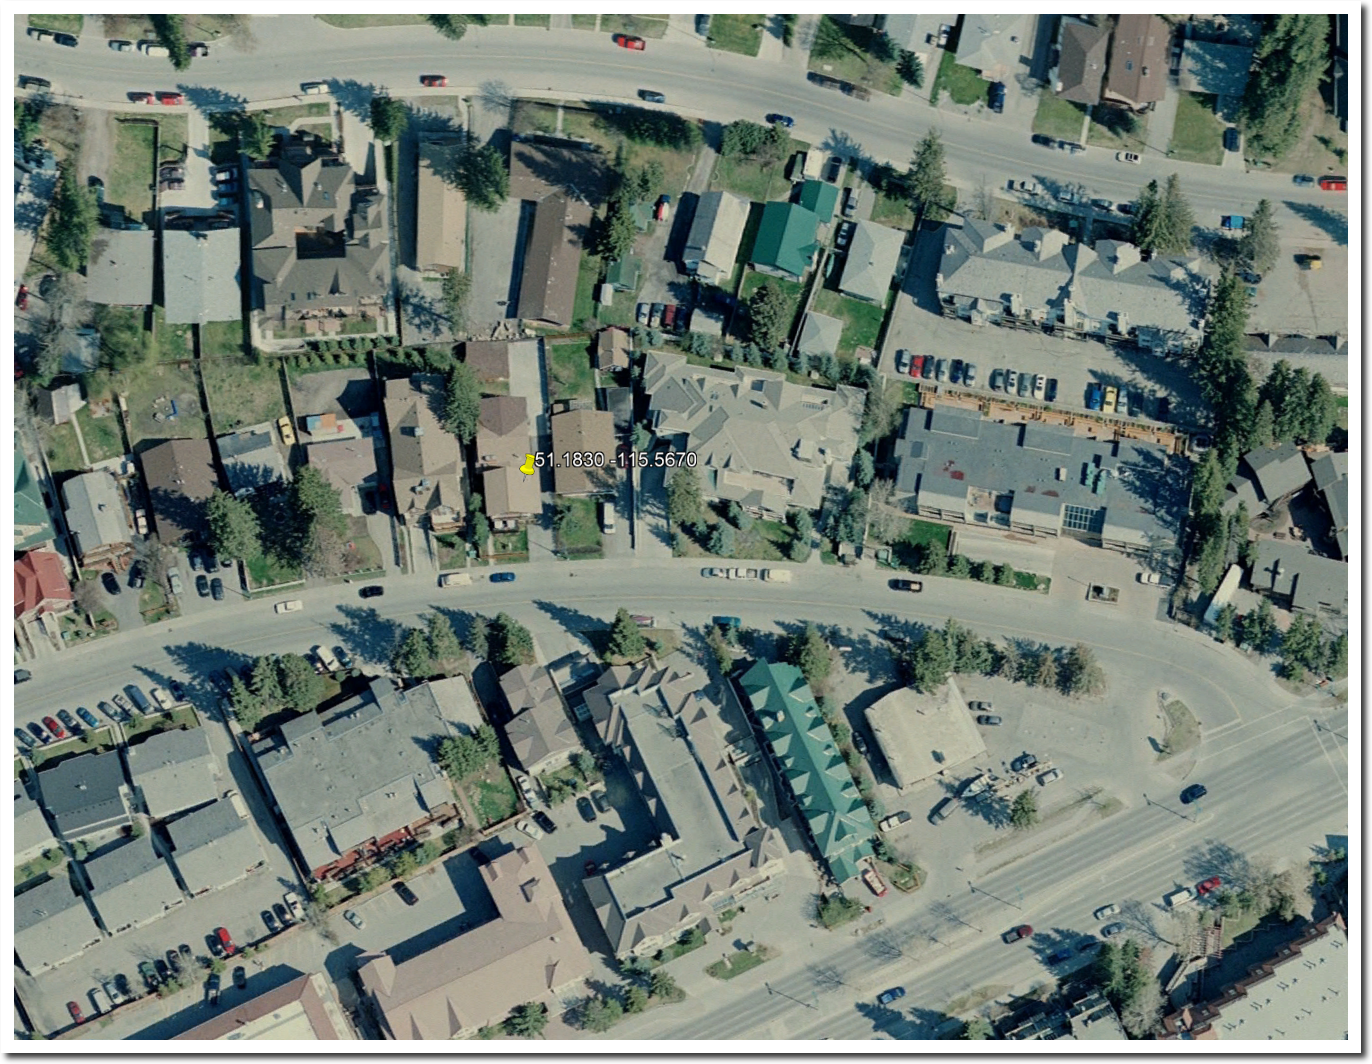
But here is the real killer.  The jump in temperatures after 2000 is largely due to something going on at one station – Banff. Something went seriously wrong with that station after the year 2000, where almost all of the low maximum temperatures disappeared.

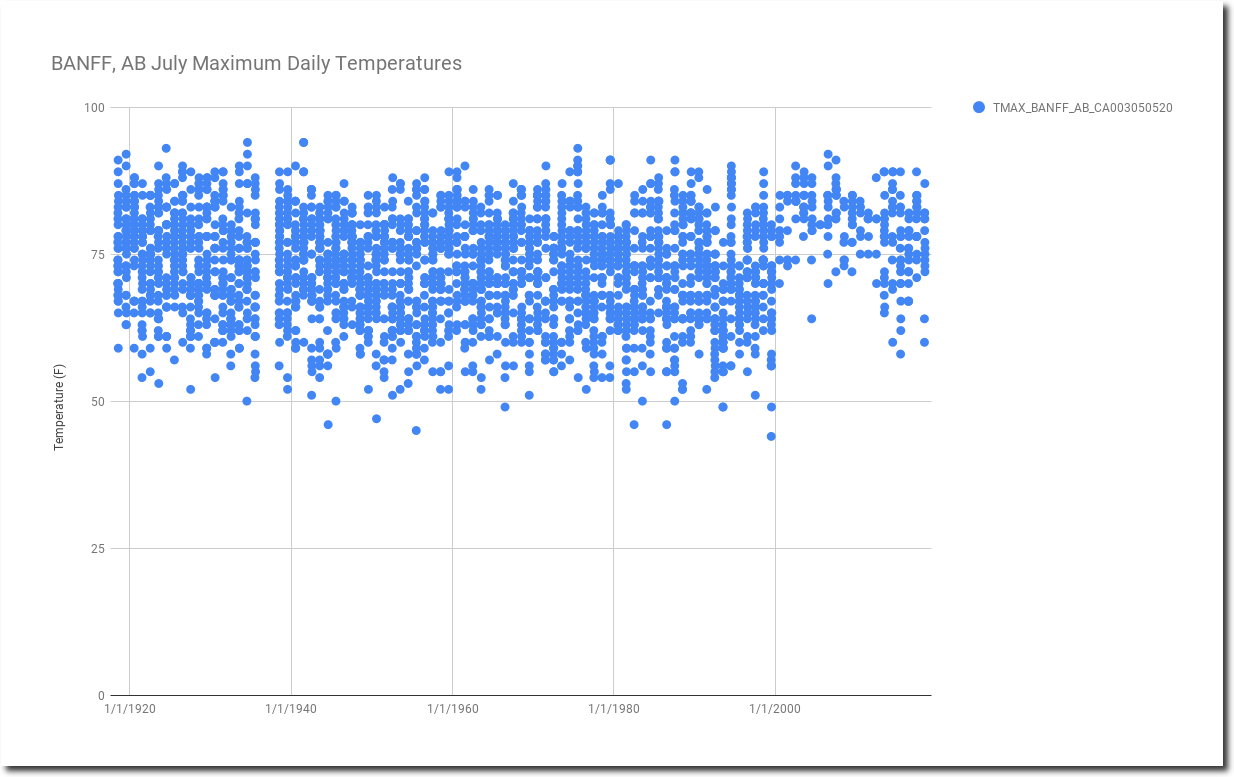
Without Banff, 2010 is barely warmer than 1940.

The yellow pin is at the latitude and longitude where GHCN lists the thermometer. It is almost like the moved the thermometer indoors.

You really can’t make this stuff up. Like just about every other country outside the US, the Canadian temperature record is a farce. I’ve developed some pretty sophisticated tools for detecting these problems, and I doubt that the people at Berkeley Earth, NASA and NOAA are even aware of how awful the global temperature record is.

The number of stations with long term records in Canada and their geographical location is much too small to draw any meaningful conclusions about Canadian temperature trends. You can get whatever trend you want by picking the right set of stations.

Posted in Uncategorized | Leave a comment