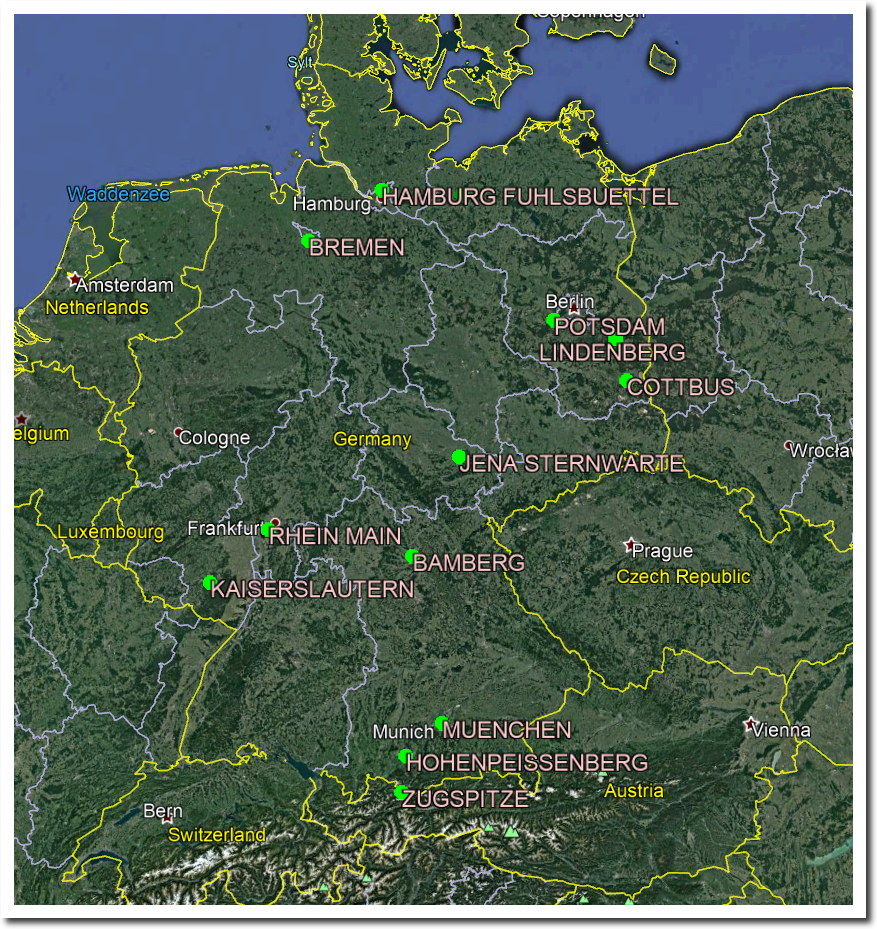
Germany is a little larger than Missouri and Arkansas combined, and has a fairly coherent long term temperature record at 13 stations.
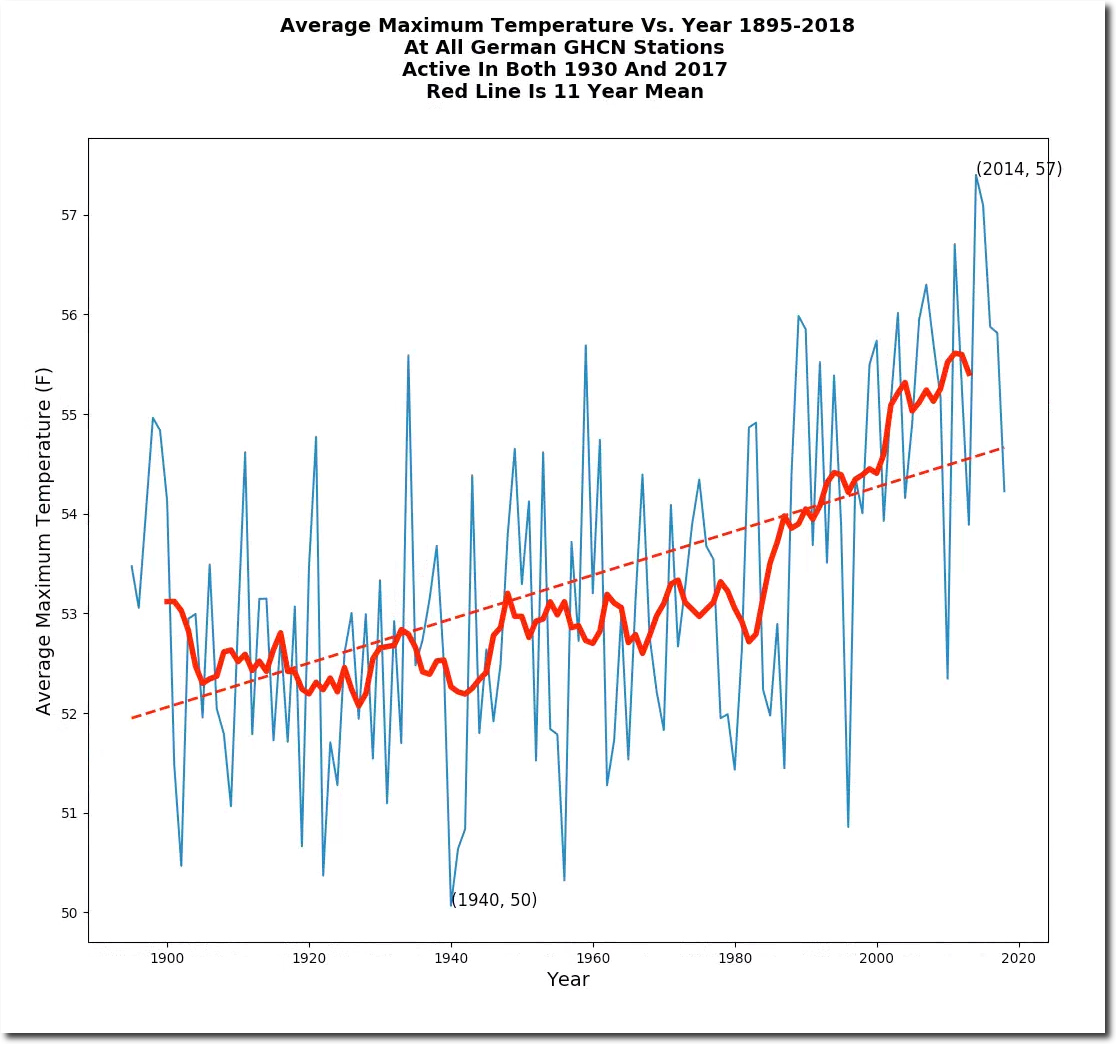
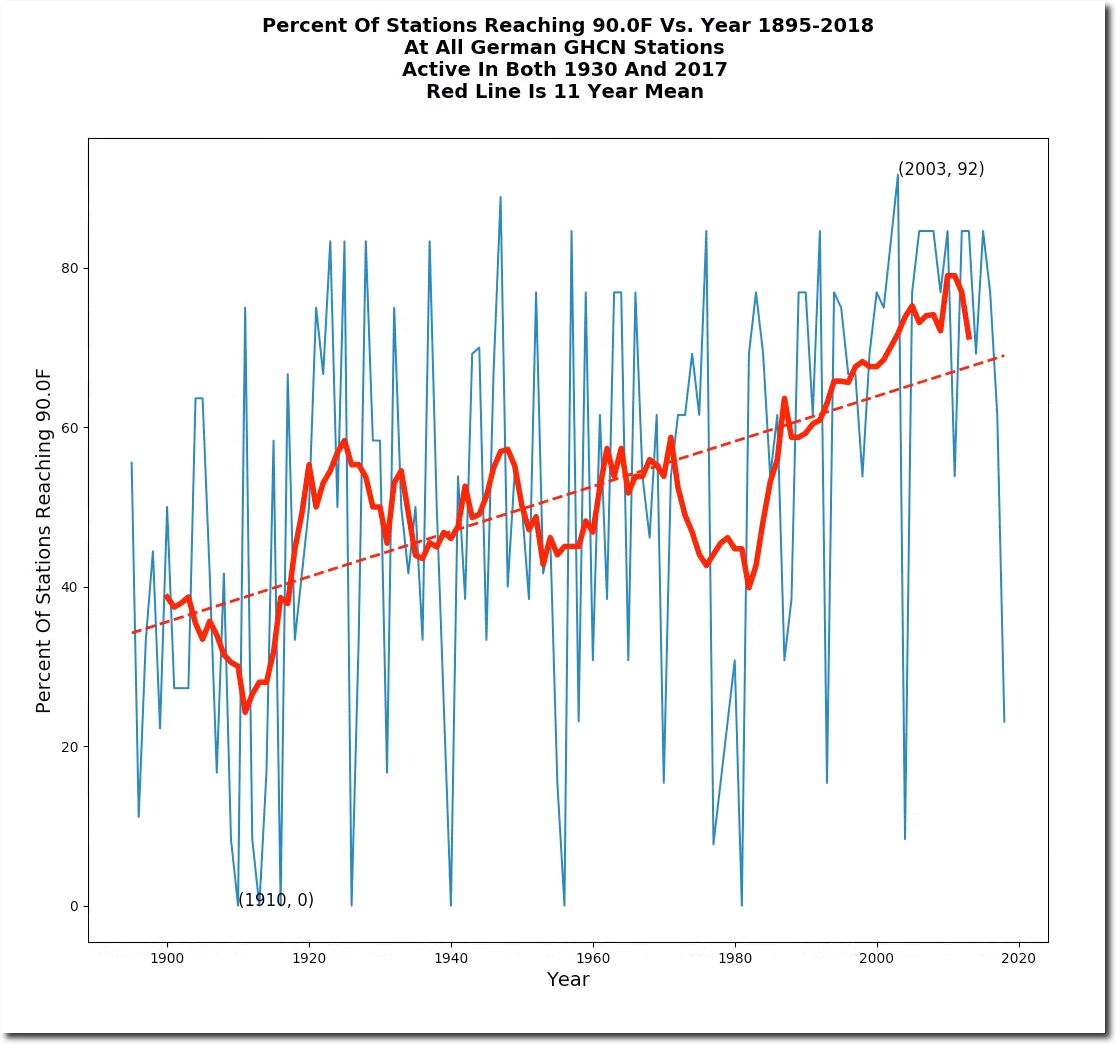
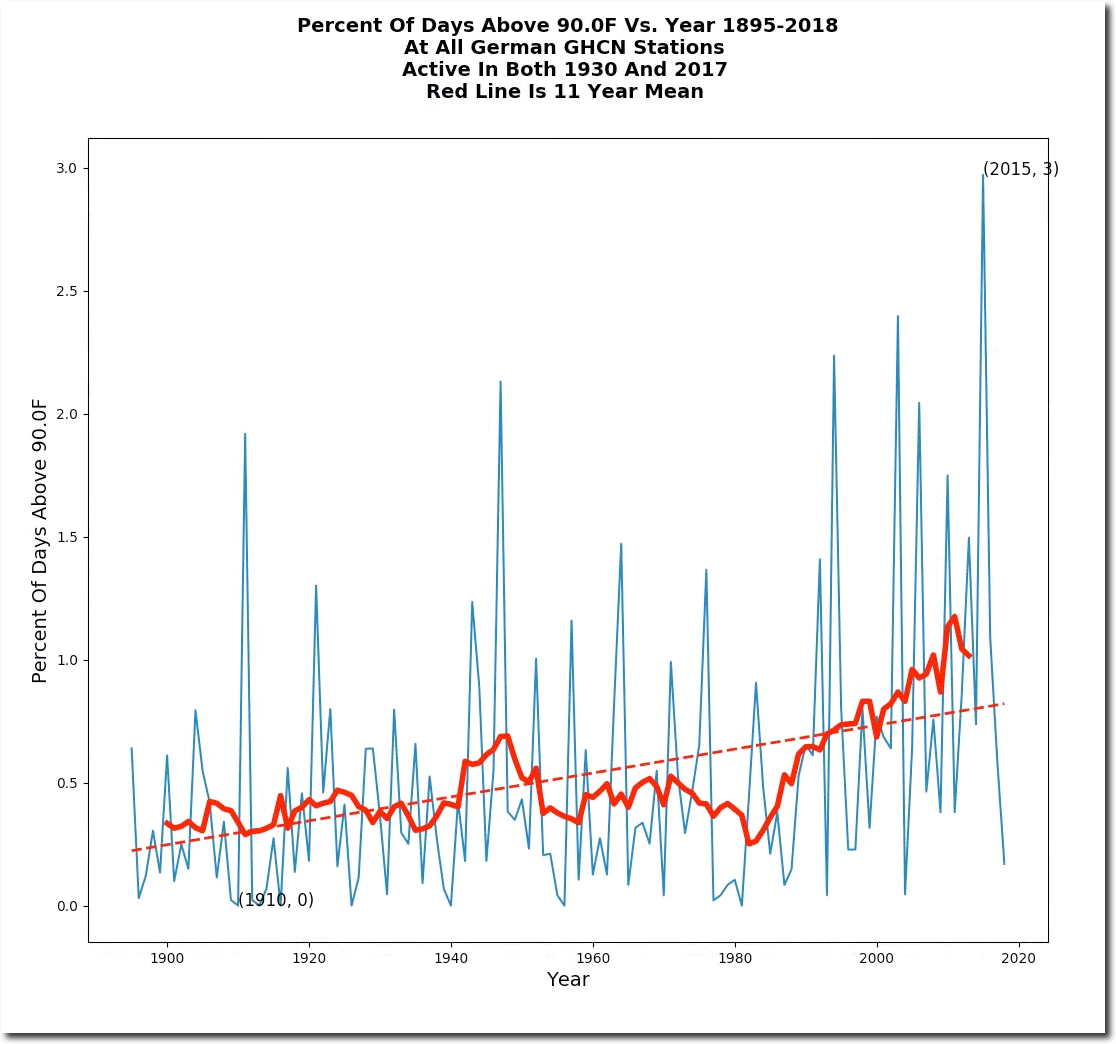
There has been a warming trend in Germany since 1980.
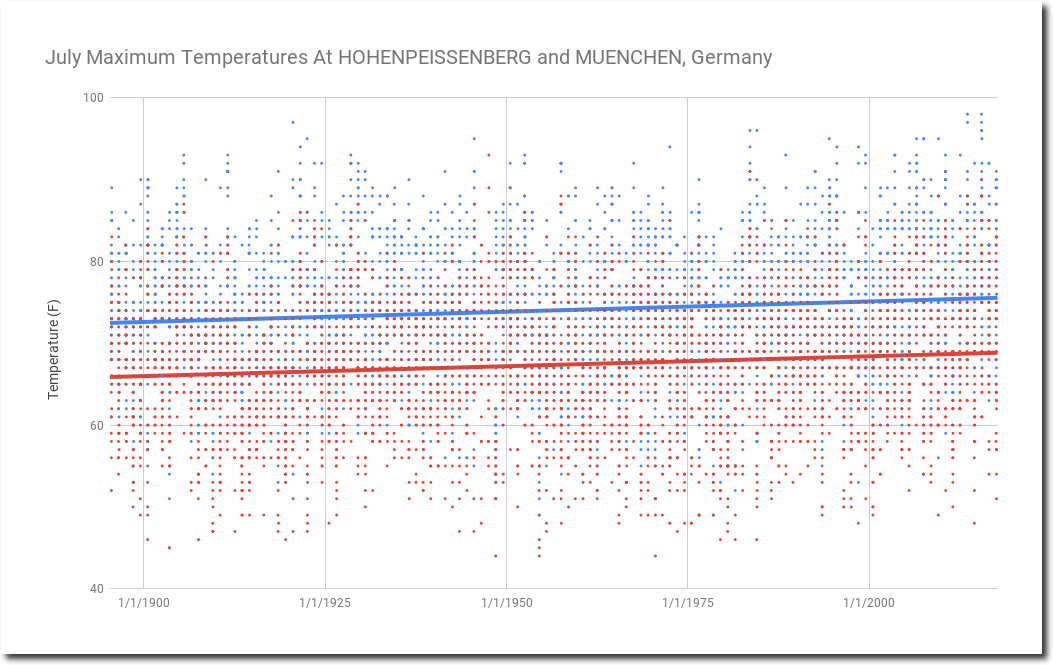
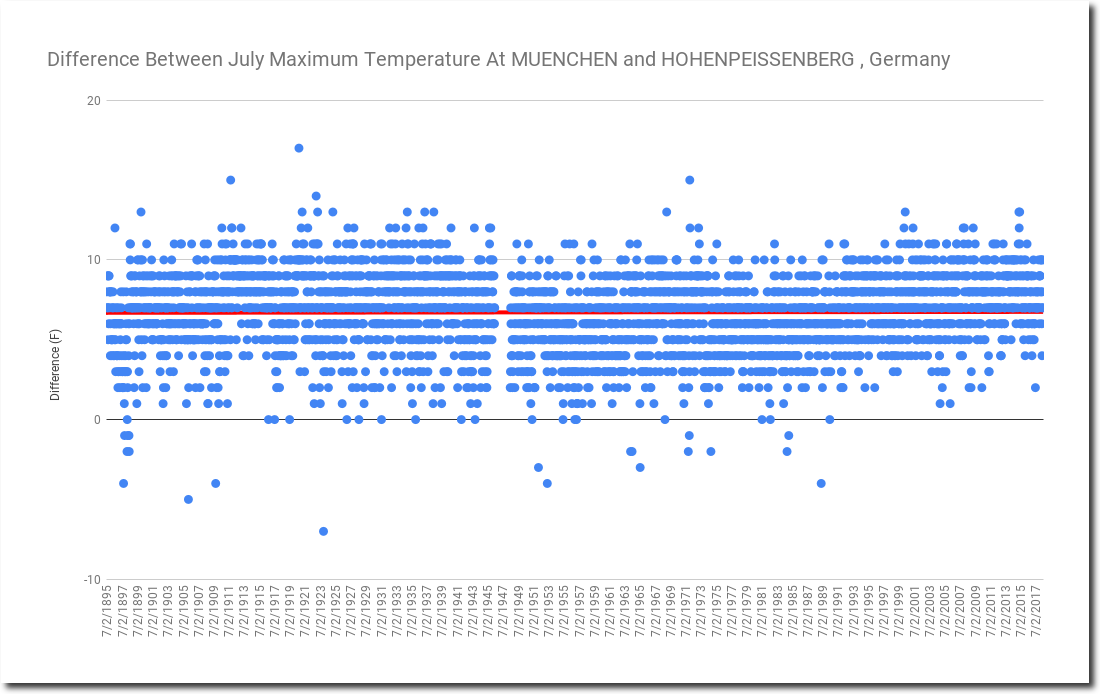
This can’t be explained by UHI, HOHENPEISSENBERG is a rural station at 3,100 feet elevation, and MUENCHEN is an urban station at 1,700 feet elevation.
Munich is warmer, but the two stations track each other very closely.
A typical July afternoon in overheated southern Germany is 71 degrees.
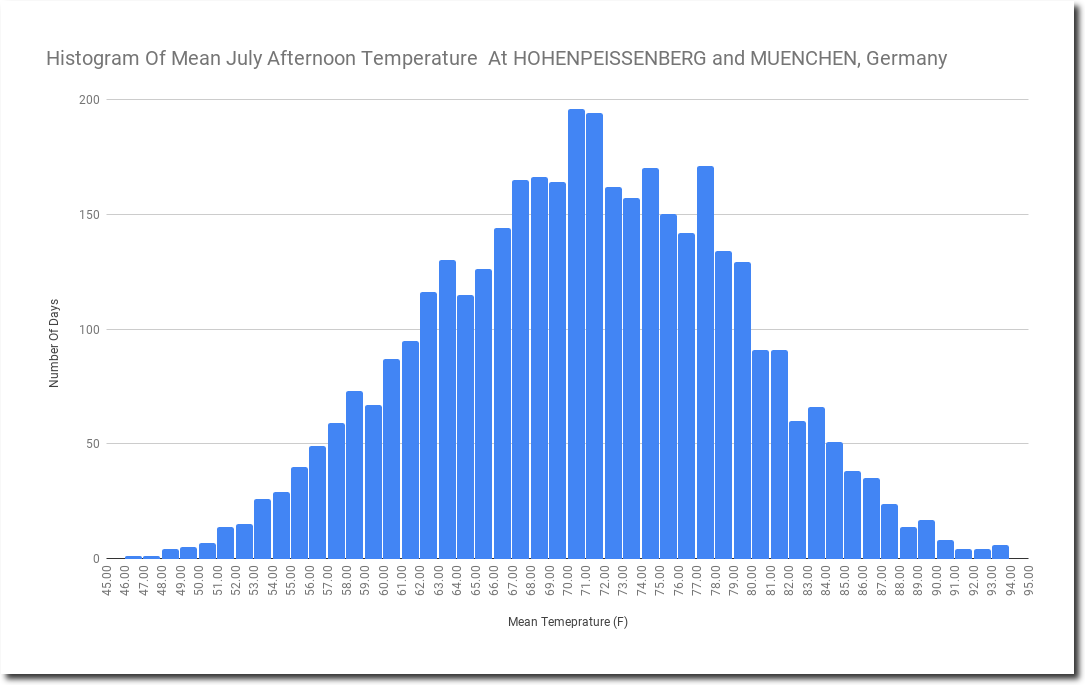
These two stations have warmed considerably since 1980, and I don’t see any reason to think the trend isn’t real.
Very interesting indeed. Could there be more frequent incidence of a chinook-type downslope, warm wind (descending northward from the Alps) over the last X-years? If so, what could drive that? I have zero local familiarity with their meteorological ‘norms’, so pardon me if this is a completely ignorant question.
Tony,
Thanks for reporting that. But, sorry to be of a suspicious mind here, but the next thing I would do is try to see is if that trend holds by looking at nearby countries that are not under German government control or influence. This is to be sure you are not accidentally looking at another Mohonk.
Sorry to be so cynical here, but I have just seen too much….
I’d like to know what Pierre thinks about it.
Tony showed France was not warming.
They homogenized the data in The Netherlands where KNMI is located in De Bilt. https://klimaatgek.nl/wordpress/wp-content/uploads/biltani.gif
So they can push the AGW scam.
The Dutch broadcasting foundation the NOS also is pushing the AGW agenda by publishing lies about the climate change due to man. From the poles that are melting and Greenland to claiming that man kind has prevented a new ice age already by putting greenhouse gasses in the atmosphere.
All lies ofcourse.
Background on the Mohonk saga. FYI:
Mohonk Weather History Offers Insight Into Global Warming
https://www.nytimes.com/2008/09/16/science/earth/16moho.html
How not to measure temperature, part 84: “Pristine” Mohonk Lake USHCN station revisited
https://wattsupwiththat.com/2009/03/22/how-not-to-measure-temperature-part-84-pristine-mohonk-lake-ushcn-station-revisited/
Hohenpeissenberg is not an ideal siting, and the immediate area appears to have had a fair amount of infrastructure added in recent years.
https://www.google.com/maps/place/Hohenpei%C3%9Fenberg,+Germany/@47.8010635,11.0110121,191m/data=!3m1!1e3!4m5!3m4!1s0x479c4be48d79f08f:0x41e48add78bada0!8m2!3d47.7945375!4d11.0063951
But it is no surprise to find warming since 1980.
There was a German meteorologist named Klaus Hager who claimed Germany’s temperature rise from the 1980s to 2000 was entirely due to transitioning from mercury to digital thermometers. How does that fit in if it even does?
I don’t see anything which looks like a step change.
A gradual implementation might not show up as a step, just as increased trend.
It would depend on how the thermometers work. I would imagine that the digital thermometers use a thermocouple. How that thermocouple is mounted, how the voltage is measured, how that voltage is calibrated to a temperature, and so on can introduce a systematic difference. Now if it’s done properly any difference should be trivial to none of course.
Nothing trivial here…
Differing daily measured values from the old and new sensors for temperature measurement spurred the author [Hager] to conduct a comparison spanning from January 1, 1999 to July 31, 2006 at Fliegerhorst Lechfeld (WMO 10856) 8-1/2 years long, daily without interruption, among other comparison tests of mercury maximum glass thermometers in a Stevenson screen and a Pt 100 resistance thermometer inside an aluminum enclosure, both unventilated. The 3144 days yielded a mean difference of +0.93°C; the Pt 100 was higher than the mercury thermometer. The maximum daily difference even reached 6.4°C!
http://notrickszone.com/2015/01/13/weather-instrumentation-debacle-analysis-shows-0-9c-of-germanys-warming-may-be-due-to-transition-to-electronic-measurement/#sthash.zK7f0by5.o2xFsZEd.dpbs
Once again, we can find a thousand better explanations for “warming”, than the old debunked man made CO2.
More sun hours since 1980 as in Sweden?
Trend is obvious with 10-15% more sun hours during 30 years.
Solar brightening due to cleaner air!
There is that. Nationalsocialists joined the East German communist party in droves after May, 1945, and all those dictatorships’ pollution was horrendous to everyone but intellectuals of the looter persuasion. The “seeing” has to have improved since the second collapse of socialism.
True. All watermelons today should see what terrible environmental destruction their Progressive founding fathers caused over decades in the socialist paradise.
But then again, few would care. Their brains have been programmed to discount such unpleasant things by saying that this time round they’ll get it right. And those I know personally like their comfort and don’t like to go to icky places. The revolution is much more fun when they can stop at a cafe after a rally and then go home to a functioning neighborhood with running water, HVAC, full fridge and internet.
What watermelons/millennials should know before they start changing society in an utopian ‘better’ world..
https://youtu.be/XbOeO_frzvg
The air over Germany in the sixties and seventies was like the air in china’s cities today.
Most of it came from using brown coal for cheap energy to produce the german industrial boom. Also remember that there was no germany left after the second world war.
1980 was near the bottom of a general 40 year world wide cooling period, starting around 1940.
It is possible that Lasse has a point about cleaner air. I was thinking the same thing that Germany was a heavily industrialized nation back in the 1980’s with some very dirty air that has been cleaned up. Perhaps it is an area that does not naturally clear itself with wind so any cleaning up makes a big difference regarding solar brightening like Beijing is now with their sulfur dioxide cleanup efforts . Worldwide the sulfur dioxide cleanup has to amount to several large volcanoes and one volcano can cool the world as shown in 1992 with Pinatubo. The greens have blamed the 1940 to 1975 cooling period on sulfur dioxide pollution but do not seem to mention it as a large cause of warming with it’s removal alongside the ocean warming cycles of course. In recent years there has been a large drop in So2 with shipping now included in the cleanup which was a large source of So2. It is ironic that the greens are doing their best to warm the planet. Instead of fracking and using natural gas to replace coal which creates no Co2 in the conversion they are creating large amounts of Co2 building windmills and solar panels that takes 30 yrs to offset. Also “green” nations are building coal plants to replace nuclear that is Co2 free. Go figure.
Ask an astronomer. Jos Tomkins of the U. of Texas at Austin was the first to comment on water vapor being a more important greenhouse gas than CO2 (in The Atlantic magazine). But almost none of his colleagues were aware of the fact back in the 80s-90s. Maybe their recent records could shed more light on the issue.
The CO2 climate crowd intentionally dismisses water vapor unless viewed as a function CO2 concentration.
They also don’t seem to know that burning hydrocarbons produces H2O.
Maybe it would not be wrong to take a look at 10/11/01
The days after the terror attacks it was forbidden for planes to fly=less airpollition,clearer skies,more lux.
Would be interressting to see wether there was some kind of significant impact.
(though i’m more from the primitive side,therefore i think this could be just a regional climate shift(that resultee in a kind of hot spot)
Anthony… “coal which creates no CO2 in the conversion”… could you clarify that, I’m not following
I think it’s a confusing sentence structure and “no CO2” relates to natural gas as compared to coal.
And “conversion” relates to the transition to windmills, PV, etc.
got it…
A really big event occurred on November 9, 1989.
do you think that the thermometers of east germany may have been adjusted to west german standards to fit some narratives? :)
I think all sorts of things changed and none of them can easily be controlled for.
And the results of the US election were finally determined on November 9, 2016.
What I enjoyed seeing was the near-flat period from 1920 to 1980, but with wide variation.
Tony, what is the source of your data ?
NOAA’s GHCN daily data set. You can find it on their site. Anyone can download it…very large file and you need to be able to program to parse it efficiently.
the authors of GHCN v1 (lead Russel Vose) – which was basically a gathering of data exercice – already tampered with data in the 90s .. I documented an example for Iceland at euanmearns.com (http://euanmearns.com/stykkisholmur-iceland-temperatures-from-reality-to-ghcn-v1/)
from v1 to v2 and v3, it only got worse ..
everything based on GHCN is not really trustworthy ..
Russia especially Siberia and China not warming would make the leftist explode.
It would be interesting to see an analysis of all the data from just here, if it was available:
http://notrickszone.com/2018/01/19/rare-weather-station-unchanged-over-138-years-data-show-no-co2-impact-on-temperature/
A rather benign temperature record
http://www.irisheconomy.ie/wp-content/uploads/Dublin%2009.jpg
Everyone is agog about horrendous climate change, but whenever you ask them for evidence of it they can’t show any.
More like the evidence is urban heat islands or doctored graphs.
It is nice to know there are places where the earth is warming.
https://www.dwd.de/DE/forschung/atmosphaerenbeob/zusammensetzung_atmosphaere/hohenpeissenberg/bild/lange_tempreihe.jpg
actually Hohenpeißenberg is one of the oldest continually active stations that never changed, as it was run by a monastery.
When you say never changed, do you mean same environs, method, and instruments and housing?
‘was run’ implies no longer, so electronic instruments installed when, c.1980?
Solar brightening:
https://journals.ametsoc.org/doi/pdf/10.1175/BAMS-D-11-00074.1
” Particularly, anthropogenic
emissions, such as sulfur and black carbon, increased
from the 1950s to 1980s but decreased thereafter
in the Northern Hemisphere “
https://eu-interact.org/field-sites/sonnblick-observatory/
https://www.sonnblick.net/en/
Sonnblick Observatory was built in 1886 at the summit of Sonnblick Mountain,
https://www.sonnblick.net/en/data/time-series/
or for berlin since 1700.
http://www.geo.fu-berlin.de/met/ag/klimod/MitarbeiterInnen/ChristopherKadow/Pictures/02_IAG_GlobalerWandel_Abschlusspublikation2011_Kapitel_Umweltwandel_Cubasch_u_Kadow.pdf
there was a big stepchange in 1988 for most of central Europe, I guess together with the AMO.
that’s a very interesting article ! thanks Heinrich .. :-)
The German Met Service (DWD) used to show this picture:
What warming Tony? Heinrich’s chart from the DWD shows it was slightly warmer in 1810 than 2000!. Chart from Wikipedia agrees …
why you say “used to” Heinrich ?
did it change ?
Interesting article. I previously suggested that reducing pollution levels has led to warming as smog causing, sunlight reflecting pollutants are removed.
So it is interesting that when I look at pollution Germany I find: “As early as 1977, green groups participated in elections to district parliaments. In the European elections of 1979, several such groups put up candidates with a “green label”, attracting almost one million votes.[7] During the rise of the green party, environmental issues triggered major and partly violent conflicts. Since the late 1980s, a more cooperative policy style developed between the various actor groups and institutions. The high integrative capacity of the German political system and the willingness of the “organized” green movement to become more cooperative are important features explaining the mostly cooperative climate policy that followed in the 1980s.”
This seems to fit the timescale.
You might know, but the met office has UK sunshine data, you can play around with it here:
https://www.metoffice.gov.uk/climate/uk/summaries/actualmonthly
There is a mostly a fairly convincing (but not surprising) correlation between increased sunshine and temperature. (Note the sunshine records start in 1929, the temperatures in 1910.)
Mike Haselers explanation is really not far besides the truth .Germany is still a largely corporate society aimed at incorporating the latest trends in political fashions .During the 80s these were the greens ,although their background already originates from the third reich , and nowadays it is islam . Without valueing these streams of thinking you may conclude that both movements do not have a high esteem for a truthful description of the facts : To get their message across is of paramount importance and the facts are another matter . In this light a slight manipulation of the facts by preprogrammed civil servants is not to be excluded . Here in Holland the Dutch meteorological institute KNMI was caught redhanded last year manipulating the to cold temperatures disproving the CAGW theory . It so happens that fiction is stronger than reality .
MajorityGermans will not accept their children marrying a Muslim so good job to the German propoganda machine!
If muslim families have 4 or 5 children and not muslim families just 1/2 a child than the future will be muslim. The question is not if but when they will become the majority .
For you chemists out there…. A German group is researching burning pure SULFUR in a new green-energy schema. I thought this was interesting and sort of ironic…
You combust sulfur to create steam and run a steam turbine/generator unit as usual. This produces SO2 which is wet-scrubbed, resulting in weak H2SO4.
The H2SO4 is concentrated using a solar-thermal system (I assume parabolic mirrors). The sulfur is reduced back to elemental form.
The process is repeated.
Anyone heard of it?
No, but it kind of sounds like our pie-in-the-sky thermal depolymerization
process commercialized by Changing World Technologies back in the ’90s
that converted turkey offal into a type of high quality crude oil. The plant
in Carthage, Missouri was apparently technically successful, but was shut
down repeatedly by officials over complaints about odors from locals.
Although lawsuits were dismissed, the company eventually declared bank-
ruptcy and was acquired by a Canadian company in 2013. The Carthage
plant is still not operating, though. The process appears to work, but the
NIMBYs don’t want it in their town. Meanwhile, millions of tons of poultry
offal and cattle waste get disposed of as pollution.
You can read up on this on Wikipedia.
“A typical July afternoon in overheated southern Germany is 71 degrees.”
It cracks me up when warmists refer to “hottest year” ever… and the average temperature was in the upper 50s.
Could it be down to cleaner/clearer air?
Hi Tony,
RAW HOHENPEISSENBERG Station Data From Berkeley Earth does not Seem To Have The “Strong Warming” Exhibited In The Real Climate Science Chart Shown.
Maybe The Real Climate Science Chart Has Been “Homogenised” To Match Nearby Urban Locations?
Comments From Tony Heller Would Be Appreciated …
Hi Tony,
Just resending the previous chart which I omitted to crop ……..
RAW HOHENPEISSENBERG Station Data From Berkeley Earth does not Seem To Have The “Strong Warming” Exhibited In The Real Climate Science Chart Shown.
Maybe The Real Climate Science Chart Has Been “Homogenised” To Match Nearby Urban Locations?
Comments From Tony Heller Would Be Appreciated …
Hi Tony,
Can’t find a similar station for Munich, which you say closely tracks HOHENPEISSENBERG…
Here is the link for the Berkeley Earth station list.
http://berkeleyearth.lbl.gov/station-list/?phrase=munich
Which is the one featured in your article?
Hi Tony,
I think I’ve found it!
You have to use the keyword “Muenchen” not “Munich” in the serach.
It covers back to 1880 and shows much more warming than RURAL Hohenpeissenberg.
Looks like RURAL Hohenpeissenberg has been “homogenised” to match URBAN MUENCHEN-STADT!
Here’s the link http://berkeleyearth.lbl.gov/stations/155053
RE “Looks like RURAL Hohenpeissenberg has been “homogenised” to match URBAN MUENCHEN-STADT!”
All too likely.
So Germany’s temps are increasing as they transition to wind power and solar.