More Canadian Nonsense

I’m looking at what has caused the spike in temperatures in Canada the last five years.

There are only 85 stations in Canada which were active in both 1950 and 2017, and many of these have intermittent data during that time.

I found another flaky station, which since 2014 is reporting many fewer days, and seems to be losing all of the low temperatures.

It doesn’t take very many stations like this to create a large fake upwards trend.

Posted in Uncategorized | Leave a comment

Arctic Sea Ice About The Same As 1971

National Geographic published this map in 1971, showing the extent of Arctic sea ice at the end of summer.

1971

We are nearing the end of summer, and the ice in some regions is more extensive now than it was in 1971.

NASA Link

N_20180812_extn_hires_v3.0.png (1461×1740)

Arctic sea ice volume is fourth highest since 2003, and melting very slowly.

This is why NOAA hides the pre-1979 sea ice data.  It wrecks their Arctic melting scam.

1990 IPCC Report

NOAA wants you to believe that time began in 1979, the peak year for Arctic cold and Arctic ice.

ftp://ftp.oar.noaa.gov/arctic/documents/ArcticReportCard_full_report2016.pdf

The graph below explains how climate alarmists do their junk science.

V2 Measured

Posted in Uncategorized | Leave a comment

Whatever You Do, Don’t Throw Me In That Briar Patch

Posted in Uncategorized | Leave a comment

Plummeting August 13 Temperatures In The US

August 13th afternoon temperatures have plummeted in the US over the past century, as has the frequency of hot days.


On this date one hundred years ago, almost the entire US east of the Rocky Mountains was over 90 degrees.

On this date in 1936, the average US afternoon temperature was 93 degrees. Kansas was 119 degrees, Oklahoma was 116 degrees, and Texas was 114 degrees.

On this date in 1944, two thirds of the US  was over 90 degrees, and there were 100 degree temperatures coast to coast.

Posted in Uncategorized | Leave a comment

Tamino Finally Admits That My Graphs Are Accurate

Science is the belief in the ignorance of the experts

Richard Feynman

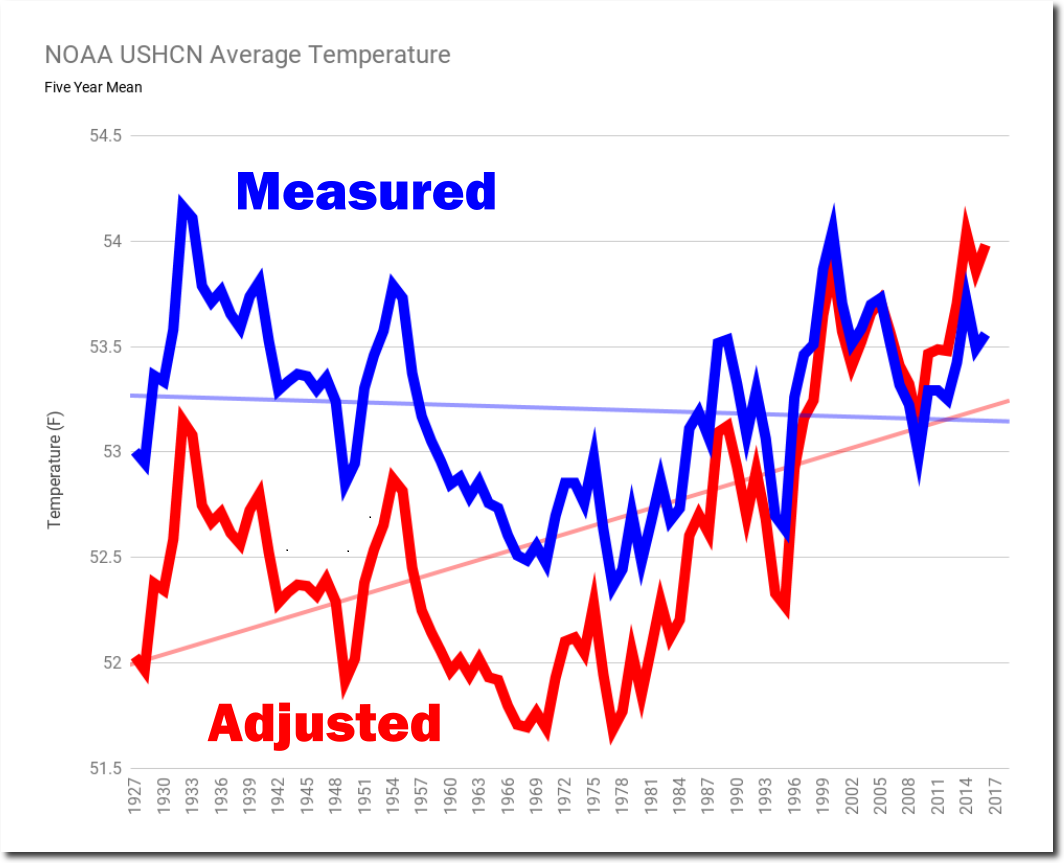
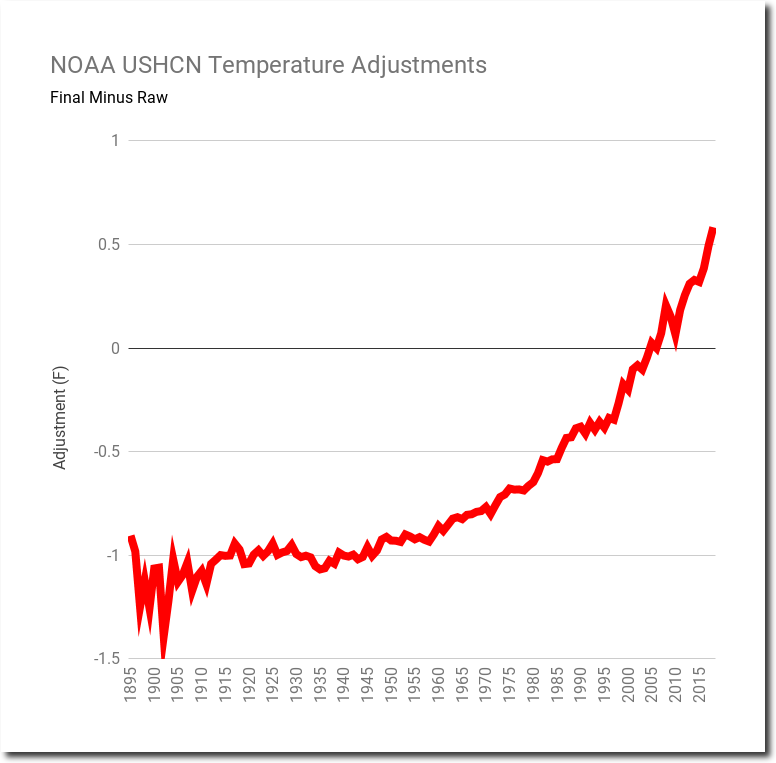
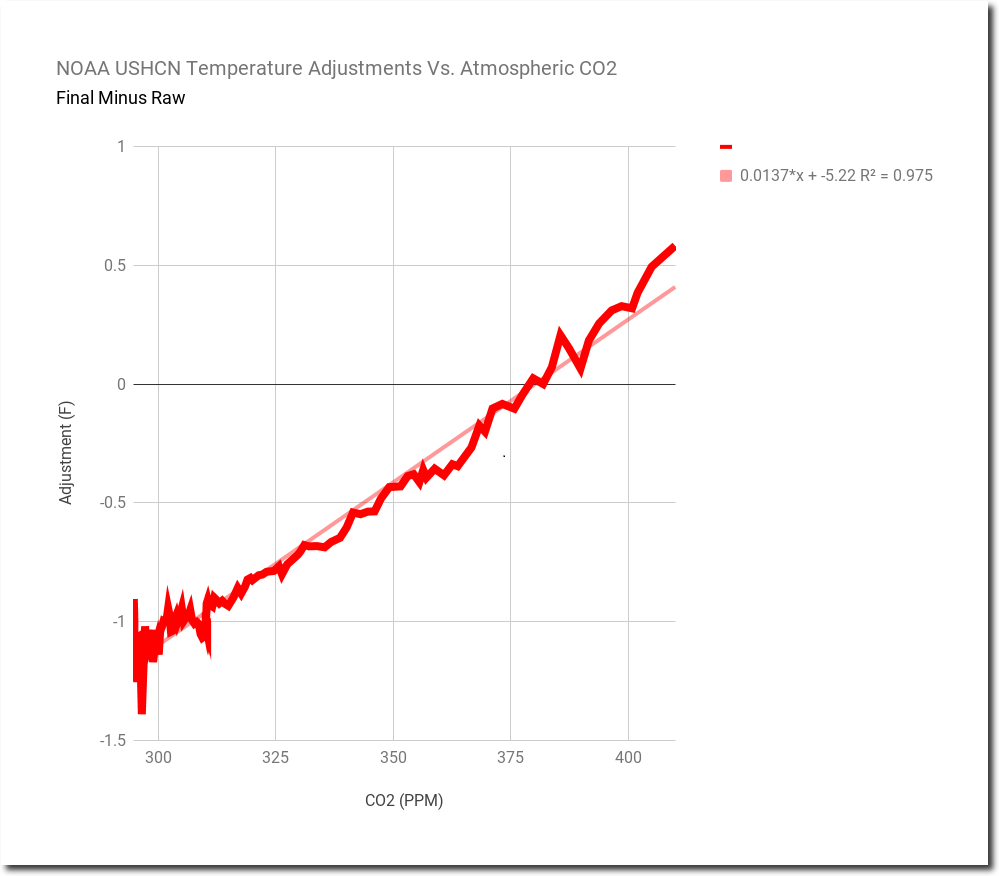
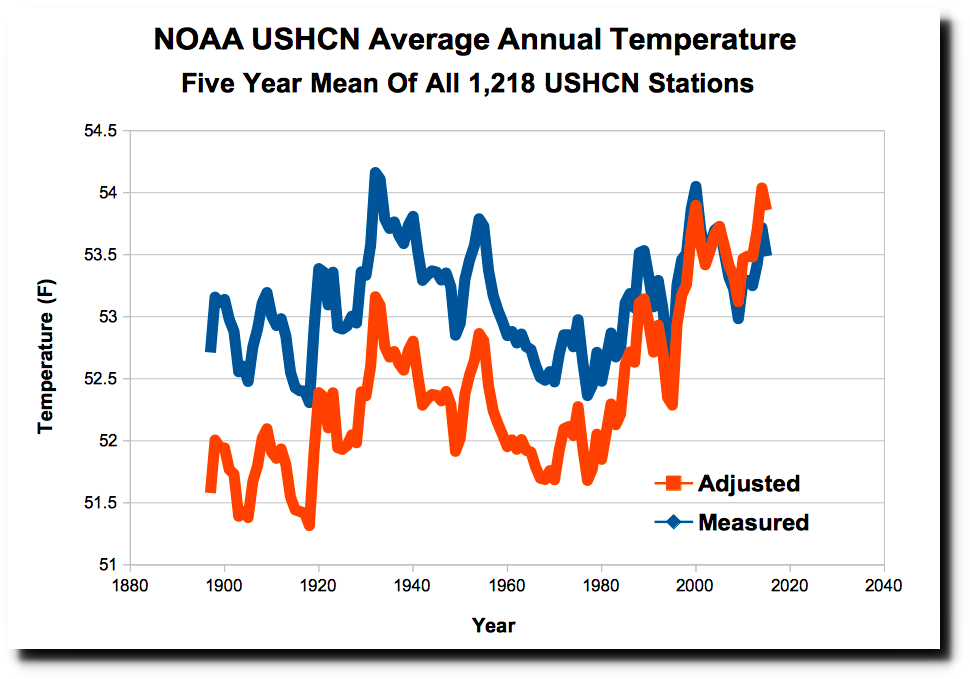
Tamino has acknowledged that my graphs are accurate, but says the data has to be tampered with because of changes in average station latitude. He also says we need to trust the experts.

USA Temperature: can I sucker you? | Open Mind

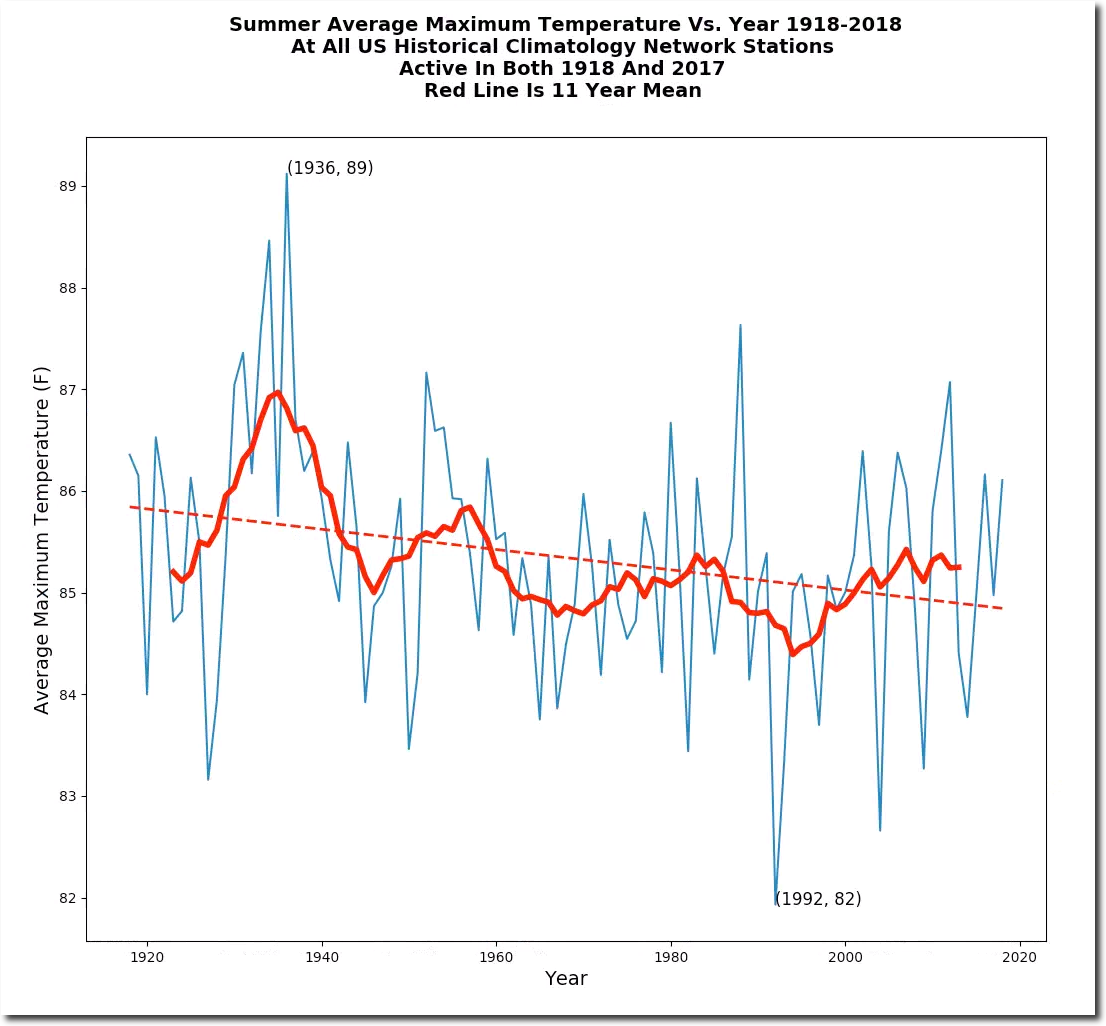
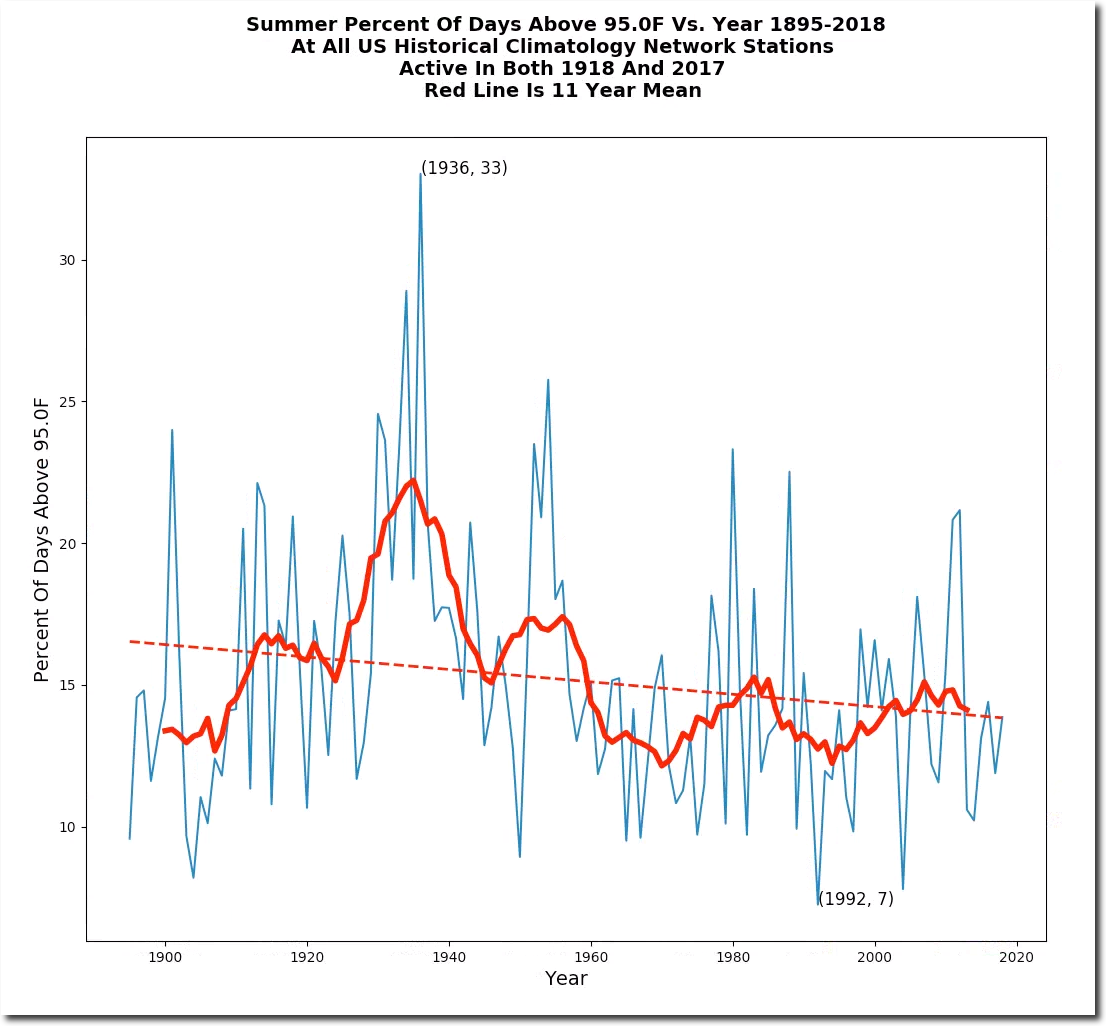
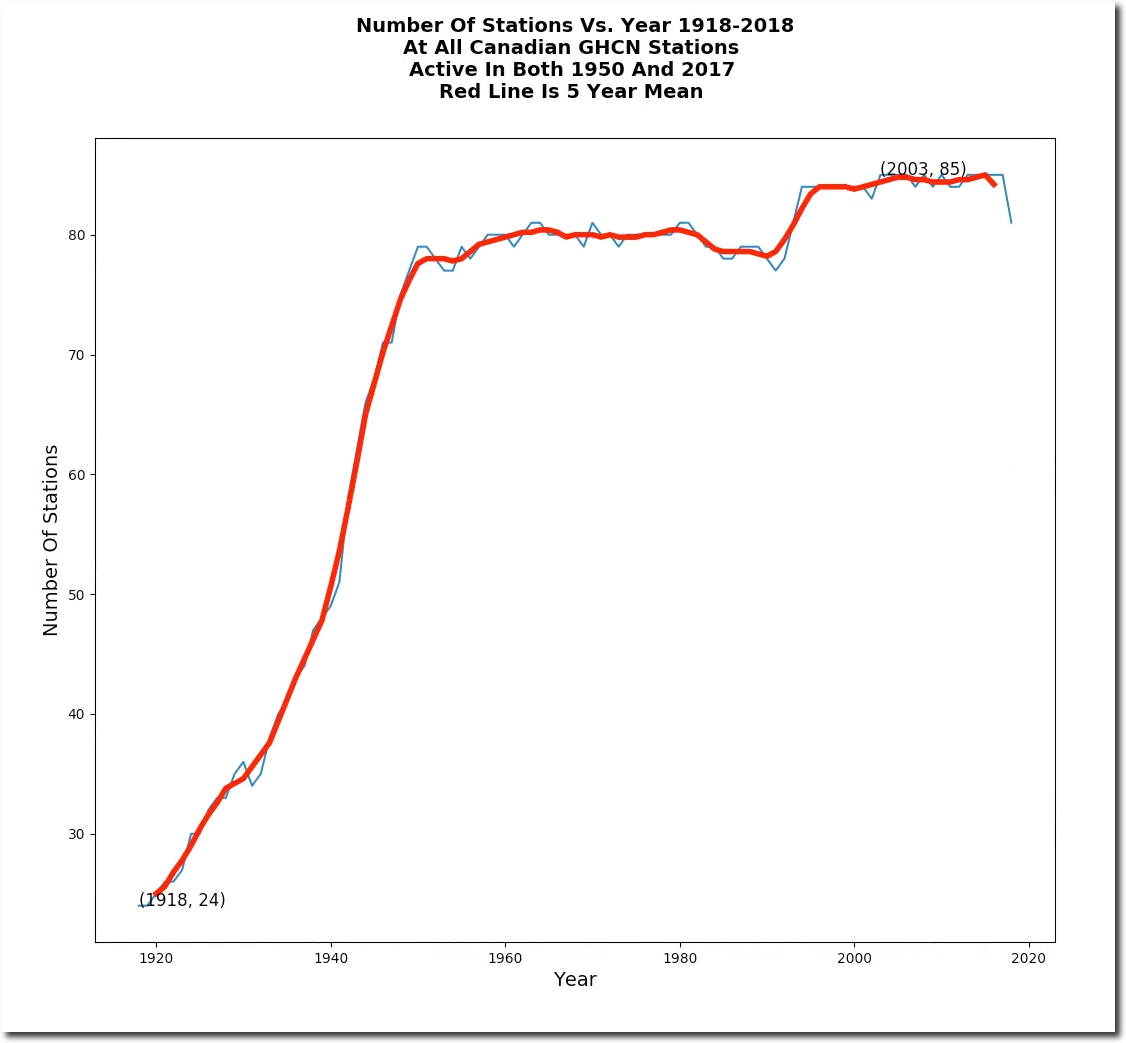
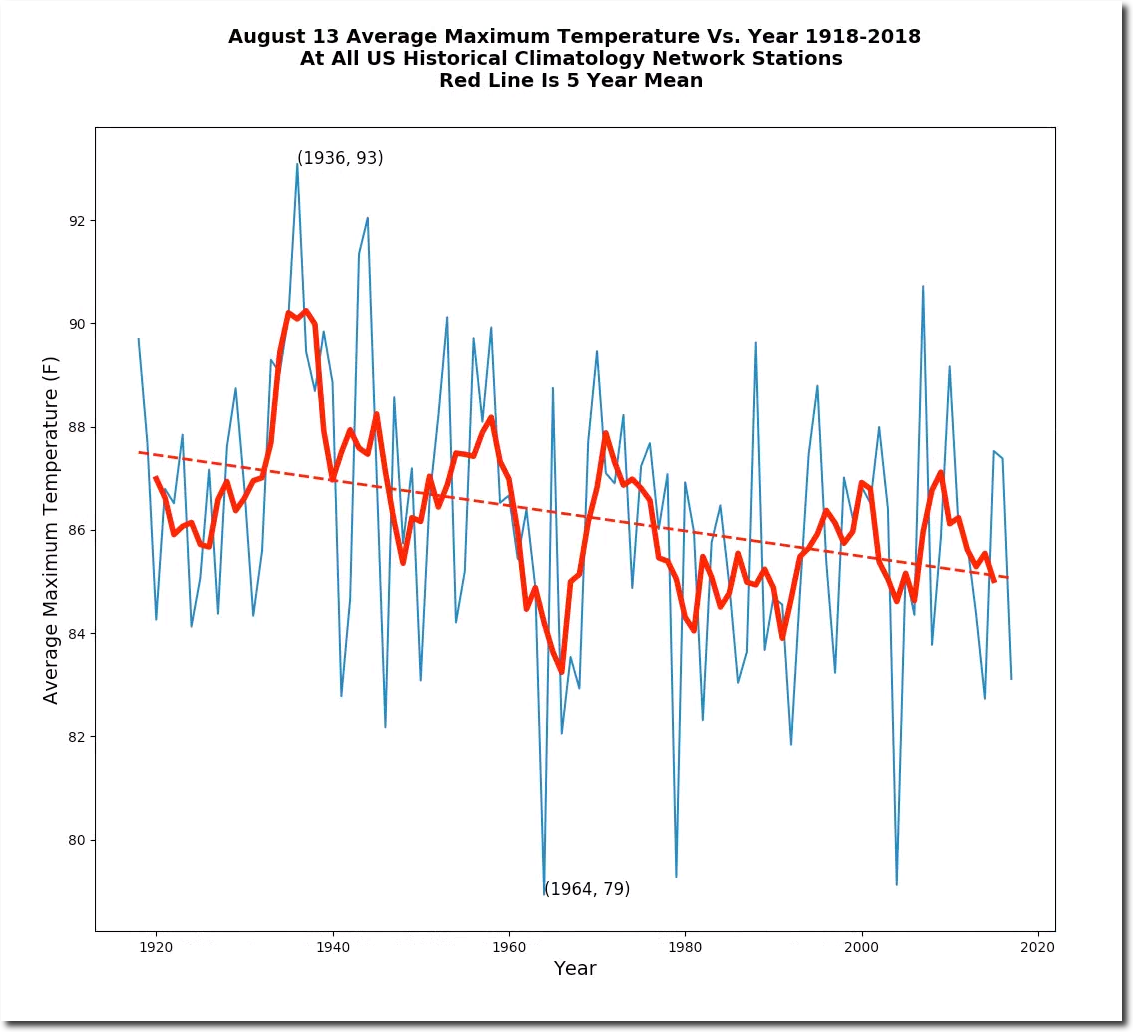
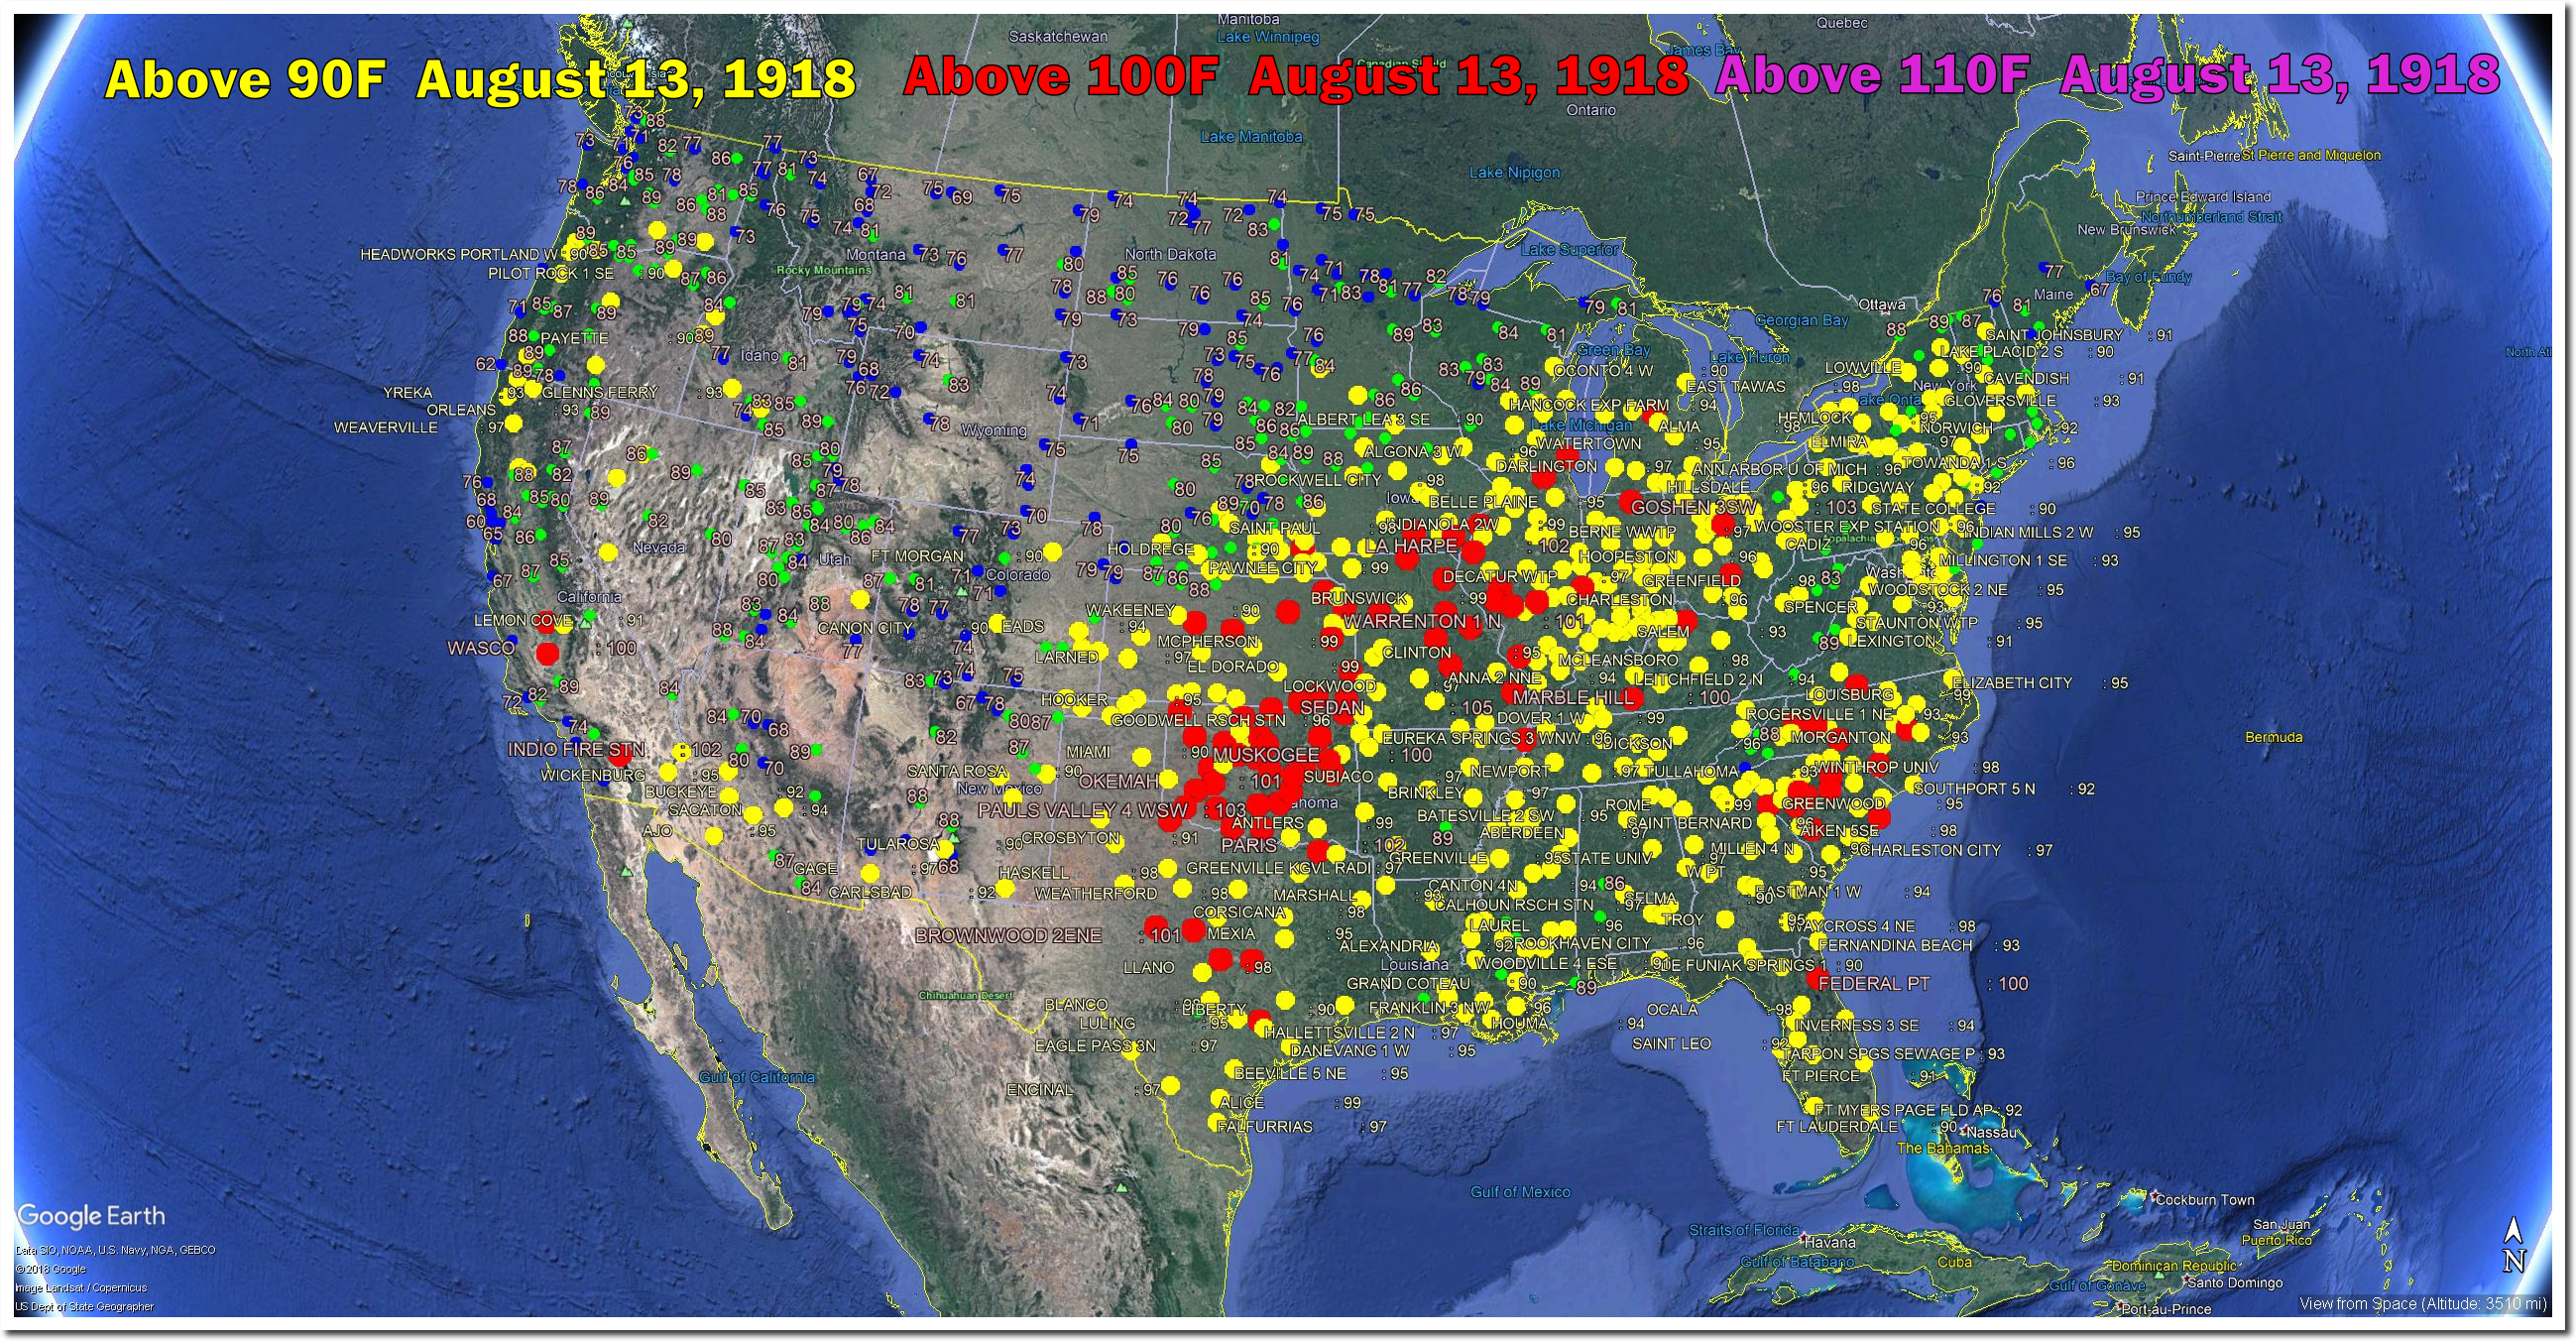
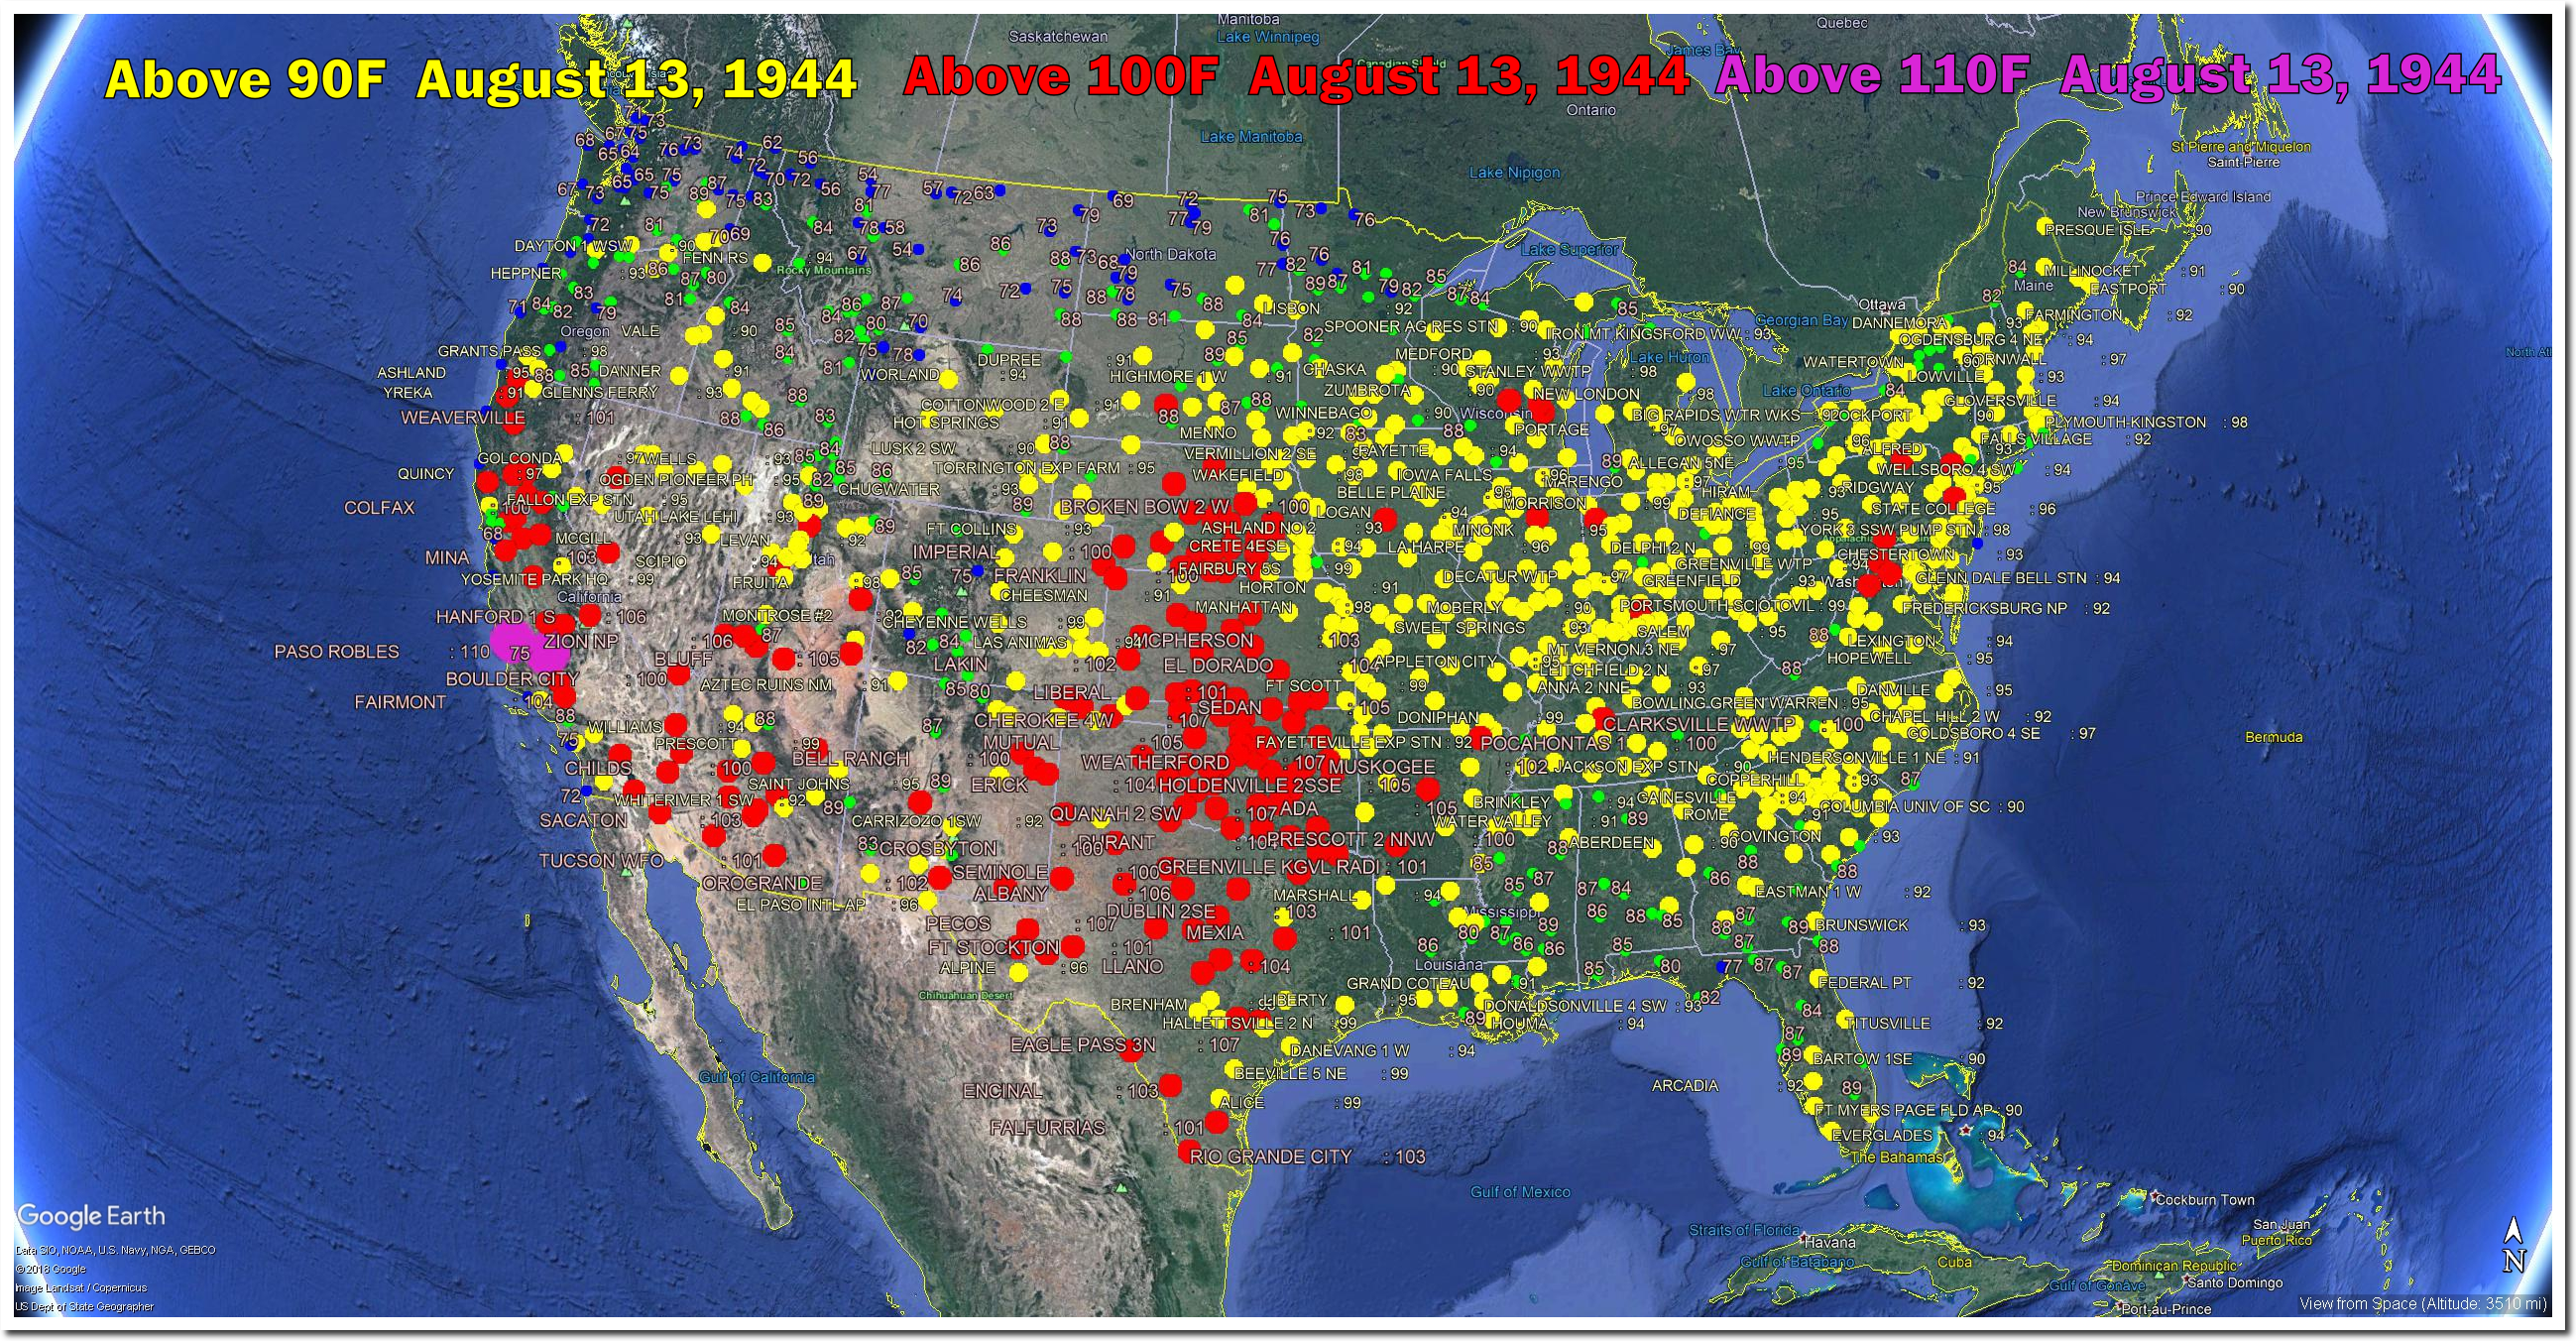
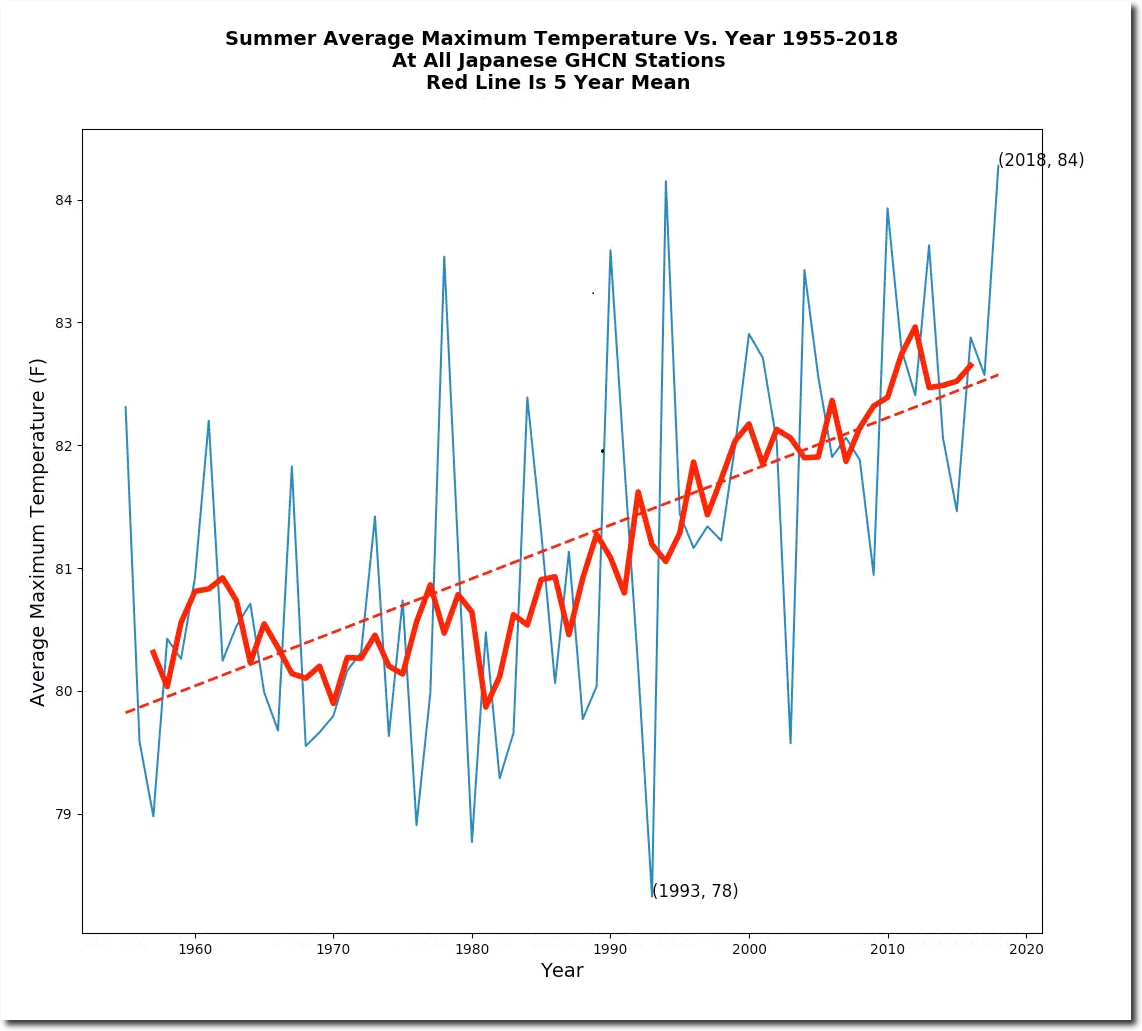
Rather than trusting the experts, let’s actually look to see if Tamino’s theories are correct. If we look at only the set of stations which were active in both 1918 and 2017, we see a nearly identical trend.

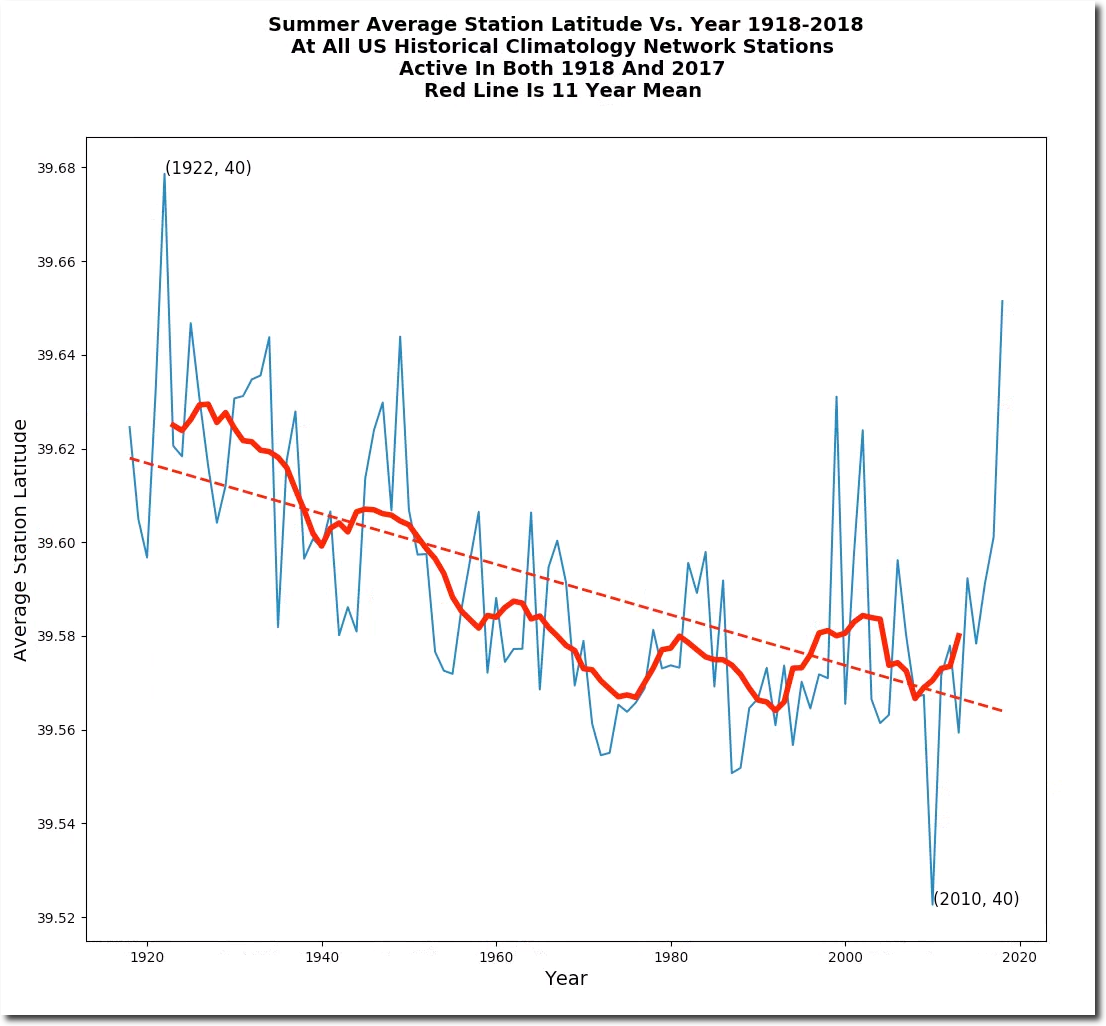
The average latitude of this set of 720 stations, has moved slightly closer to the equator, so it should produce an artificial warming trend and works against his theory. The average latitude changes, because not every station reports every day.

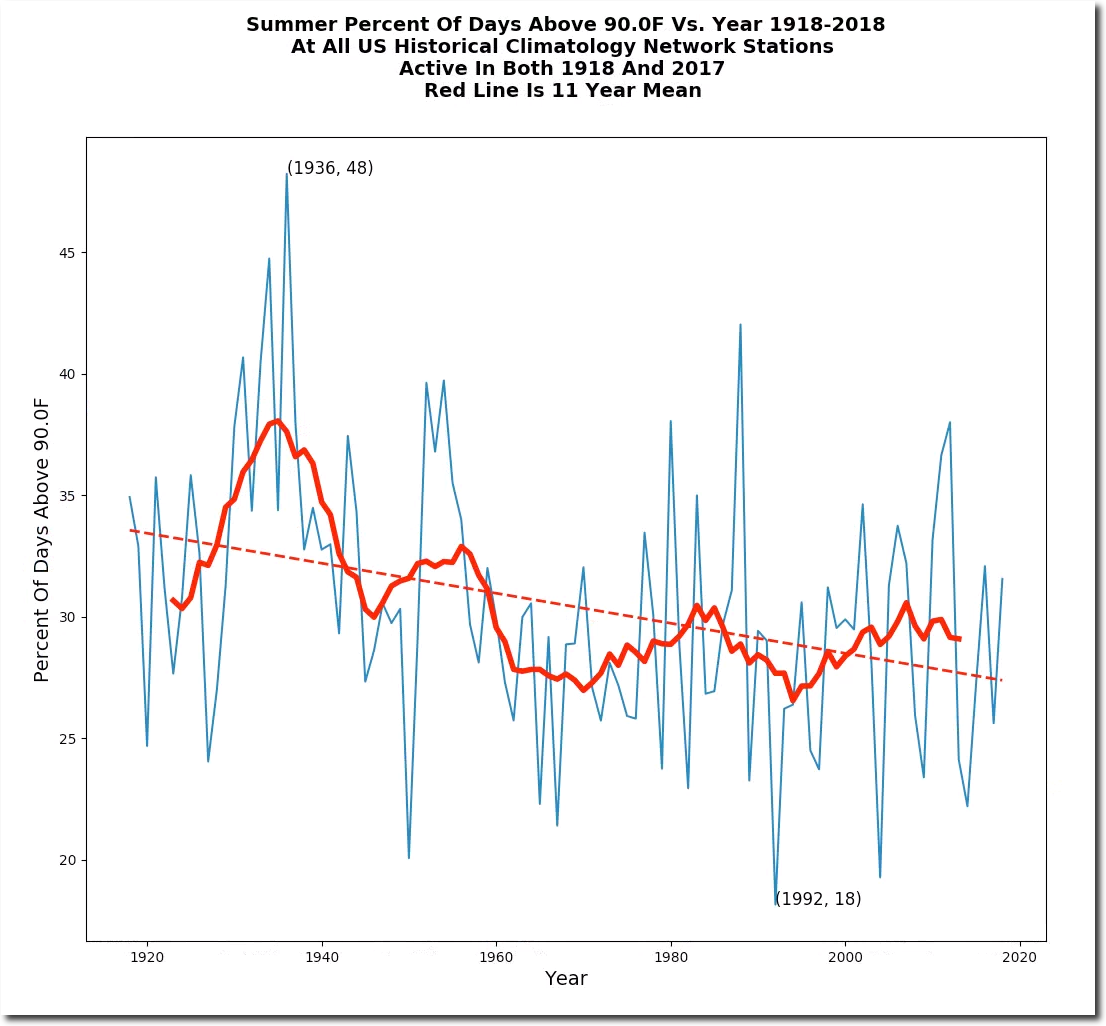
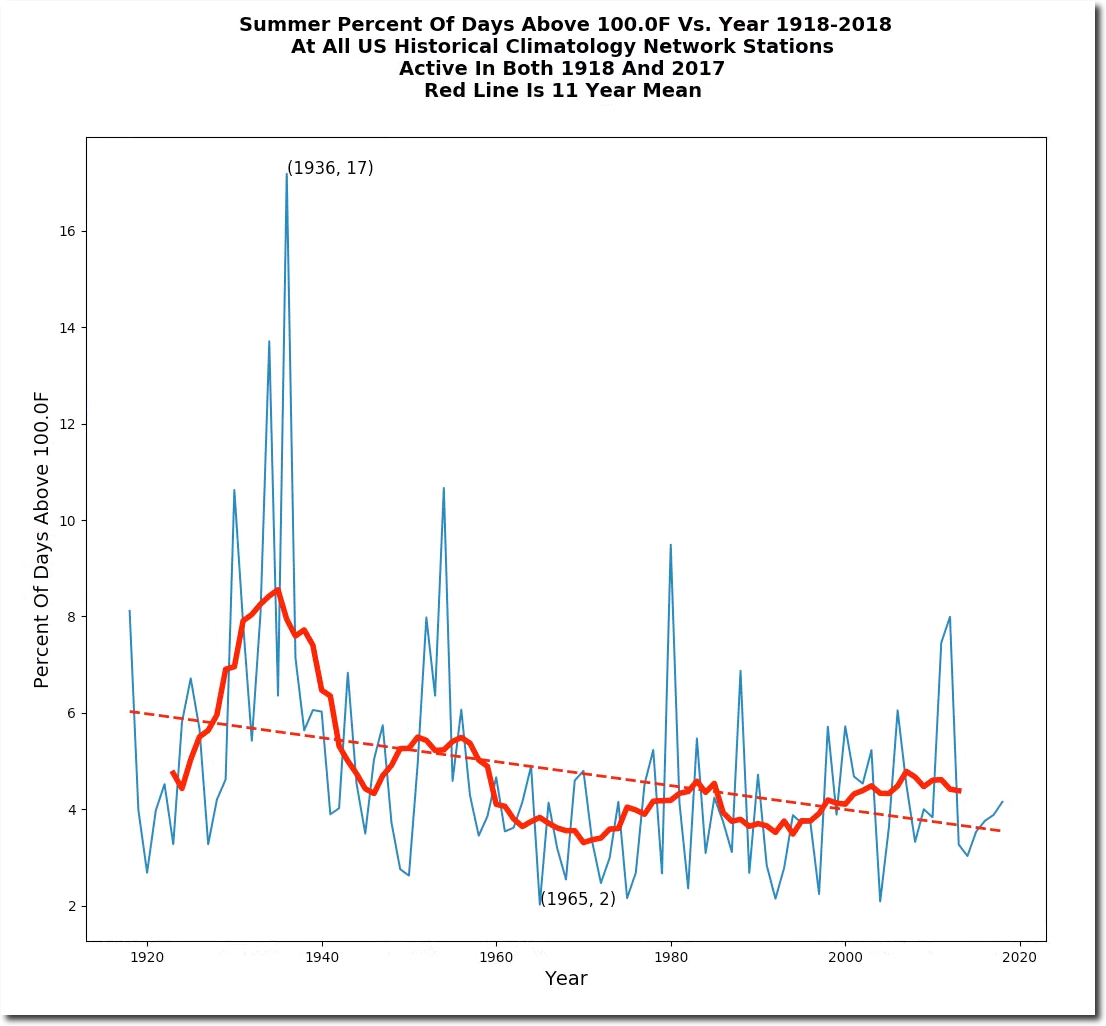
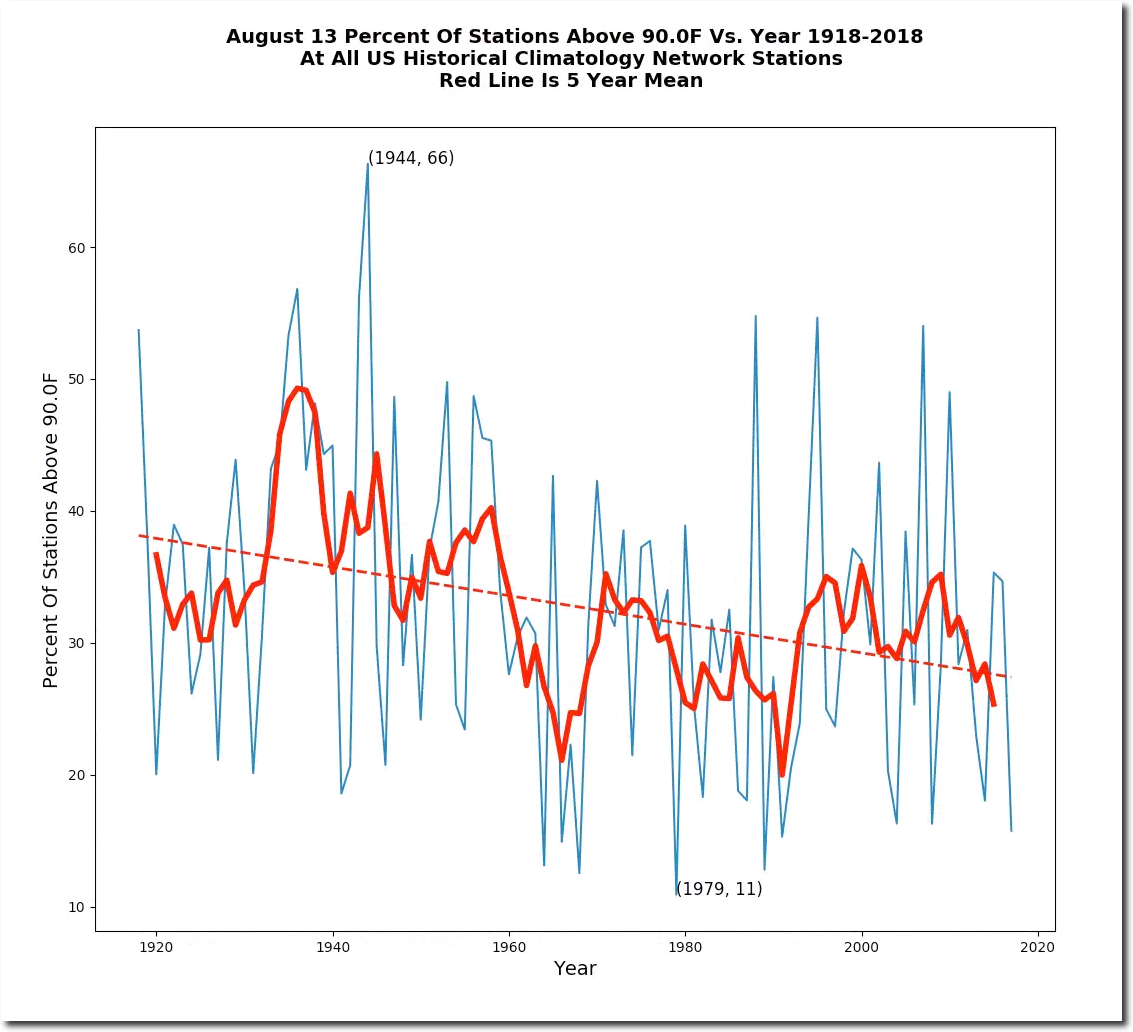
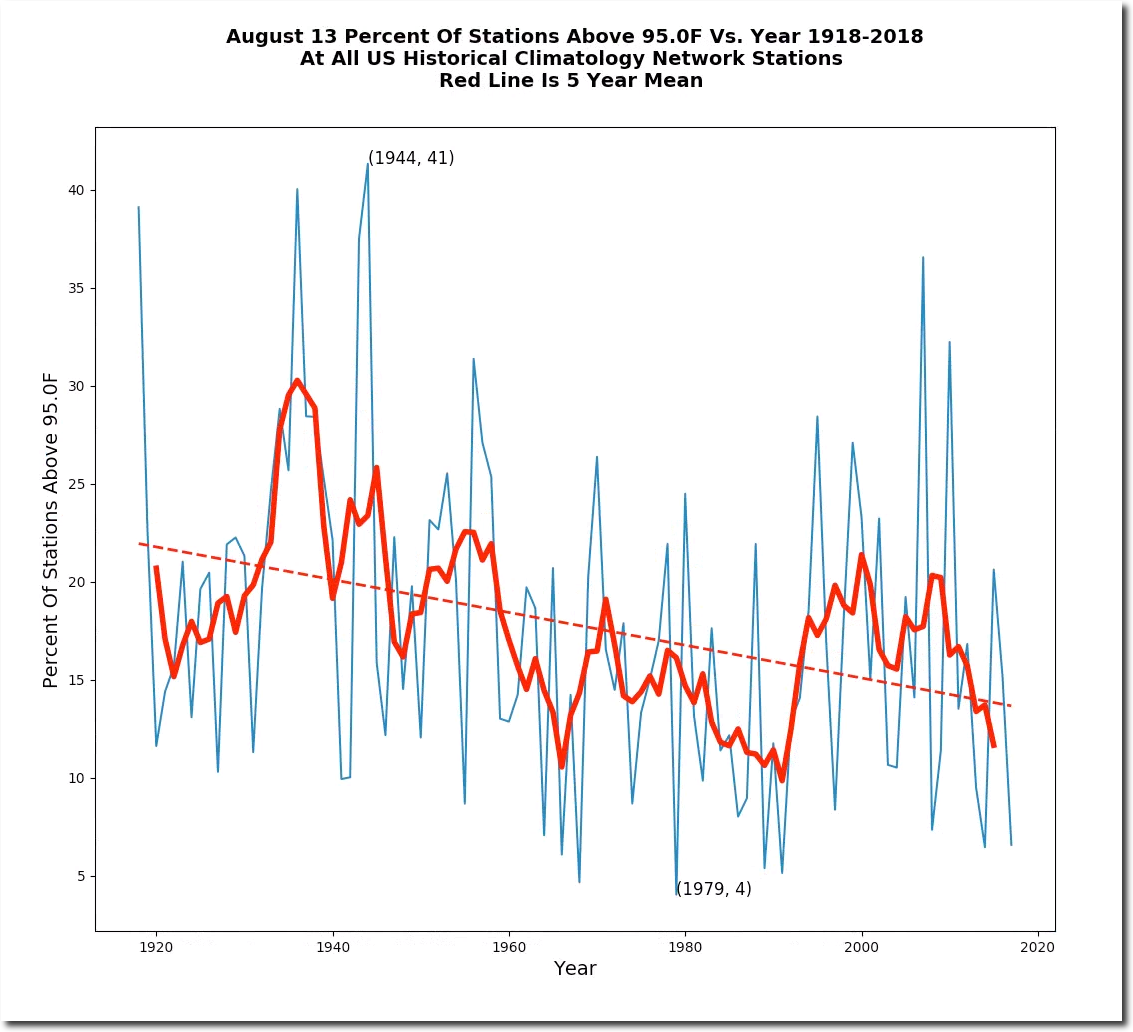
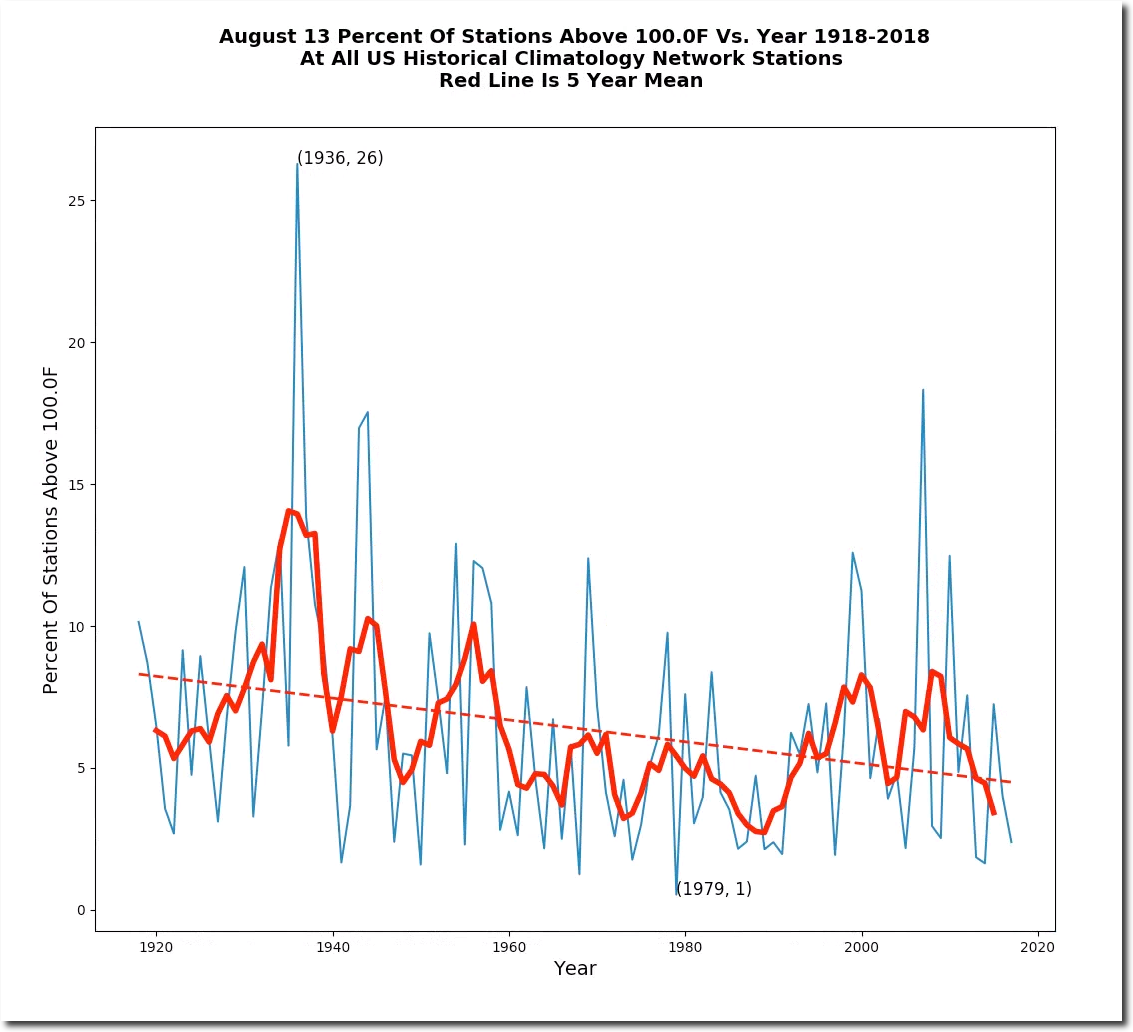
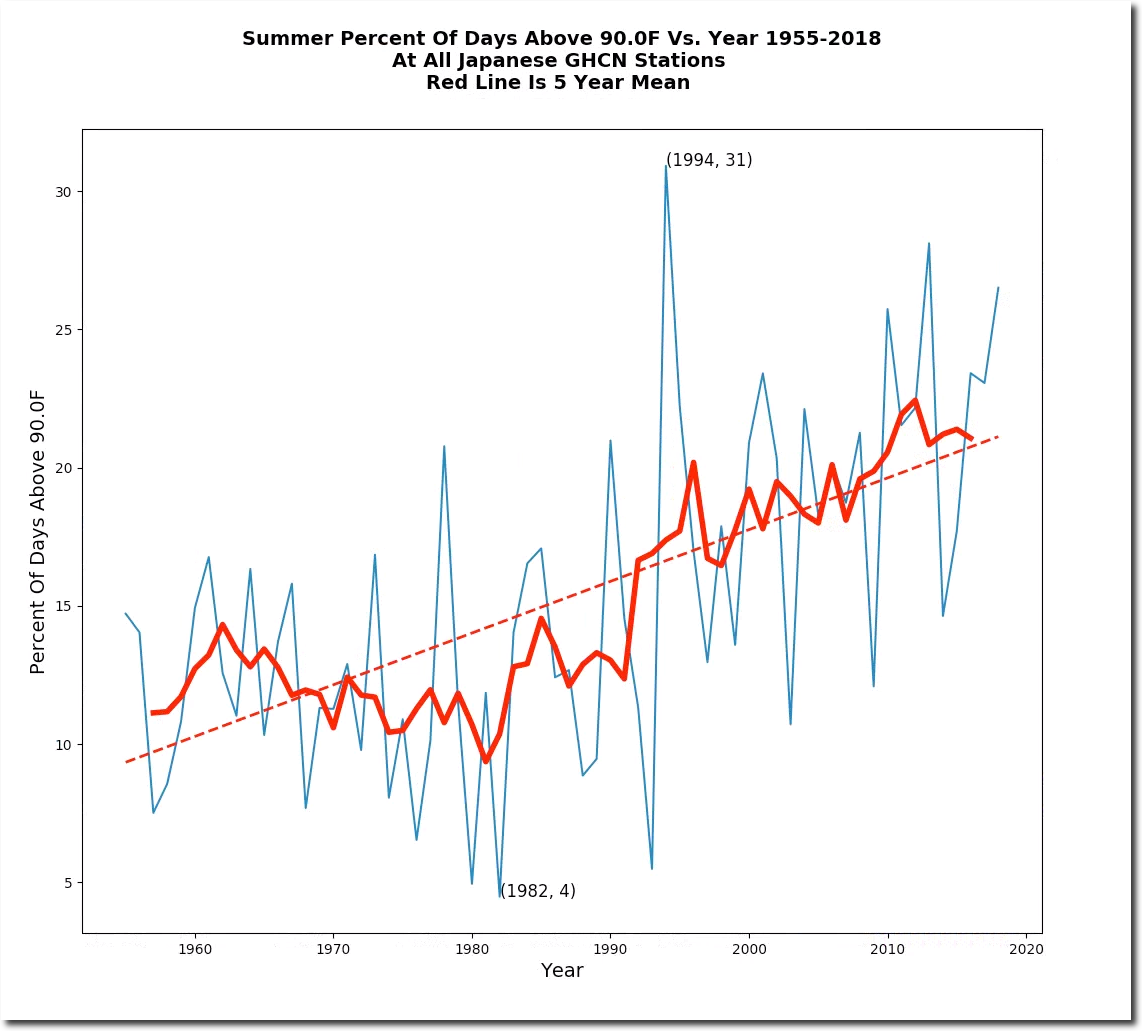
The percent of hot days at this stable set of stations has also declined.

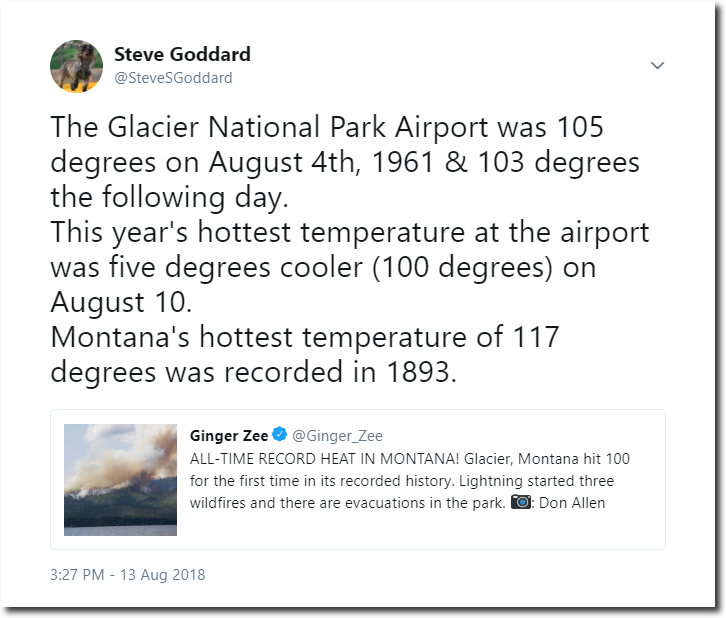
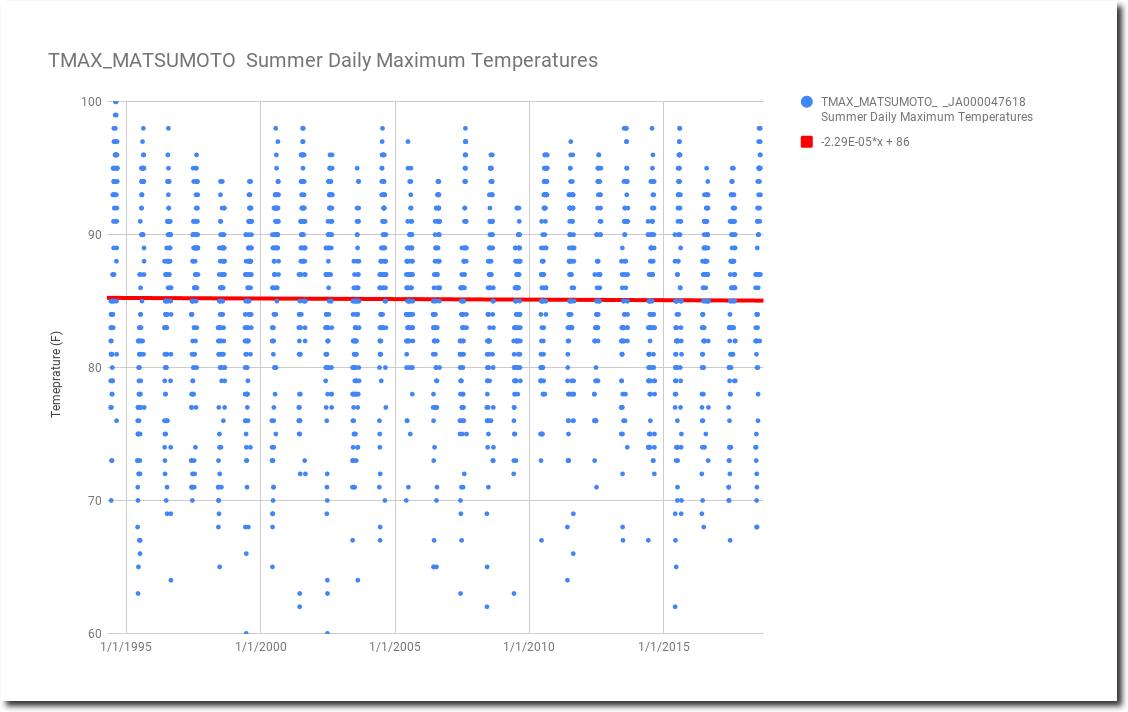
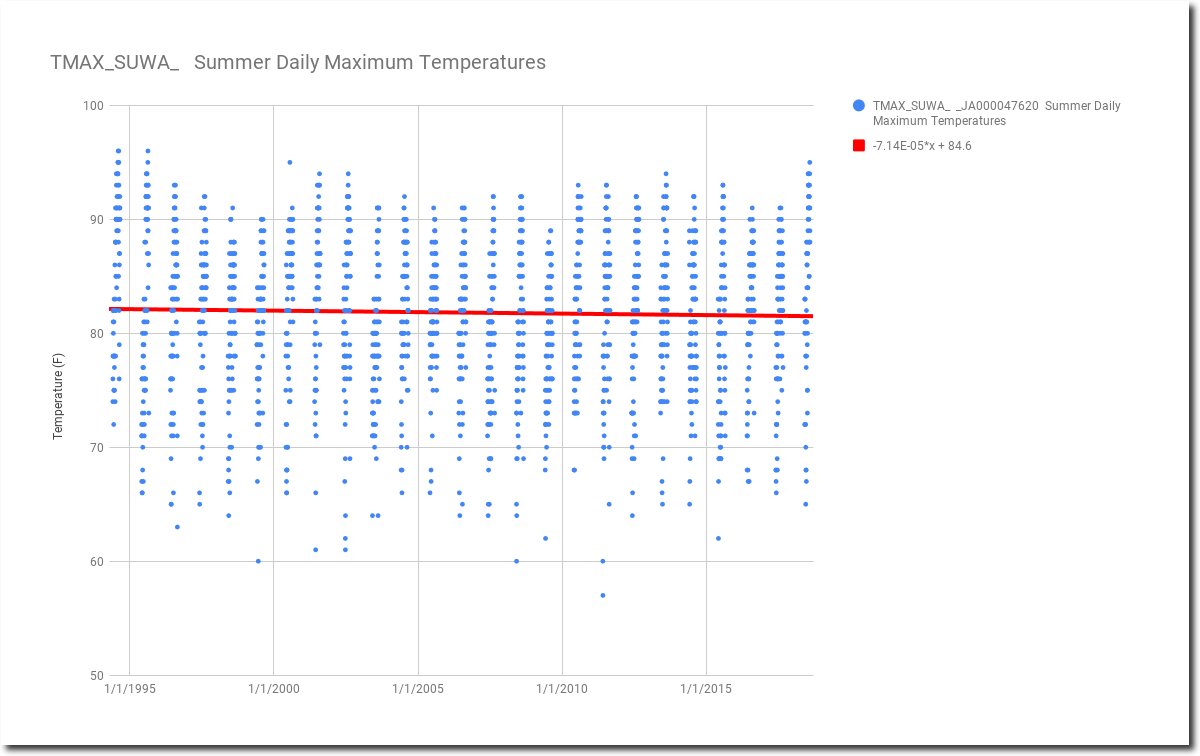
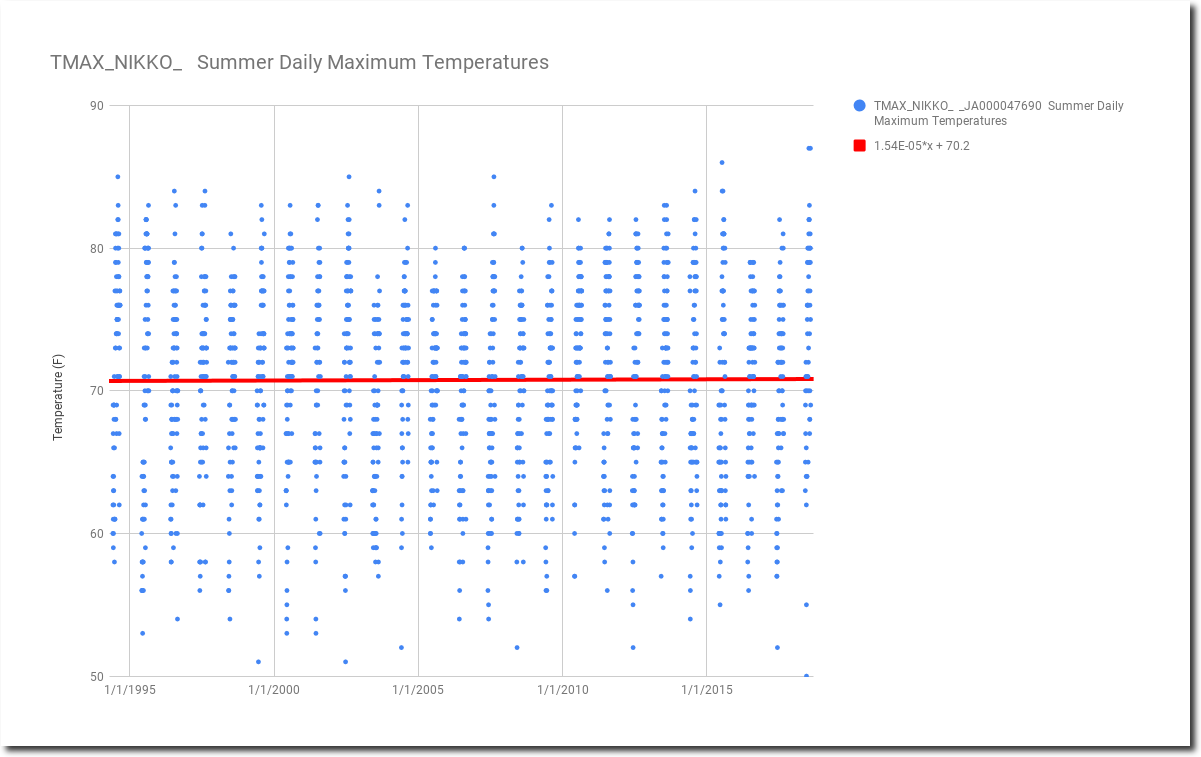
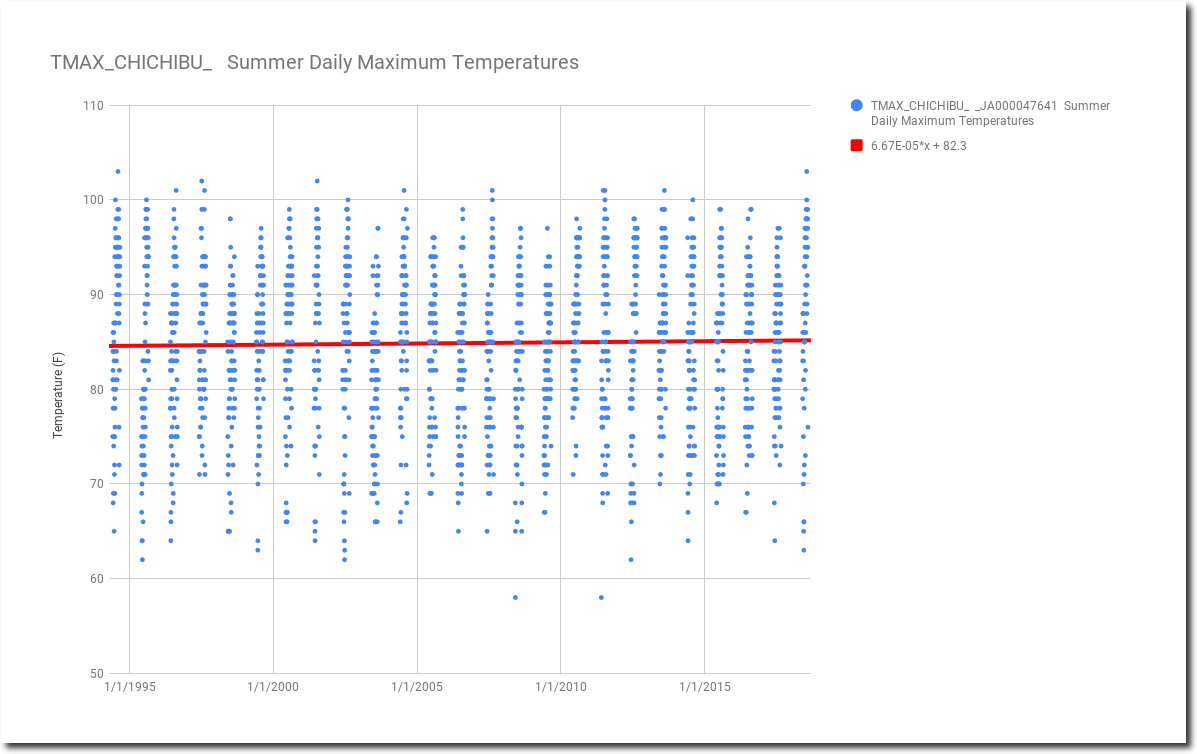
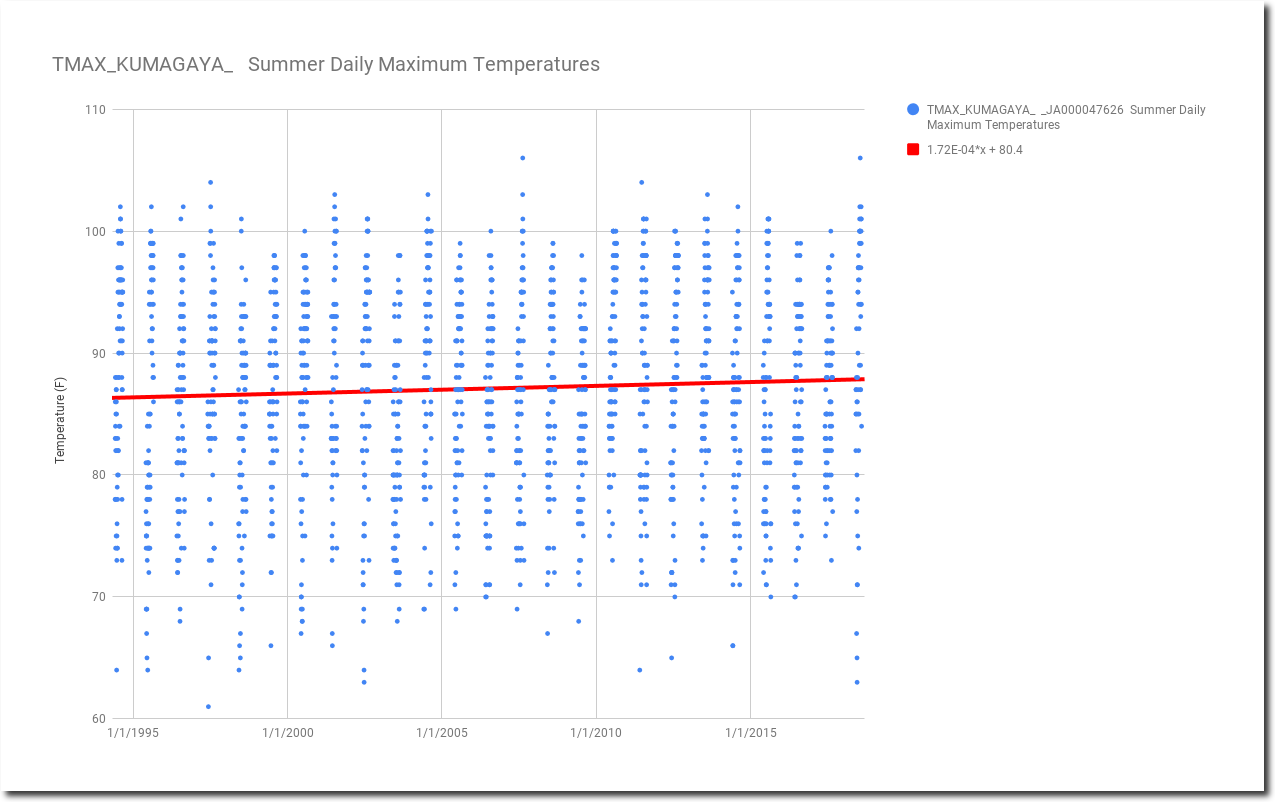
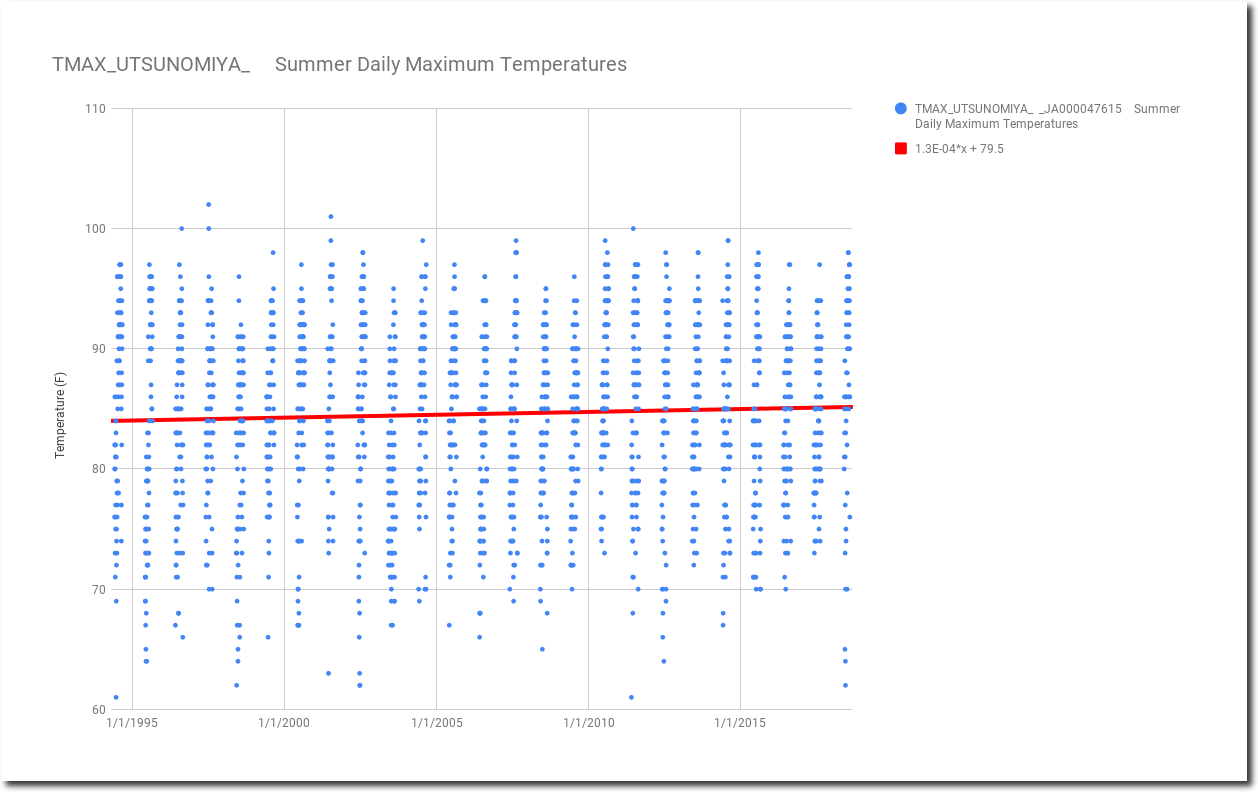
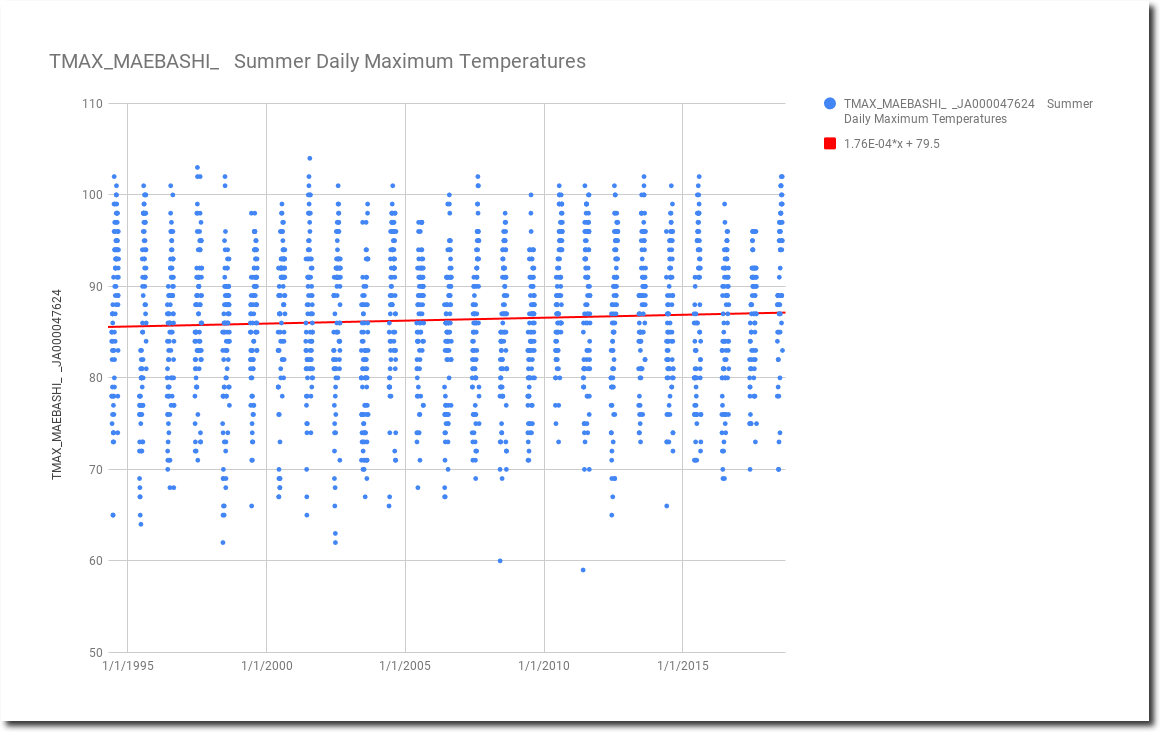
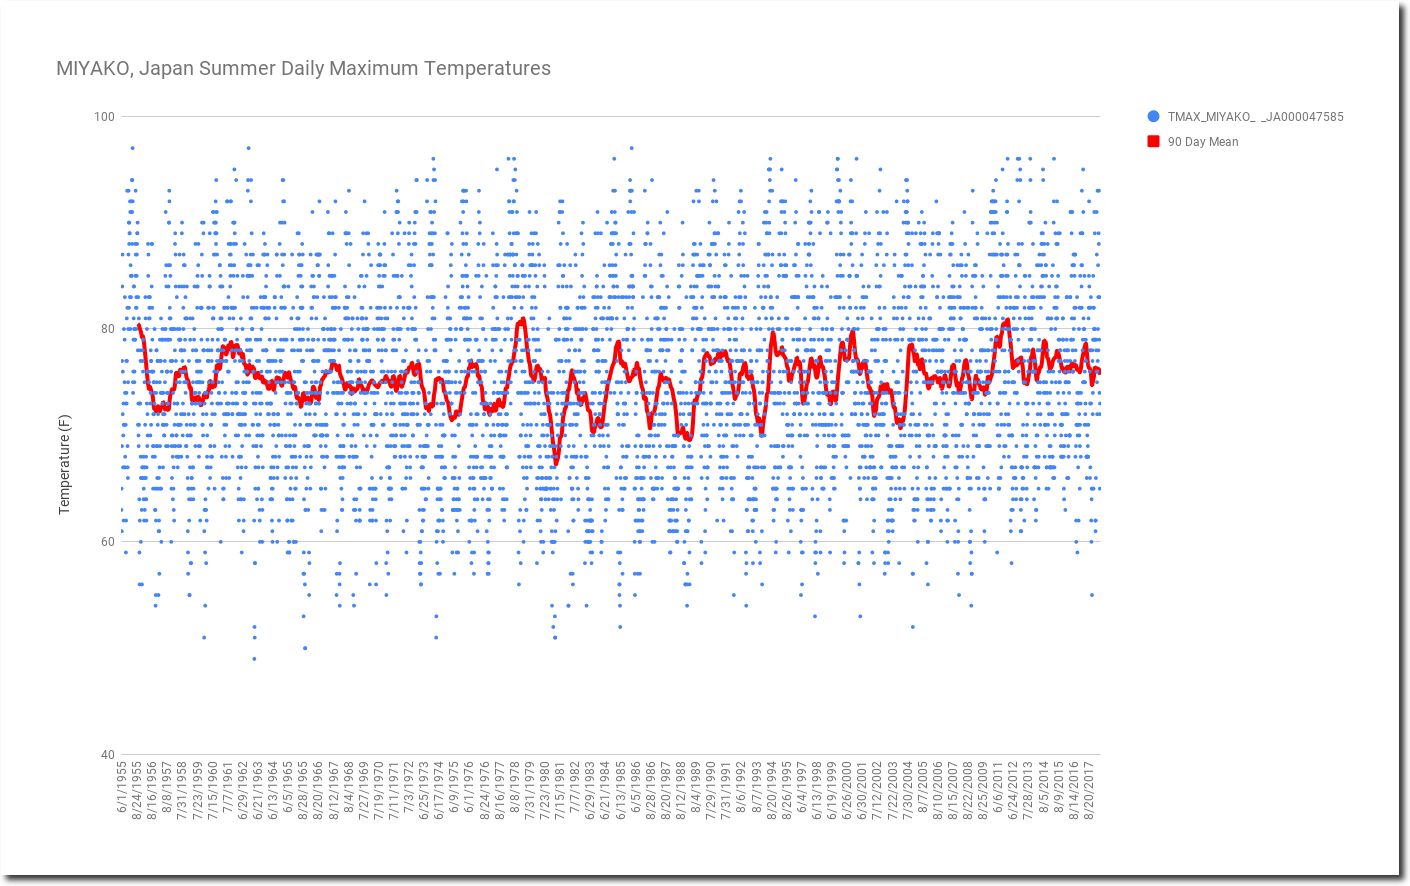
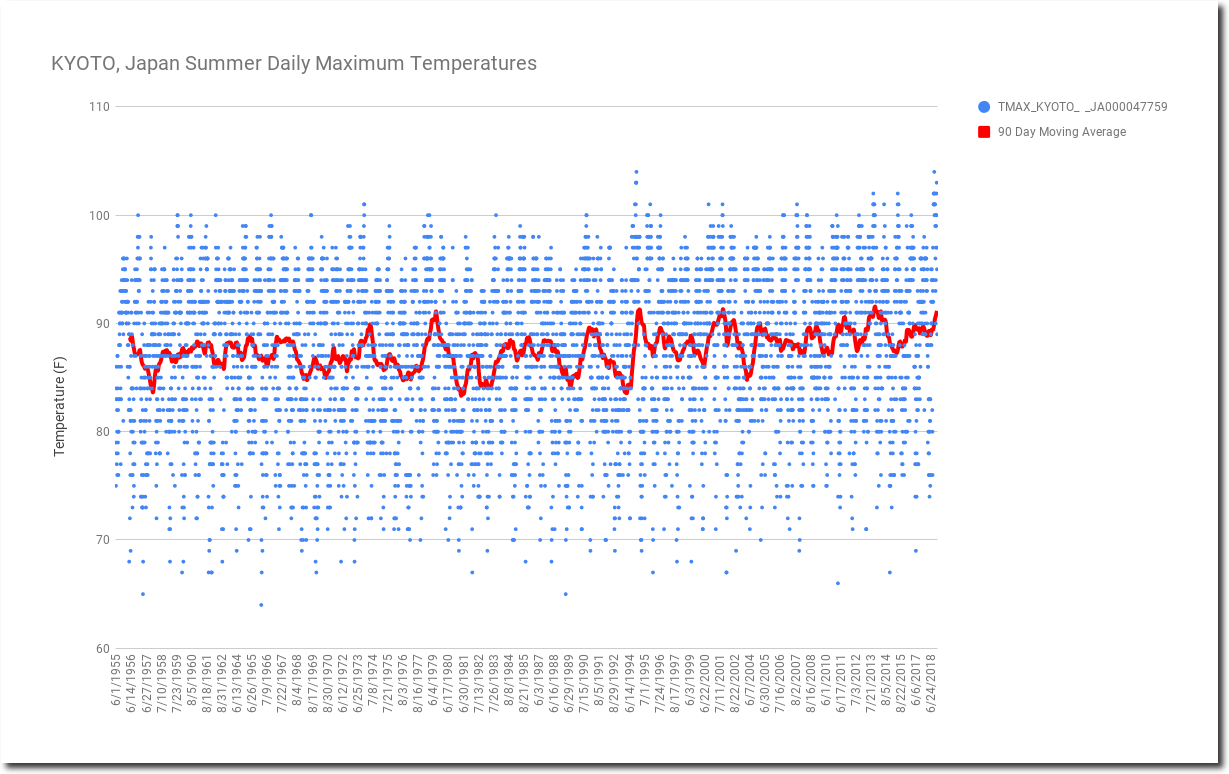
Tamino also complains that I should include warming which occurred before the last 100 years, even though it had nothing to do with CO2. That theory doesn’t hold up either, because summer afternoon temperatures have declined since the start of records in 1895.

A few years ago, Tamino made a blog post saying that I was lying about increasing winter snow cover. He continues to bat 0.000, but his readers continue to believe his BS.

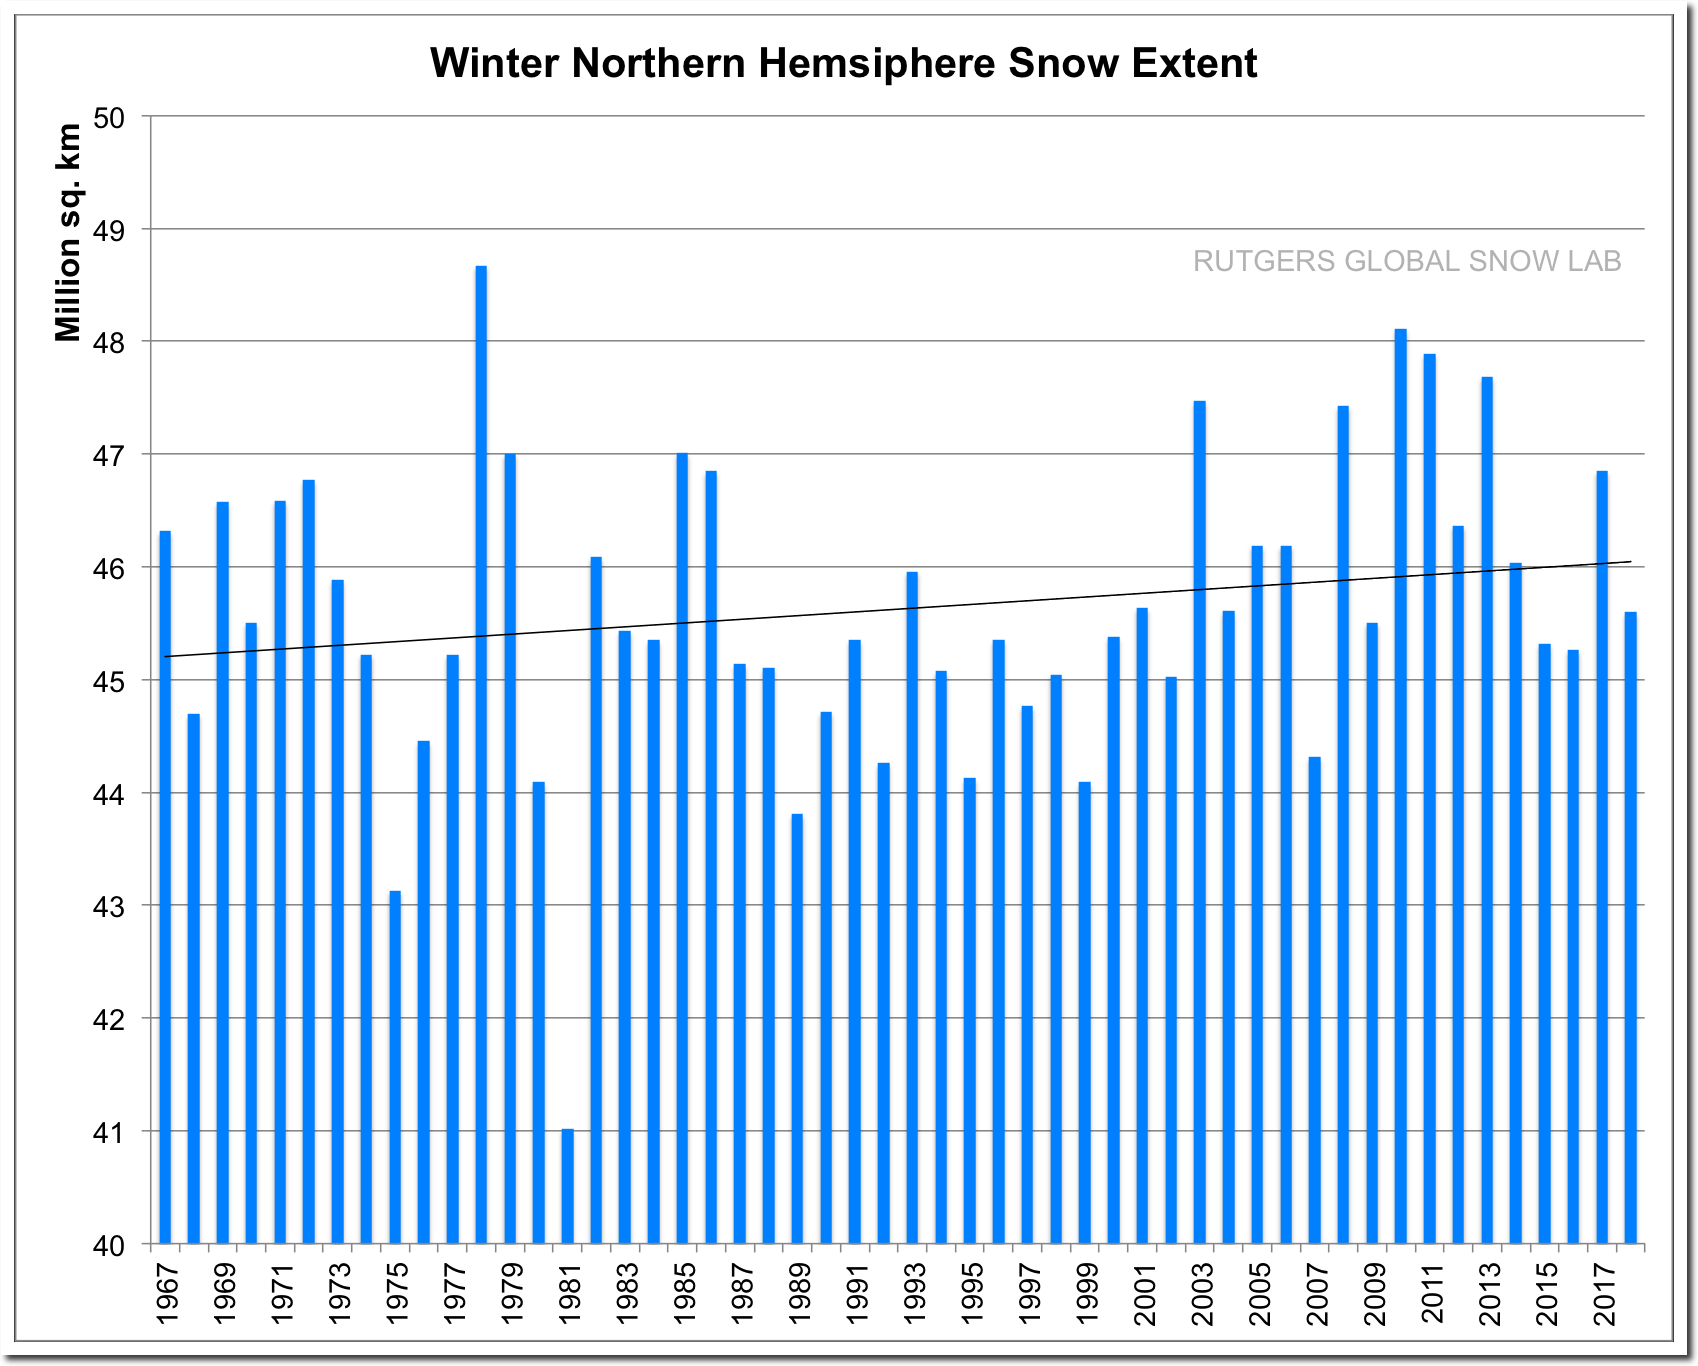
Rutgers University Climate Lab :: Global Snow Lab

Tamino is making progress however, admitting that my graphs are accurate representations of the data.  Data tampering by NOAA is junk science.

Let’s see if Tamino posts my response.

Posted in Uncategorized | Leave a comment

All Time Record Nonsense At ABC News

Posted in Uncategorized | Leave a comment

Ten Years Of Pulling Back The Curtain On Junk Science

Ten years ago this week, I wrote an article in The Register titled “Arctic ice refuses to melt as ordered.

Arctic ice refuses to melt as ordered • The Register

All of the world’s leading experts were predicting the North Pole or the entire Arctic would be ice-free between 2008 and 2018.

Serreze and Borenstein in 2008, ice-free North Pole.

28 Jun 2008, Page 8 – Southern Illinoisan

Hansen and Borenstein in 2008, ice-free Arctic.

The Argus-Press – Google News Archive Search

National Geographic has recently deleted this gem.

North Pole May Be Ice-Free for First Time This Summer

Ice-free Arctic in 2008.

Expert: Arctic polar cap may disappear this summer_English_Xinhua

Mark Serreze said the Arctic is screaming.

Star-News – Google News Archive Search

Ten years later, Serreze, Borenstein, Flannery and the New York Times are still pimping the exact same BS, and wondering why nobody is listening to them.

Will we see an ice-free North Pole in 2018?

On the phone with Serreze, the veteran journalist Seth Borenstein lamented, “How many times can a journalist report on what is happening in the Arctic before it becomes so repetitive that people lose interest?”

The Big Melt | by Tim Flannery | The New York Review of Books

The area of the Arctic covered with thick sea ice has expanded vastly since I wrote my article ten years ago, and sea ice volume is fourth highest for the date since 2003.

2008        2018

Spreadsheet    Data

I was correct ten years ago, and all the experts were wrong. So Google and YouTube accuse me of spreading misinformation, while they promote the people who spread the same nonsense year after year after year.

But that is what fake news is all about.

Ages-Old Icecap at North Pole Is Now Liquid, Scientists Find – The New York Times

Posted in Uncategorized | 1 Comment

The Japanese Urban Heat Island

Japan is a small country with a very high population density, dominated by large cities like Tokyo.

Most of the GHCN stations there are urban, and show a strong summer warming trend since the 1950’s.

There was a large jump in summer temperatures at the very hot summer of 1994.

I did some analysis of this trend, and noticed that stations away from Tokyo tend to show little of no summer warming since 1994, but stations in and near Tokyo show a lot of warming.

Away from Tokyo, cooling or little warming.


Tokyo – warming.


It looks to me like all of the summer warming in Japan since at least 1994 is due to urban heat island effects – as the population grows, the number of cars grow, the use of air conditioning grows, the amount of asphalt grows, etc.  This is quite likely the same problem with many other countries.

The only large temperature record I trust is the US, and that one is massively tampered with to comply with the global warming scam.

Raw NOAA Data      Adjusted NOAA Data

Posted in Uncategorized | Leave a comment

Little Change In Arctic Ice Extent Since Yesterday

NSIDC shows almost no change in Arctic sea ice extent since yesterday.

Index of /DATASETS/NOAA/G02135/north/daily/images/2018/08_Aug/

My current projection for an ice-free Arctic is October 24, at 1:02 PM.

Spreadsheet    Data

Posted in Uncategorized | Leave a comment

Japanese Stations

I’ve been looking at Japanese thermometers on Google Earth, and the vast majority of them are located in catastrophically bad locations on or near asphalt in the middle of large urban areas. One exception is at Miyako, about 300 miles north of Tokyo.  They show very little if any summer warming.

Compare vs. Kyoto, where the station is located in the middle of an urban jungle, and temperatures are warming.

Posted in Uncategorized | Leave a comment