
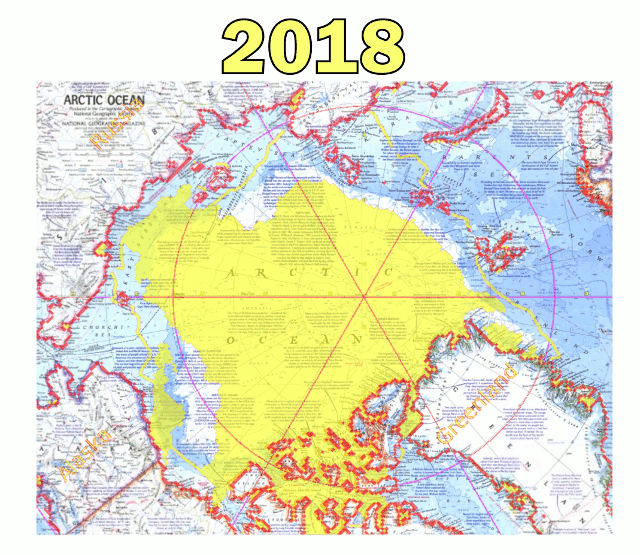
National Geographic published this map in 1971, showing the extent of Arctic sea ice at the end of summer.
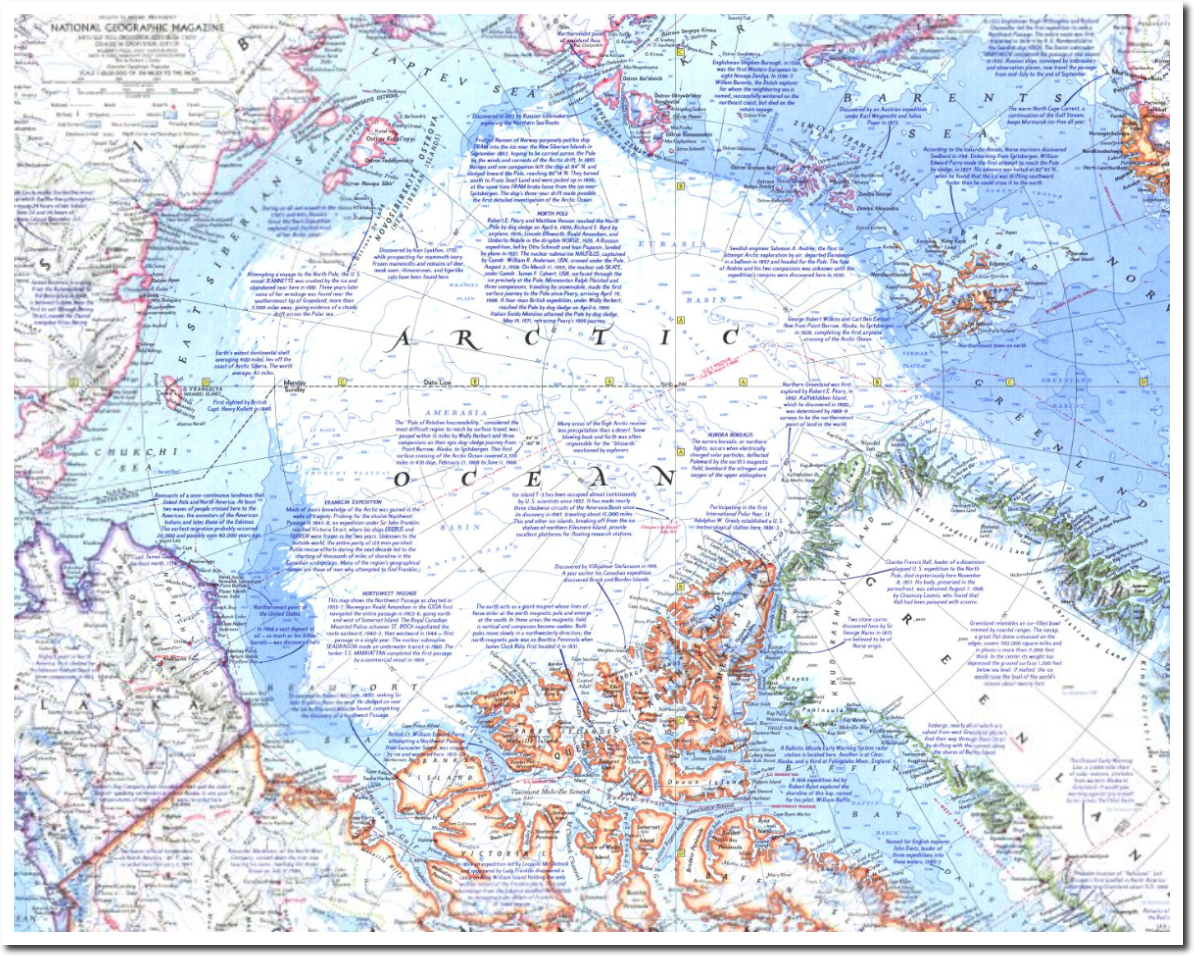
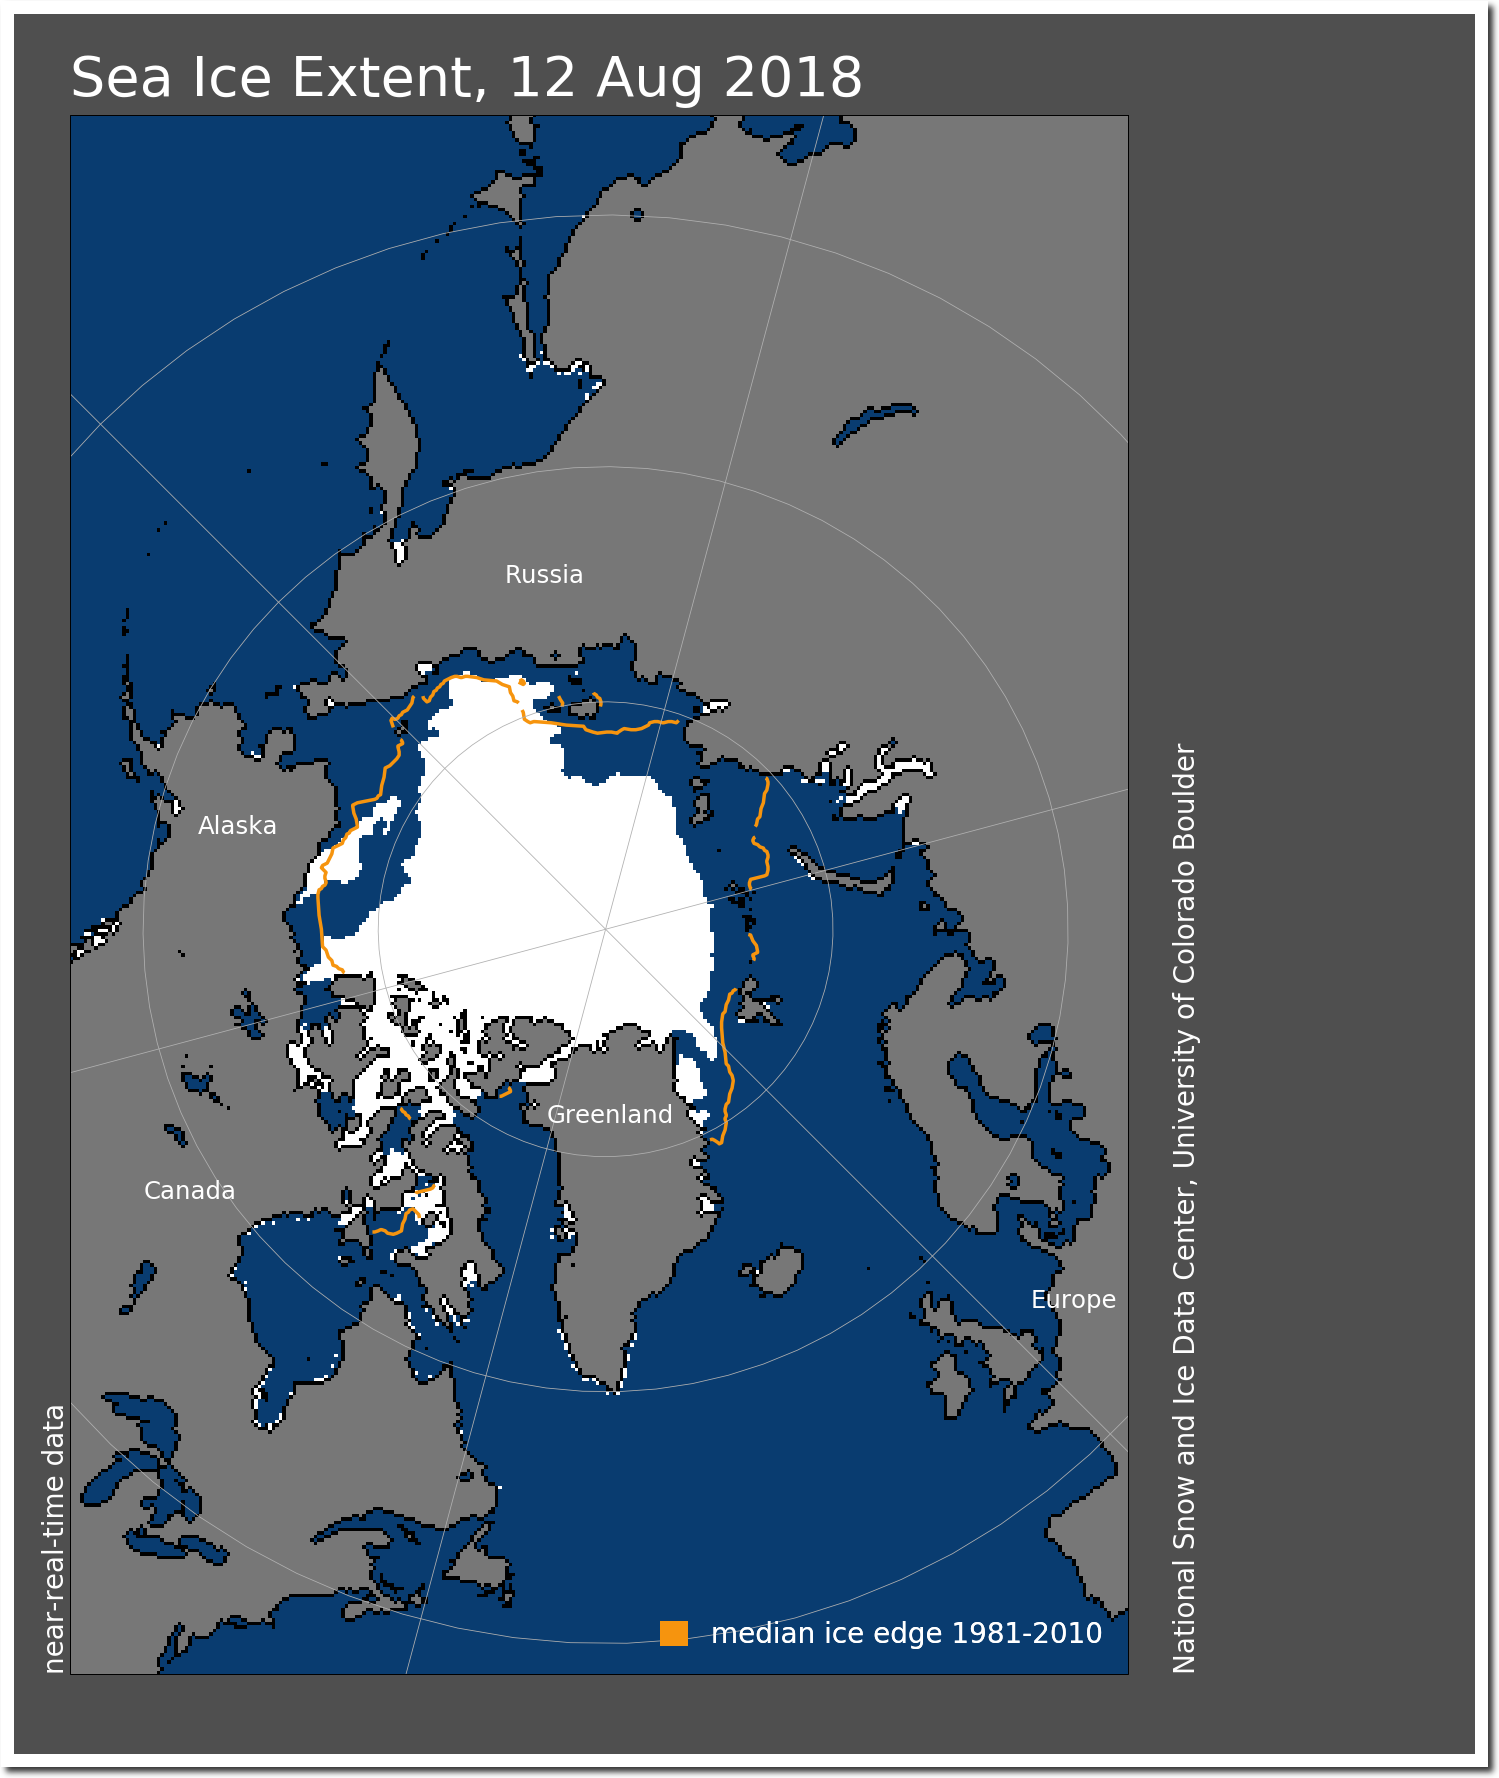
We are nearing the end of summer, and the ice in some regions is more extensive now than it was in 1971.
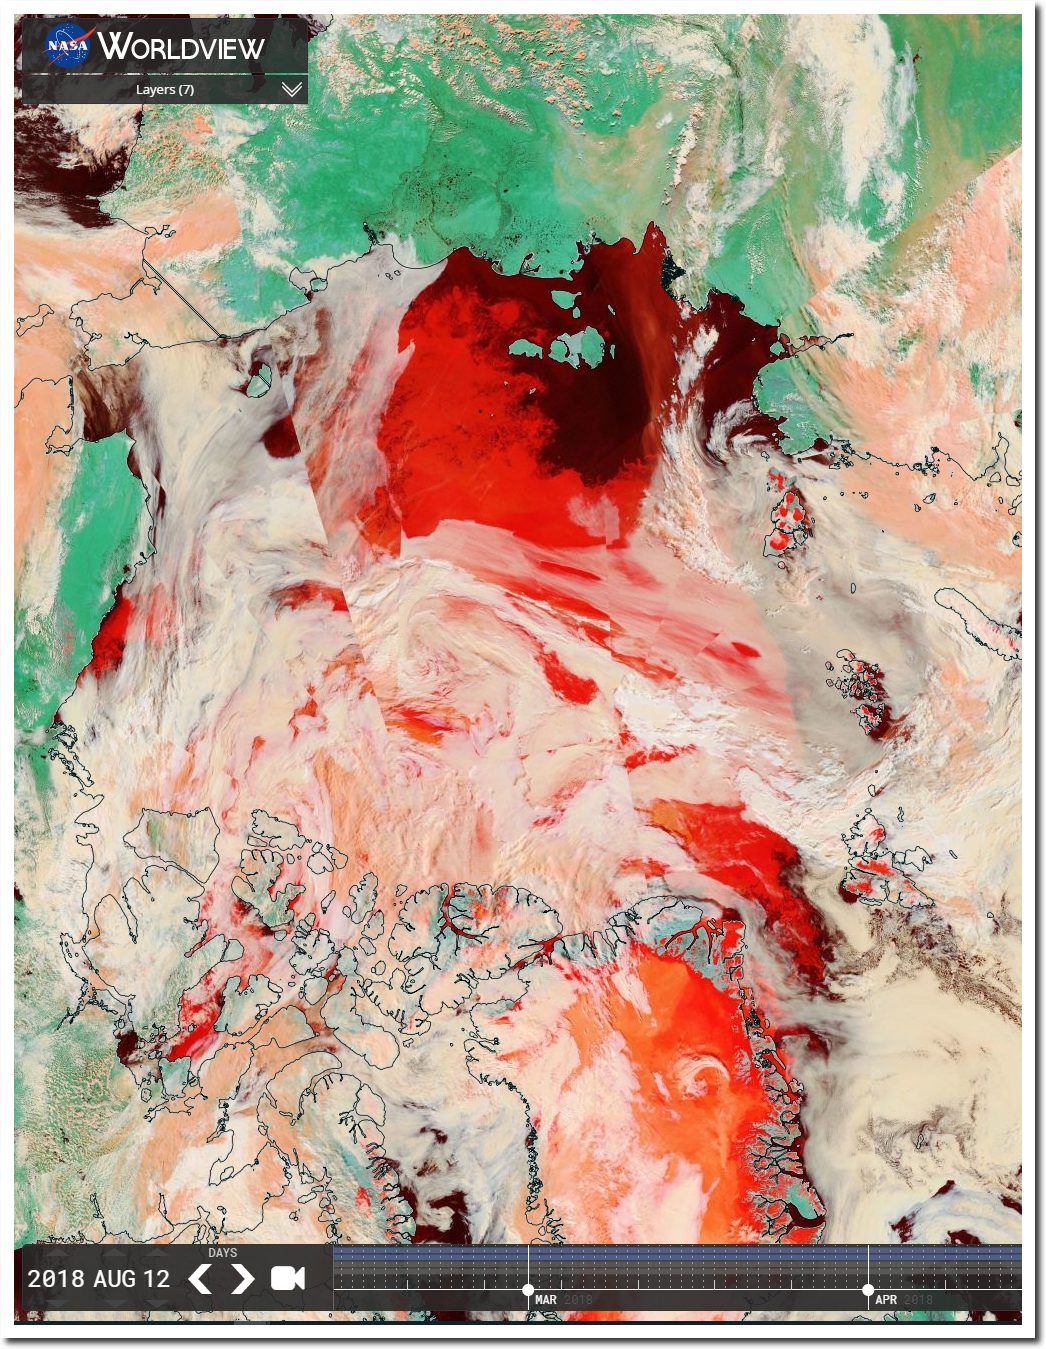
N_20180812_extn_hires_v3.0.png (1461×1740)
Arctic sea ice volume is fourth highest since 2003, and melting very slowly.

This is why NOAA hides the pre-1979 sea ice data. It wrecks their Arctic melting scam.
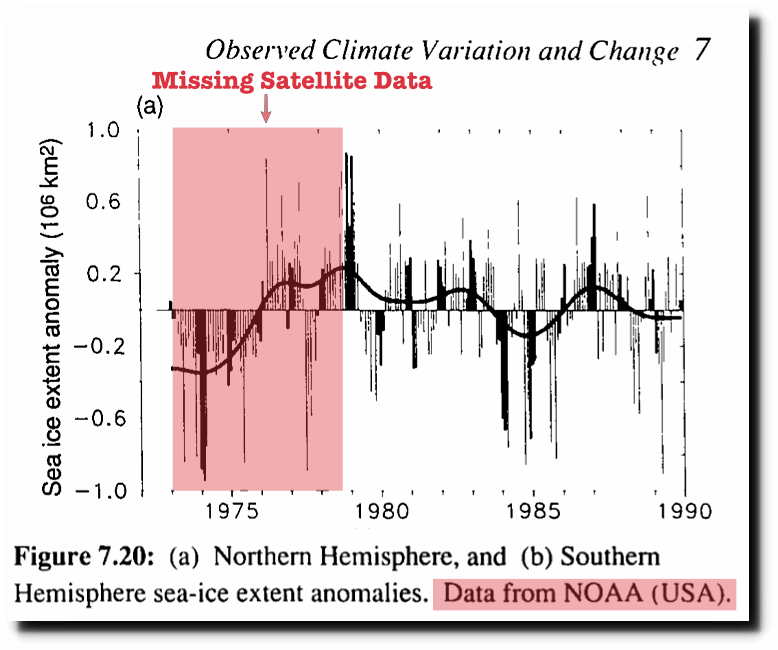
NOAA wants you to believe that time began in 1979, the peak year for Arctic cold and Arctic ice.
ftp://ftp.oar.noaa.gov/arctic/documents/ArcticReportCard_full_report2016.pdf
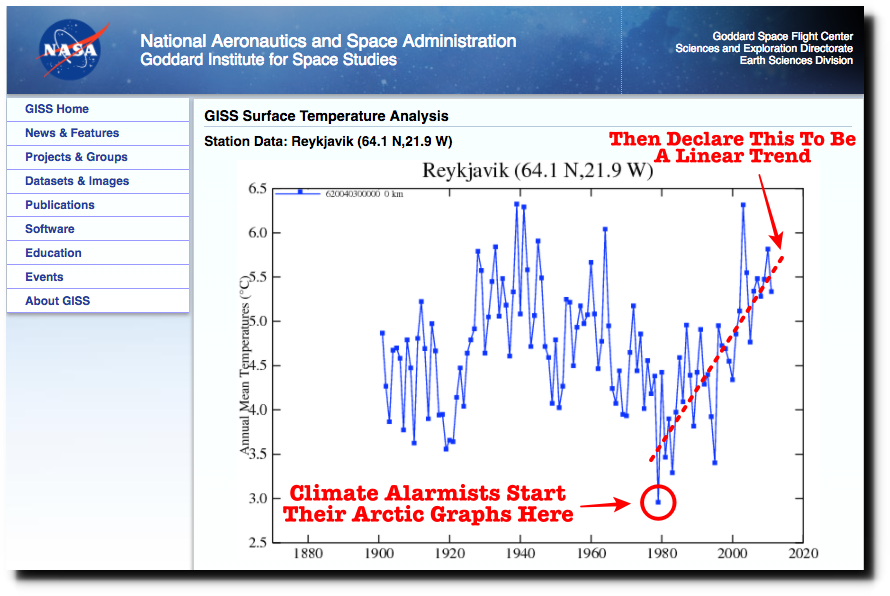
The graph below explains how climate alarmists do their junk science.
