
Does anyone believe this won’t eventually lead back to Barack Obama?

Born in Kenya and raised in Indonesia and Hawaii’

Does anyone believe this won’t eventually lead back to Barack Obama?
Born in Kenya and raised in Indonesia and Hawaii’
“Who controls the past controls the future. Who controls the present controls the past.”
? George Orwell, 1984
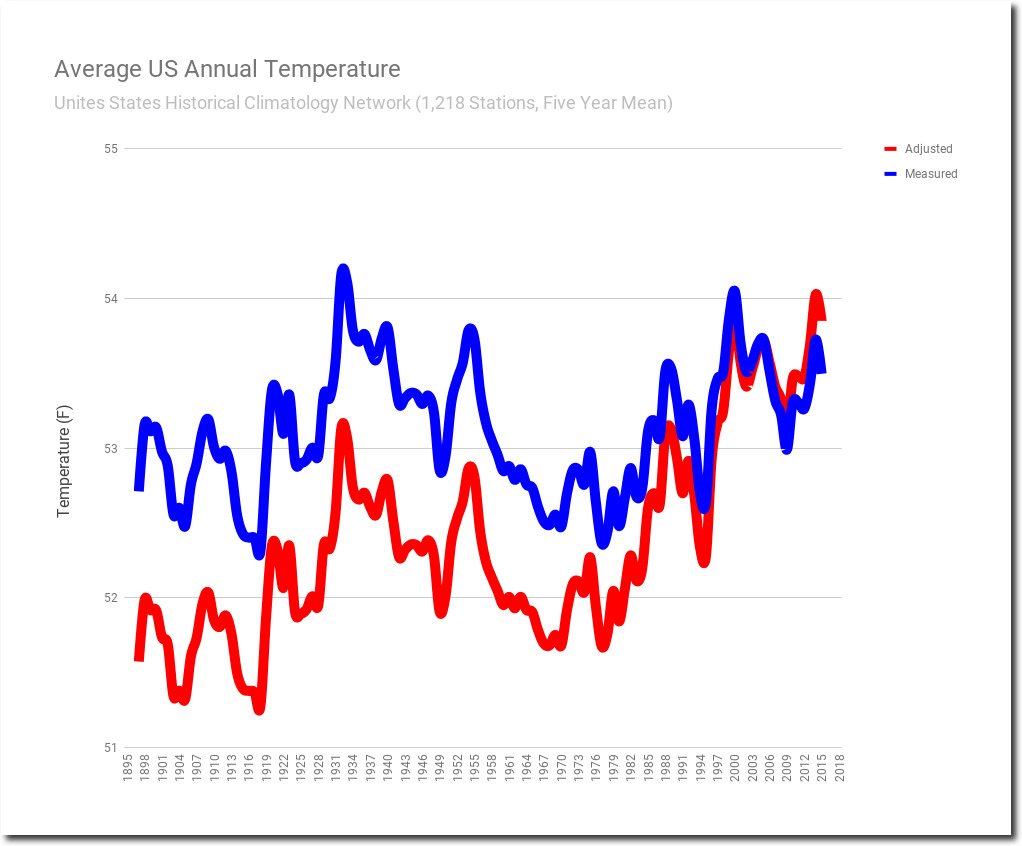
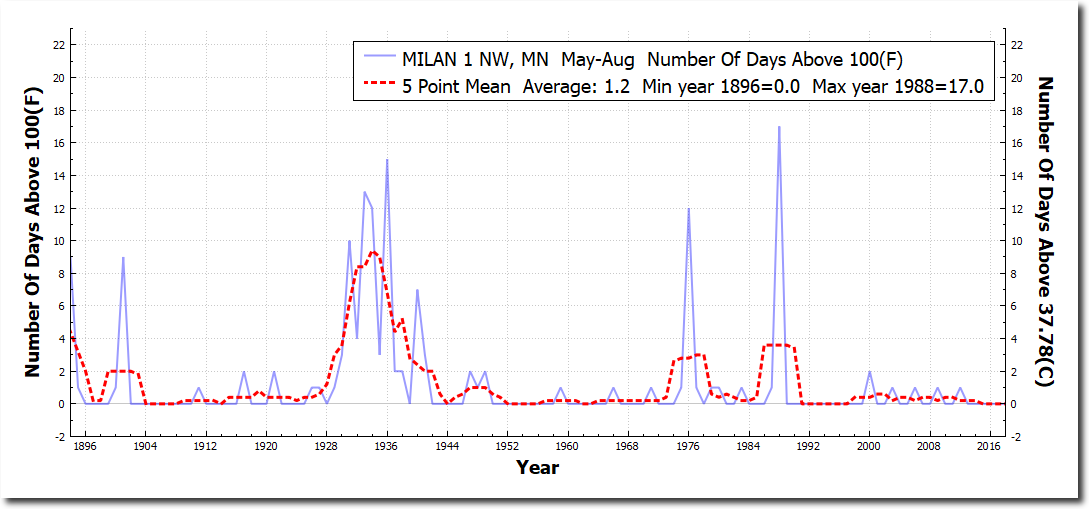
I frequently post these graphs showing how NOAA and NASA have erased America’s hot past, and particularly how they made the incredibly hot year of 1934 disappear.
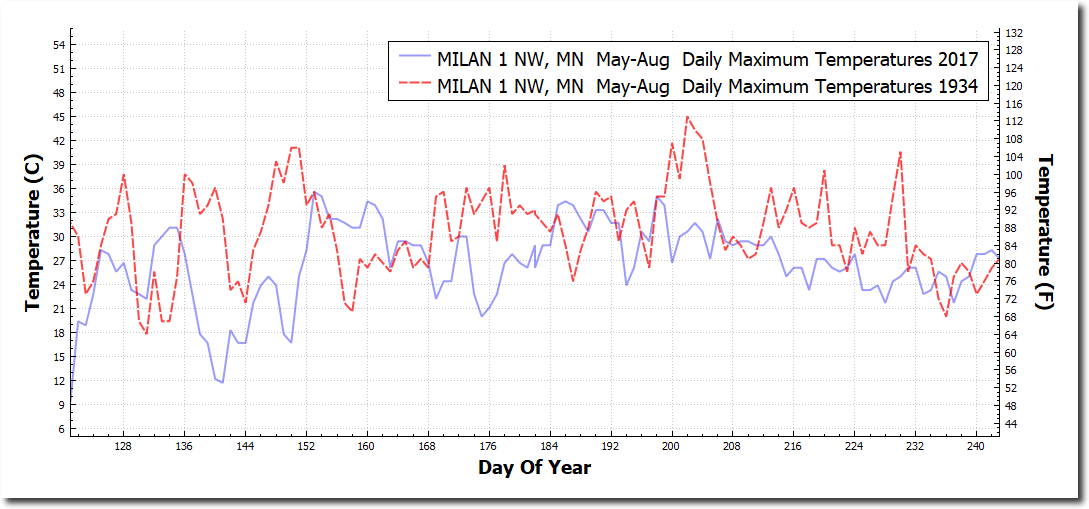
Let’s look at what they are erasing. The summer of 1934 had ten massive heat waves east of the Rockies. Minnesota had a record cold spring this year, but in 1934 Minnesota was an extremely hot place – with many days over 100 degrees. Milan, Minnesota reached 113 degrees in 1934, compared to a maximum of 96 degrees last year.
Minnesota had many hot summers when CO2 was below 350 PPM, but none since CO2 reached James Hansen’s deadly threshold. The last hot summer in Minnesota was 1988, when Hansen warned Congress that the Midwest was going to burn up and dry up.
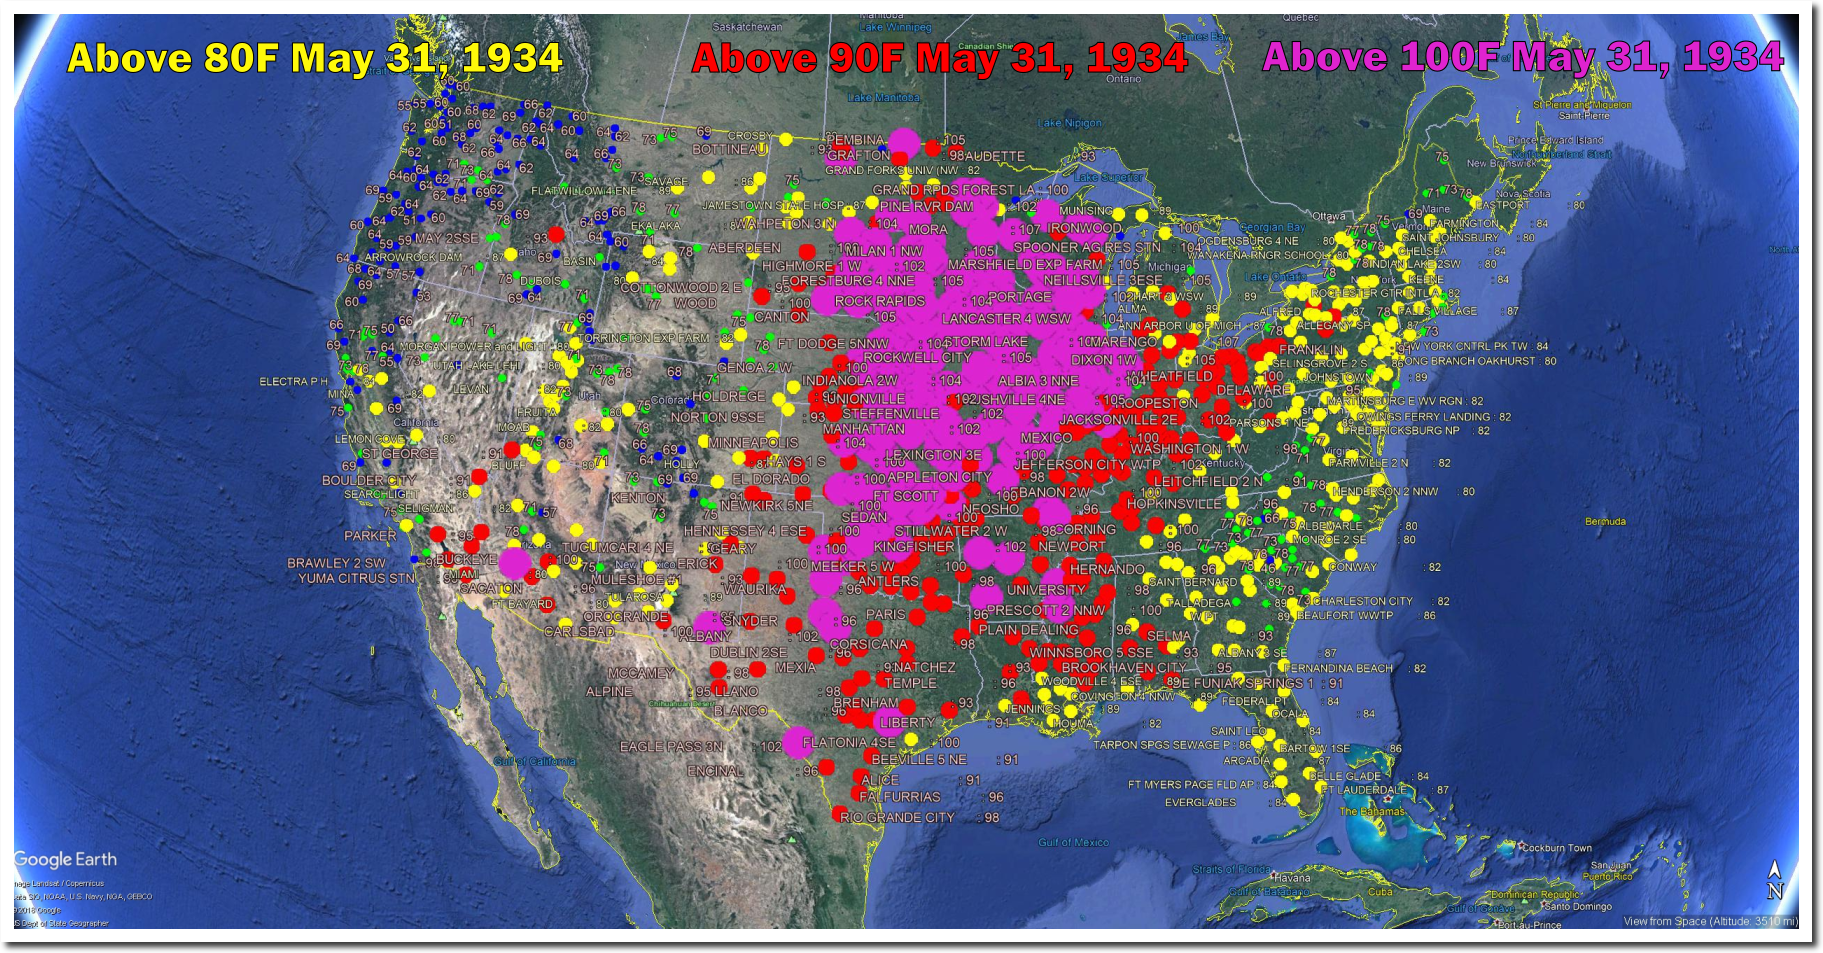
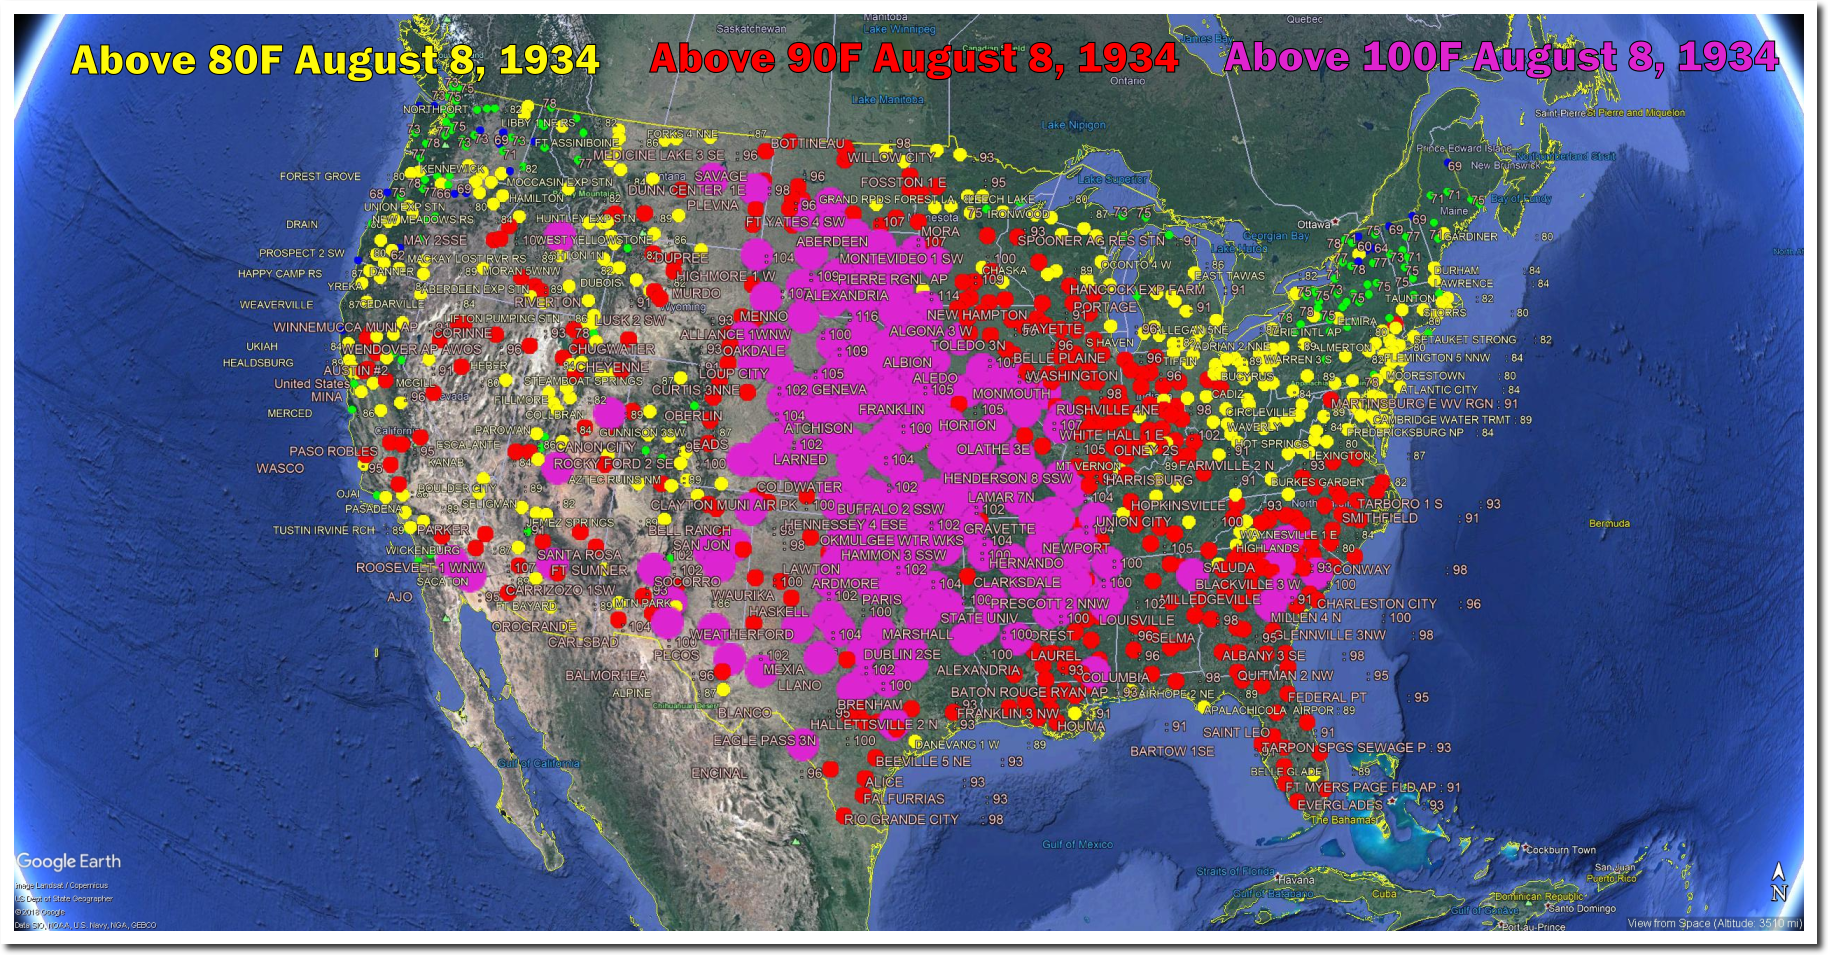
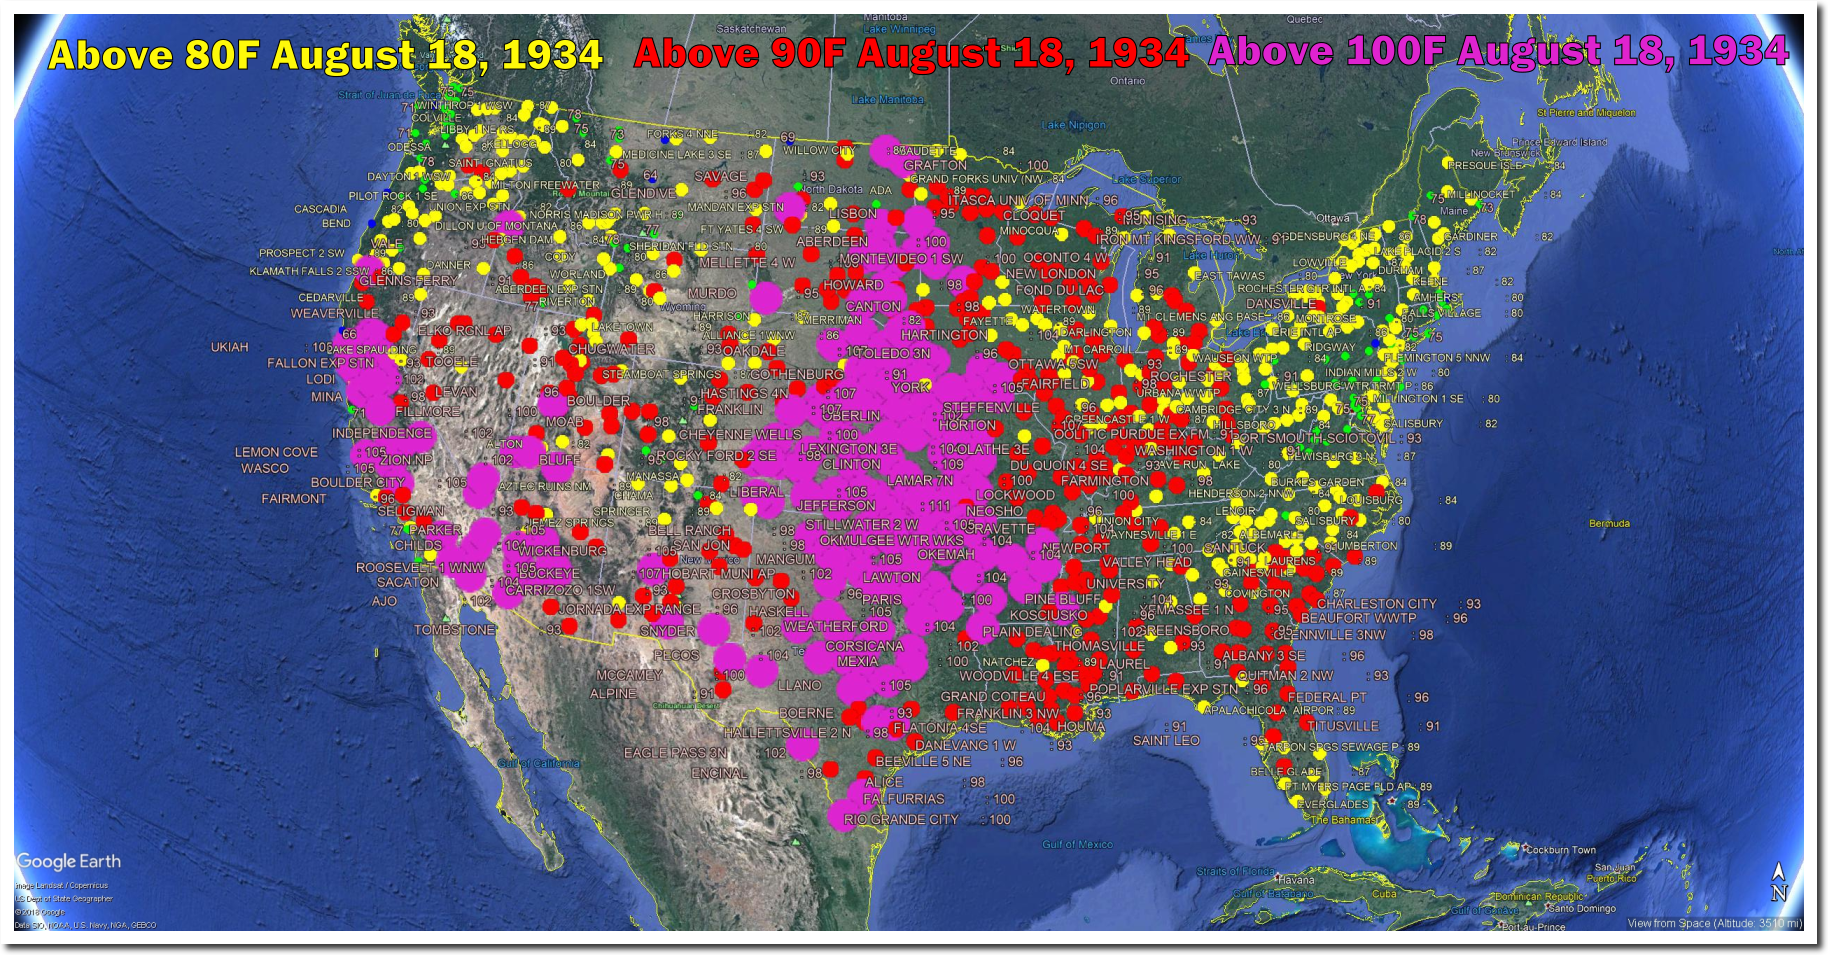
Here are some of the heatwaves of 1934 which Hansen et al erased via data tampering.

But what NASA and NOAA are really erasing is their failed predictions. Thirty years ago this month, NASA’s James Hansen warned Congress of increased heatwaves and droughts in the Midwest. He had it exactly backwards.
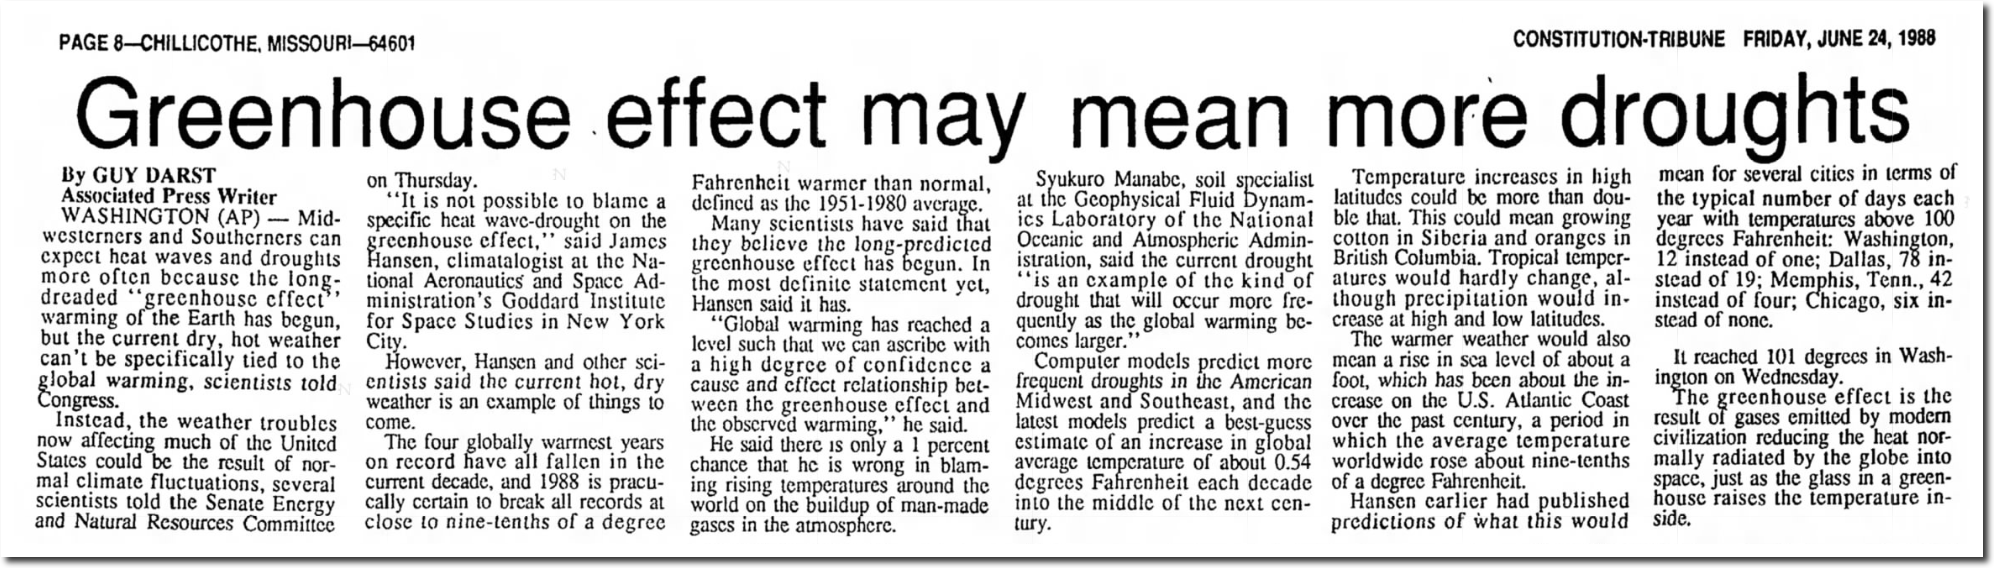
24 Jun 1988, Page 8 – The Chillicothe Constitution-Tribune at Newspapers.com
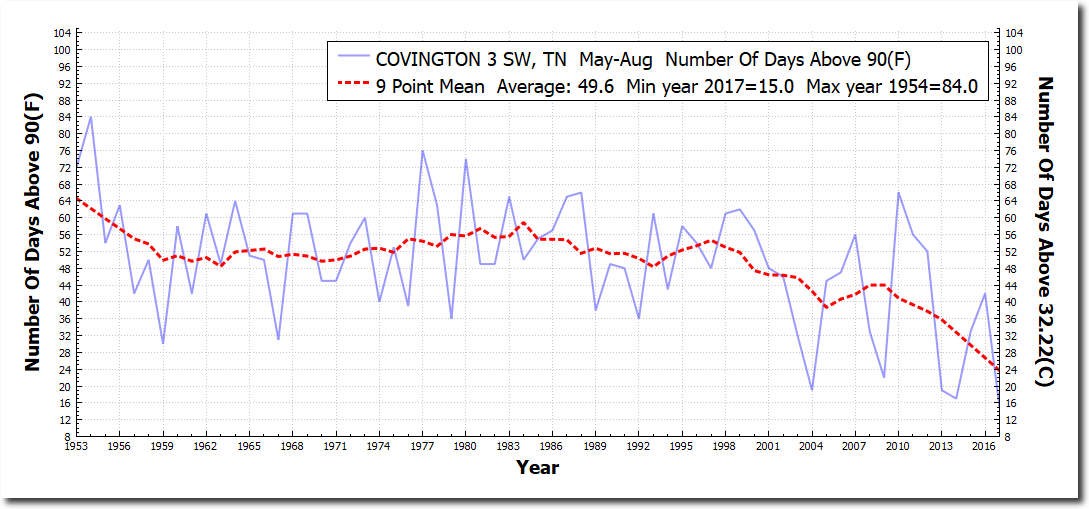
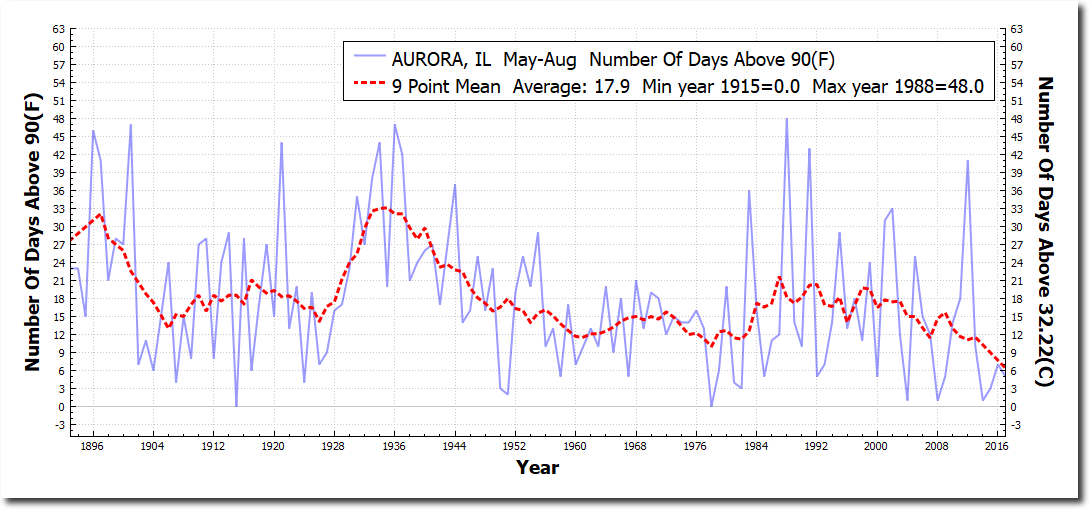
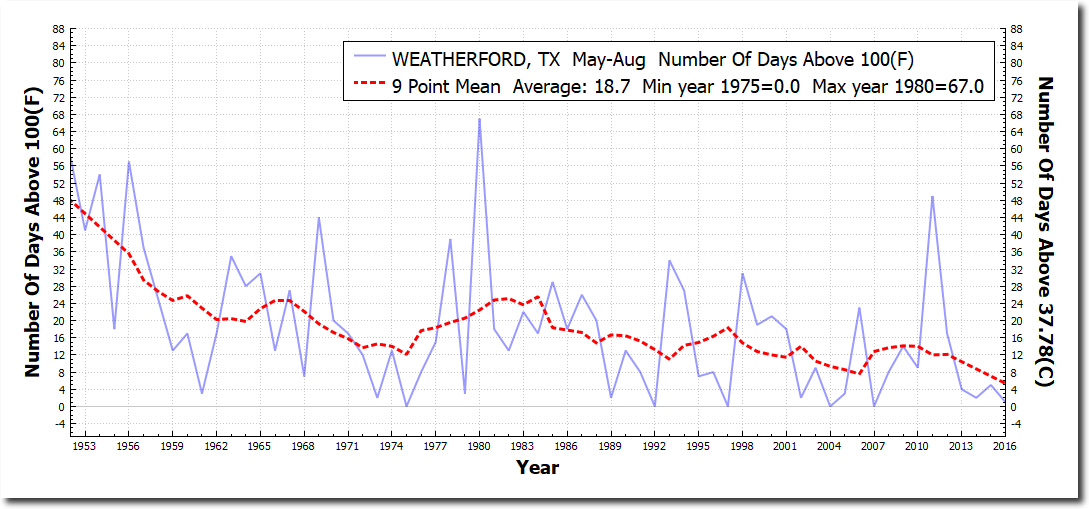
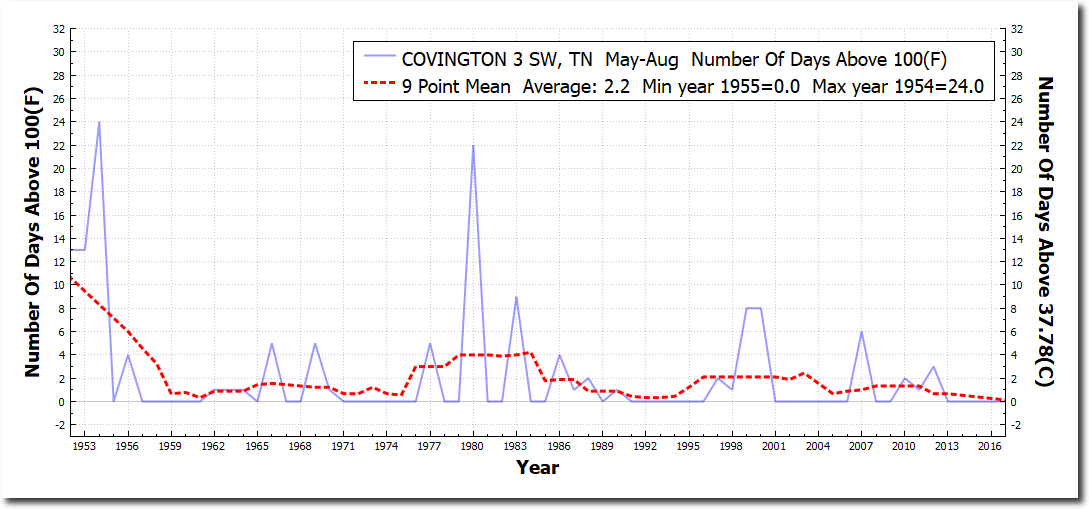
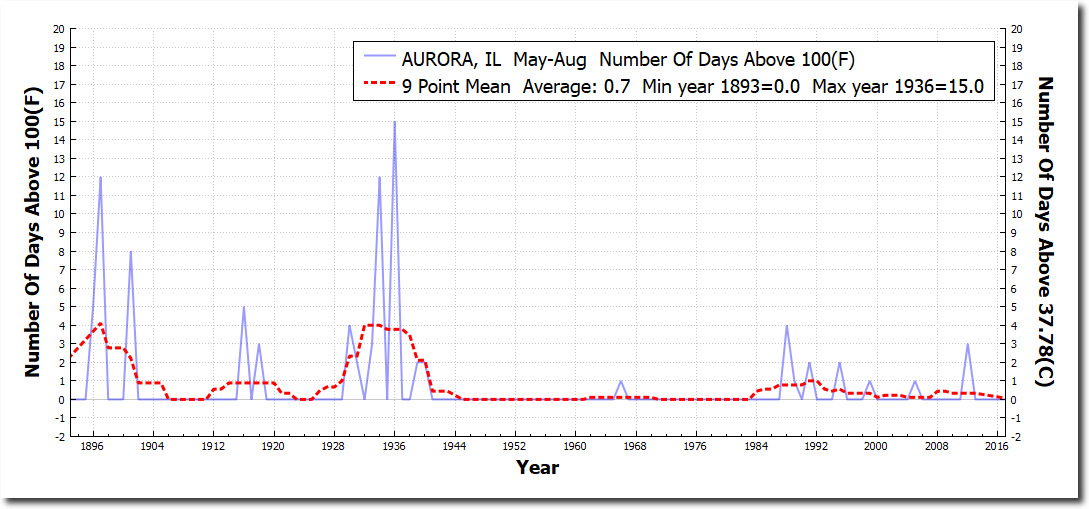
Hansen made specific predictions about the number of 100 degree days skyrocketing in several cities around the US, and growing cotton in Siberia.
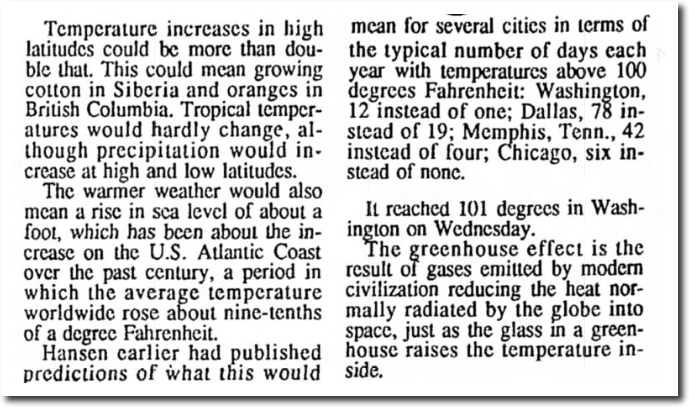
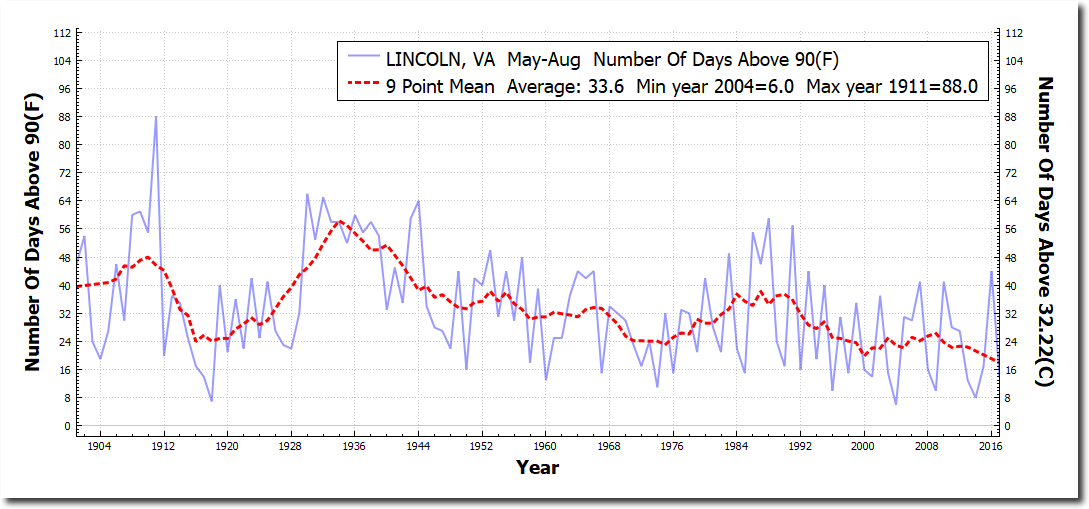
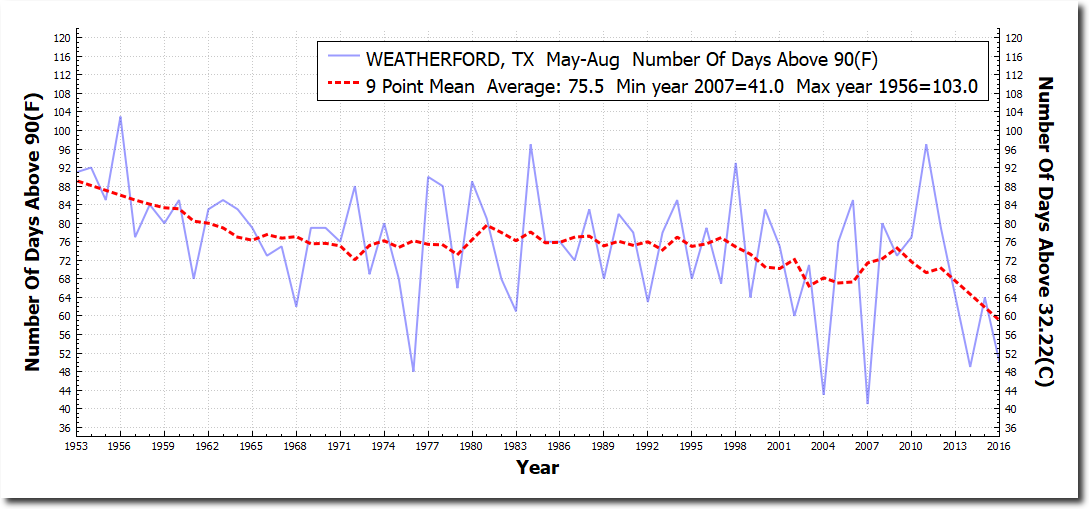
Every one of his predictions was backwards. The frequency 90 and 100 degree days has plummeted in the US.
Closest Virginia USHCN station to Washington DC
Closest USHCN station to Dallas.
Closest USHCN station to Memphis.
Closest USHCN station to Chicago.

All of Hansen’s temperature forecasts were wrong, as were his drought forecasts. Both the US and the Midwest have gotten much wetter over the past century, exact opposite of Hansen’s forecasts.
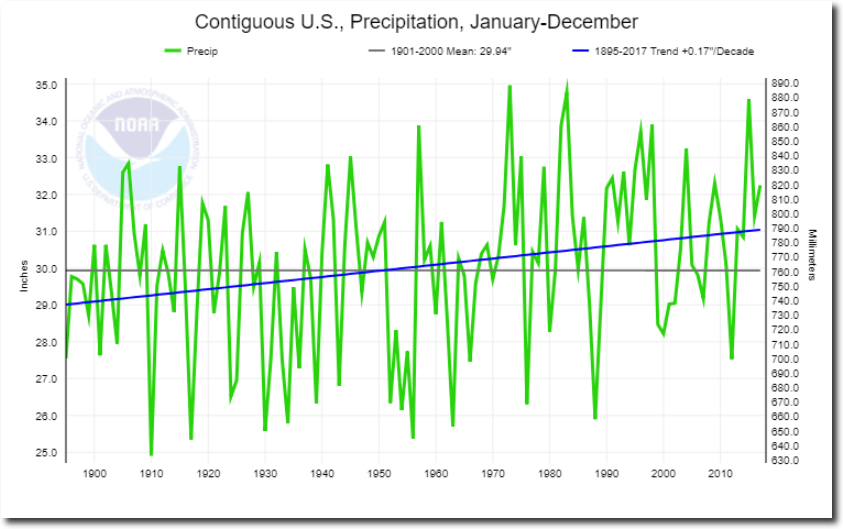
Climate at a Glance | National Centers for Environmental Information (NCEI)
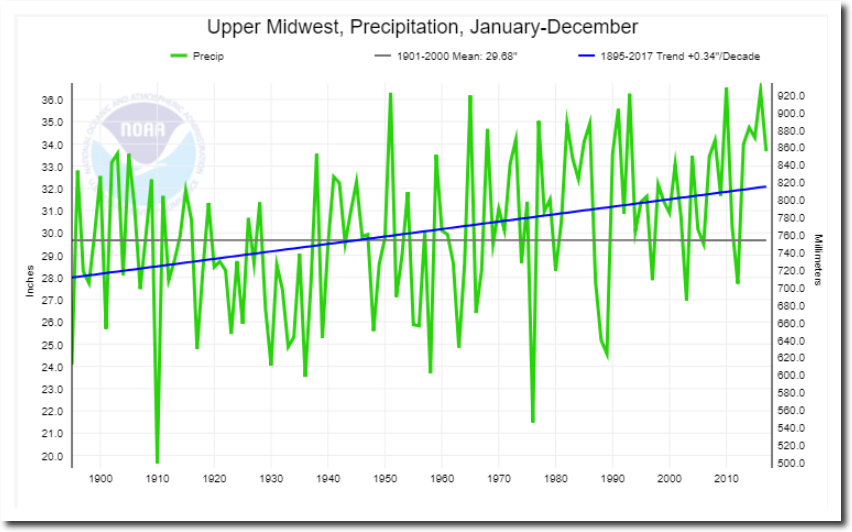
Climate at a Glance | National Centers for Environmental Information (NCEI)
And what about the predictions of growing cotton in Siberia? Scientists got this idiocy from Arrhenius over 100 years ago.
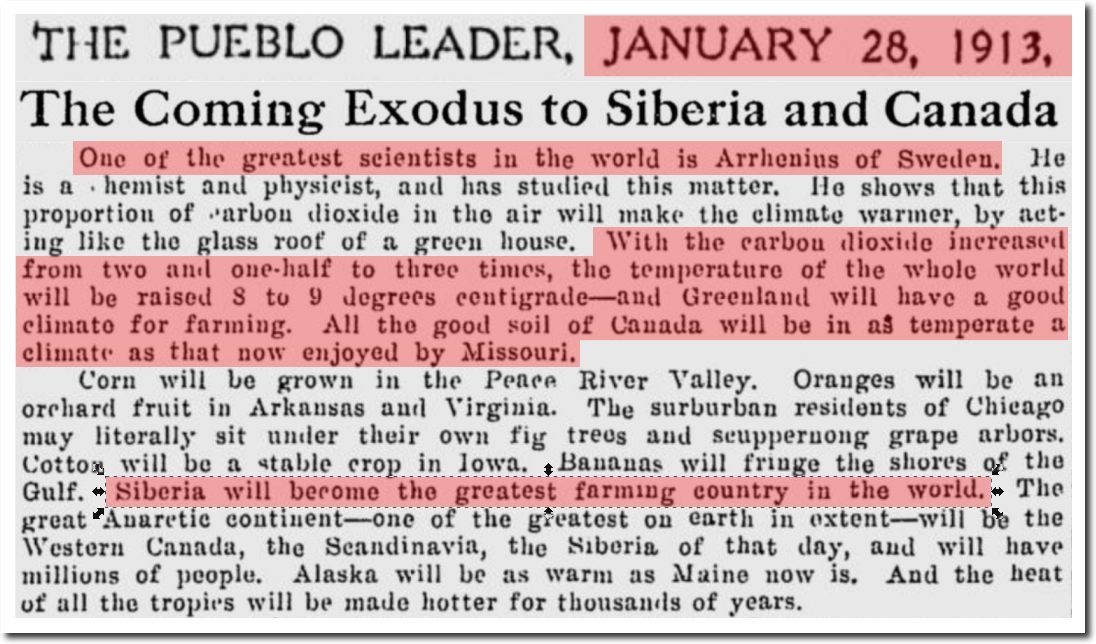
The Pueblo Leader – Google News Archive Search
Siberia broke the Northern Hemisphere record for cold this year. Cotton doesn’t grow at -62C.
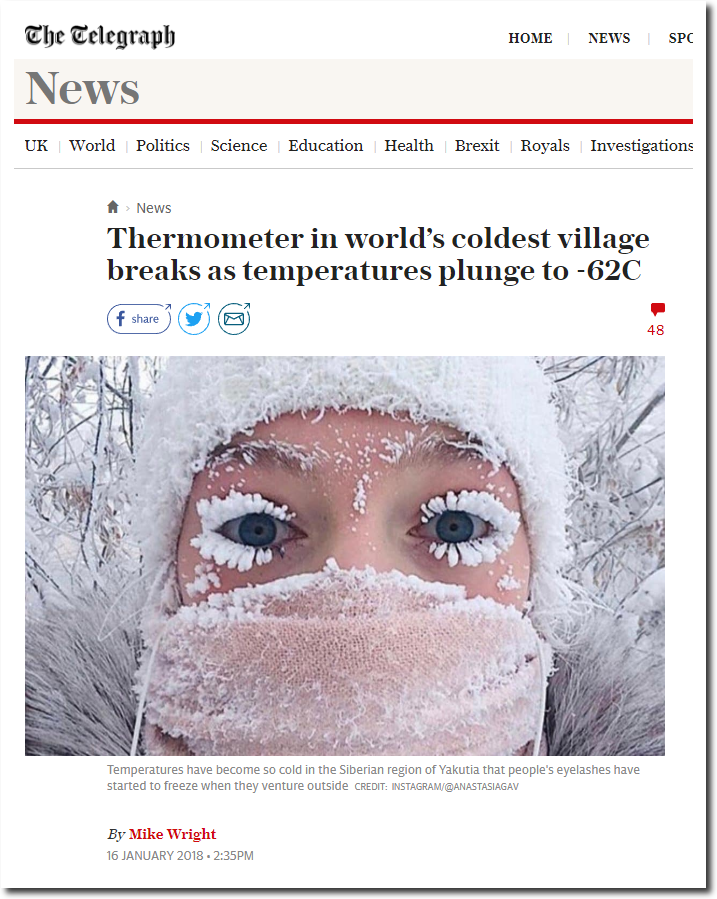
Thermometer in world’s coldest village breaks as temperatures plunge to -62C
Hansen “echoing the work of other scientists” predicted the Arctic would be ice-free no later than 2018. Democrats declared him a prophet over that prediction.

The Argus-Press – Google News Archive Search
Instead, we are seeing the highest volume of sea ice in several years, very slow melt, and ice volume almost reaching the “normal line.”
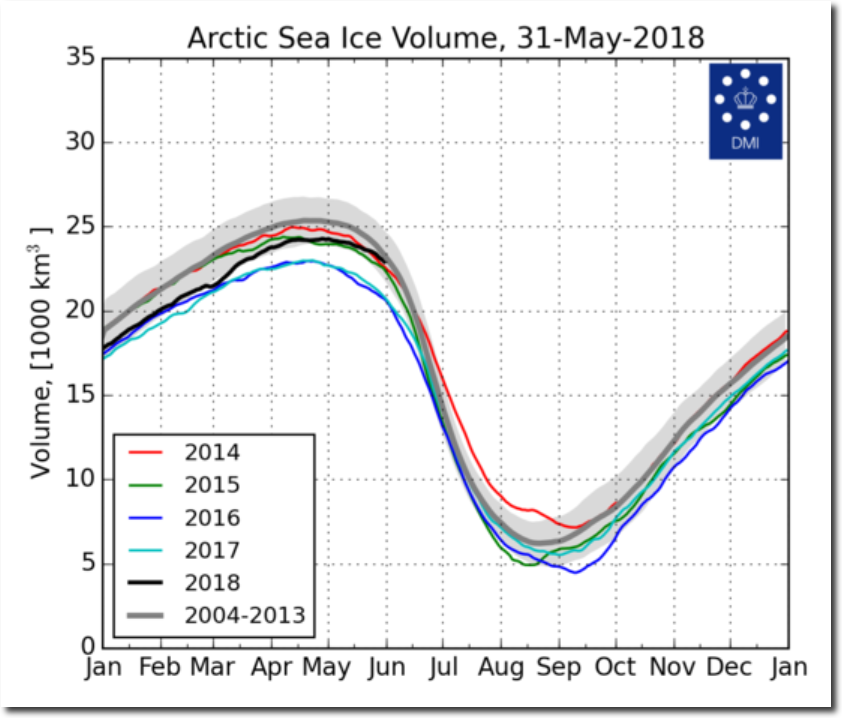
FullSize_CICE_combine_thick_SM_EN_20180531.png (1337×1113)
Climate scientists have been pushing junk global warming theory on and off for over a century. But the real hysteria started with James Hansen in June, 1988. As his predictions failed, he began to tamper with the data to cover his tracks, and now all that climate science is left with is failed models, fraud and data tampering. It is a criminal venture in collapse.
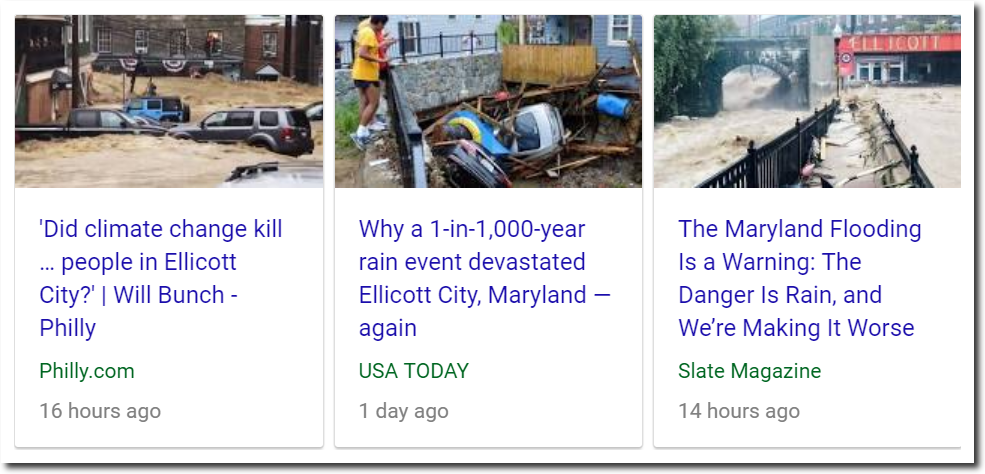
The press is quite predictably parroting their usual lies and hysteria about the Ellicott City, MD flooding, where they received 3-6 inches of rain in two hours. Press geniuses are calling six inches inches of rain a 1-in-1000-year rain event.
I used to ride my bike to the Ellicott City Assembly of God church, where my friend Karen sang.

Racist Taunts In The Classroom | Real Science
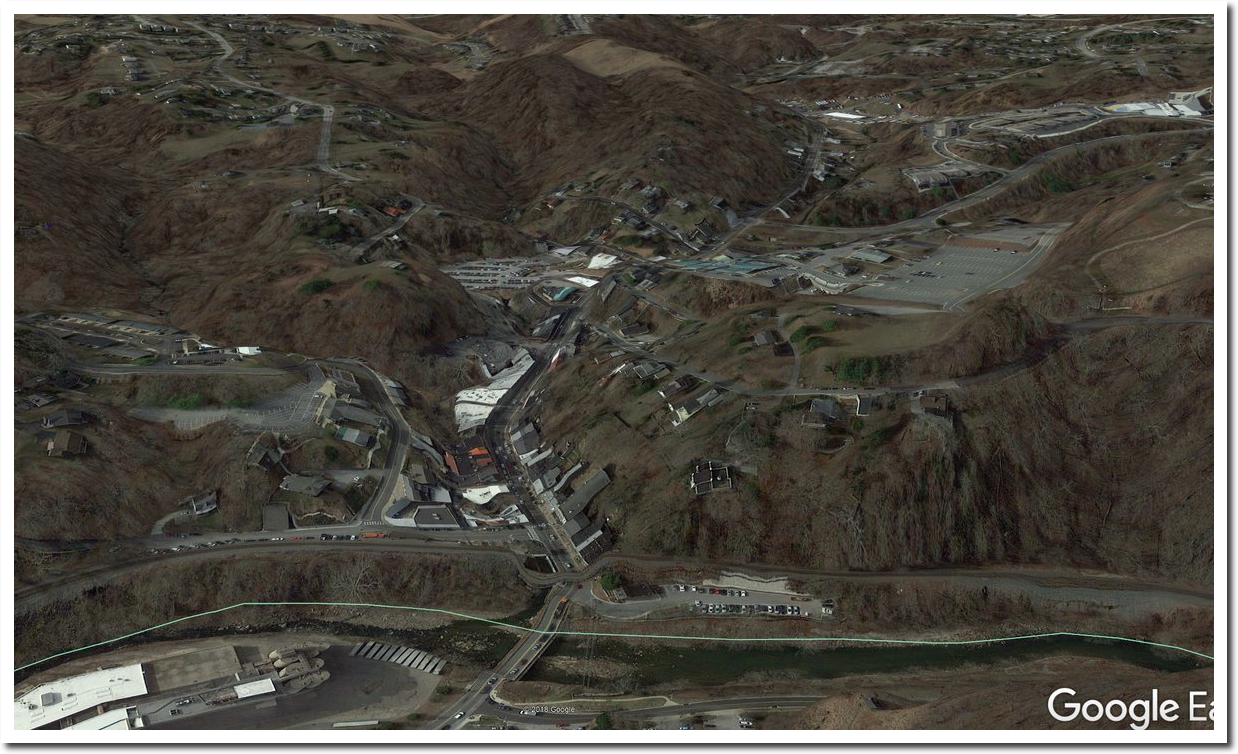
Downtown Ellicott City is located in the bottom of an intermittent river channel, with lots of asphalt perched overhead. When it rains, all the drainage off the parking lots comes directly downtown.
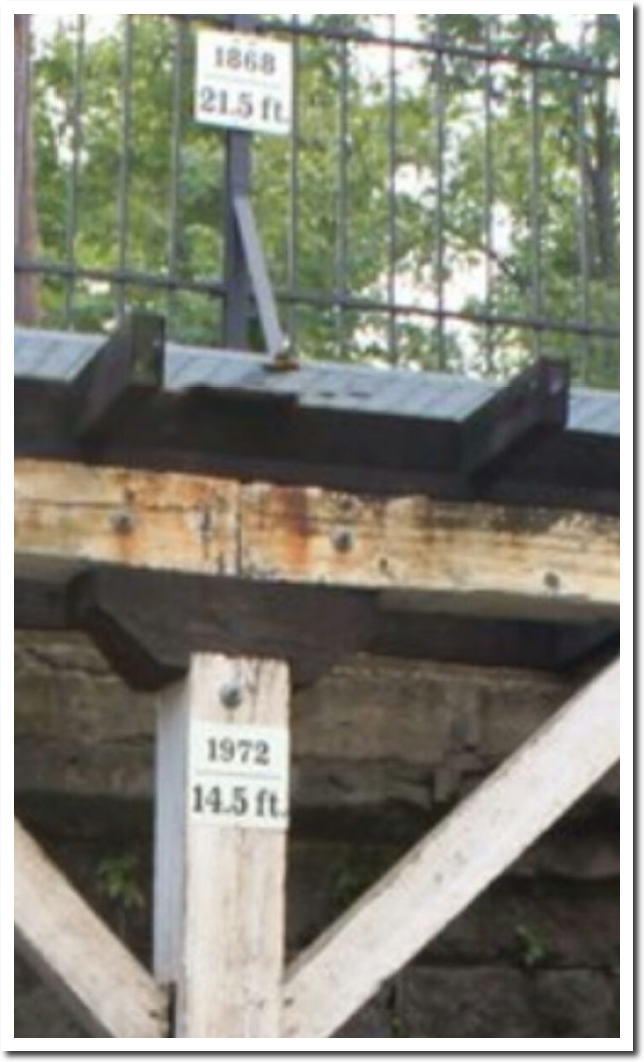
Even before the parking lots were built, Ellicott City had massive floods – their worst one occurring 150 years ago, with a “40 foot wall of water.” According to USA Today, that was more than 1,000 years ago.
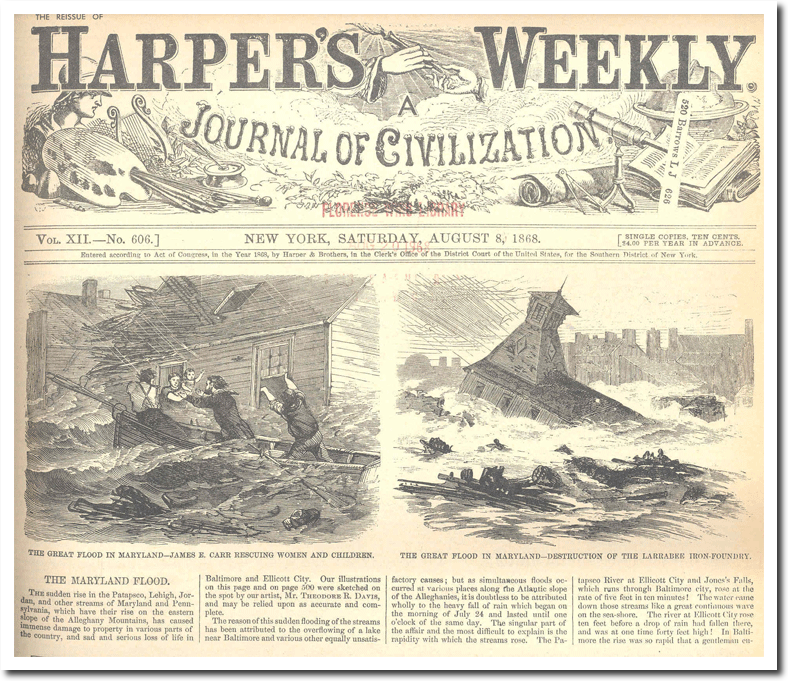
Historic Ellicott City, MD – Floods – Saturday, August 8, 1868
The Washington Post calls Ellicott City “a town of many, many floods” which the city has marked.
It is remarkable that anyone would would be stupid or dishonest enough to claim 3-6 inches of rain in two hours is a record. Maryland holds the US record of 1.23 inches of rain in one minute. On Memorial Day weekend 1935, Woodward Ranch, Texas received a world record fifteen inches of rain in two hours. And in 1942, Smethport, PA received a world record 28.5 inches of rain in three hours.
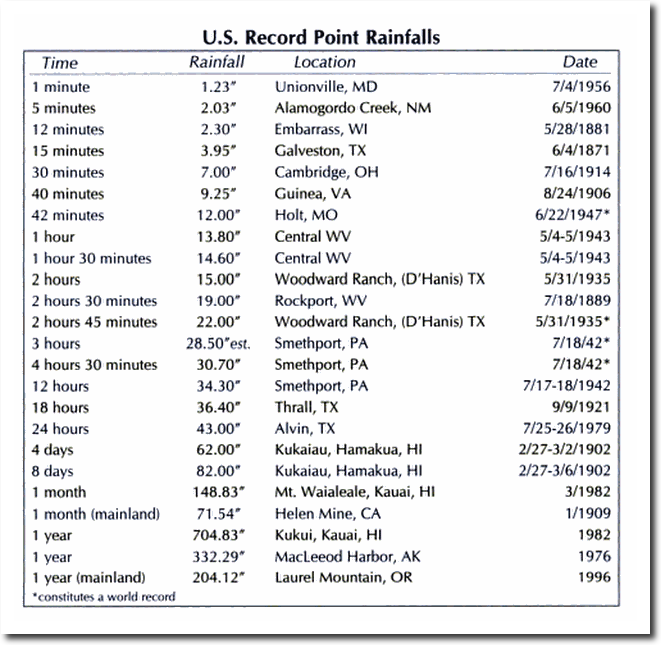
Extreme Weather: A Guide & Record Book – Christopher C. Burt – Google Books
On this date in 1935, two locations in Colorado received 24 inches of rain in six hours, killing hundreds of people.
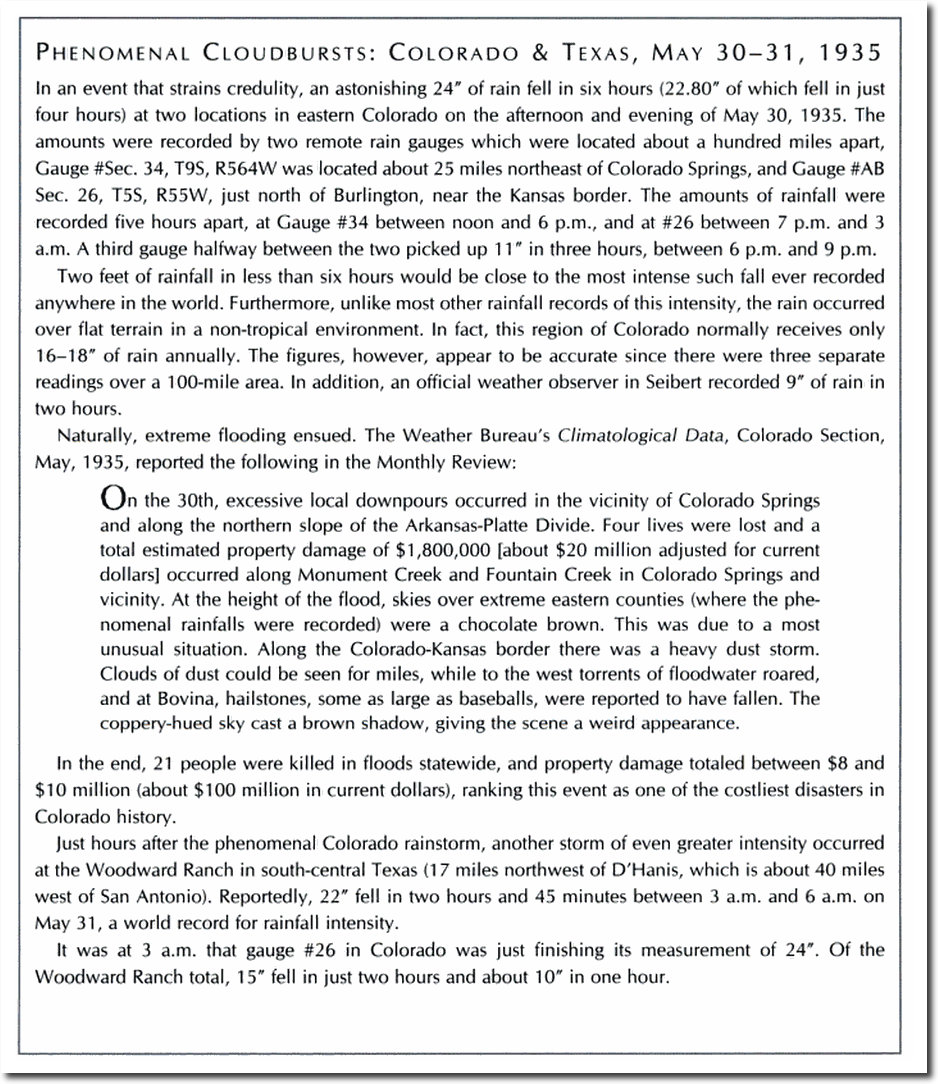
Extreme Weather: A Guide & Record Book – Christopher C. Burt – Google Books
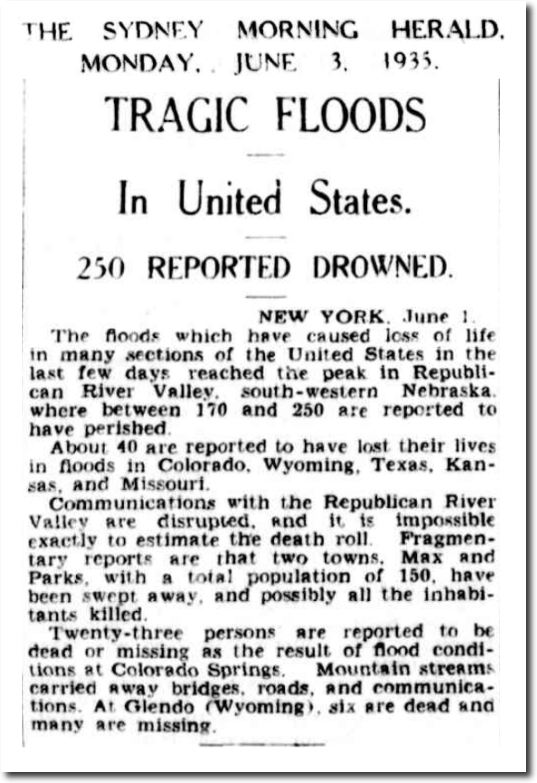
03 Jun 1935 – TRAGIC FLOODS – Trove
Climate alarmism depends on lies, fake statistics and a misunderstanding of science and history. Downtown Ellicott City is a disaster waiting to happen every time it rains.
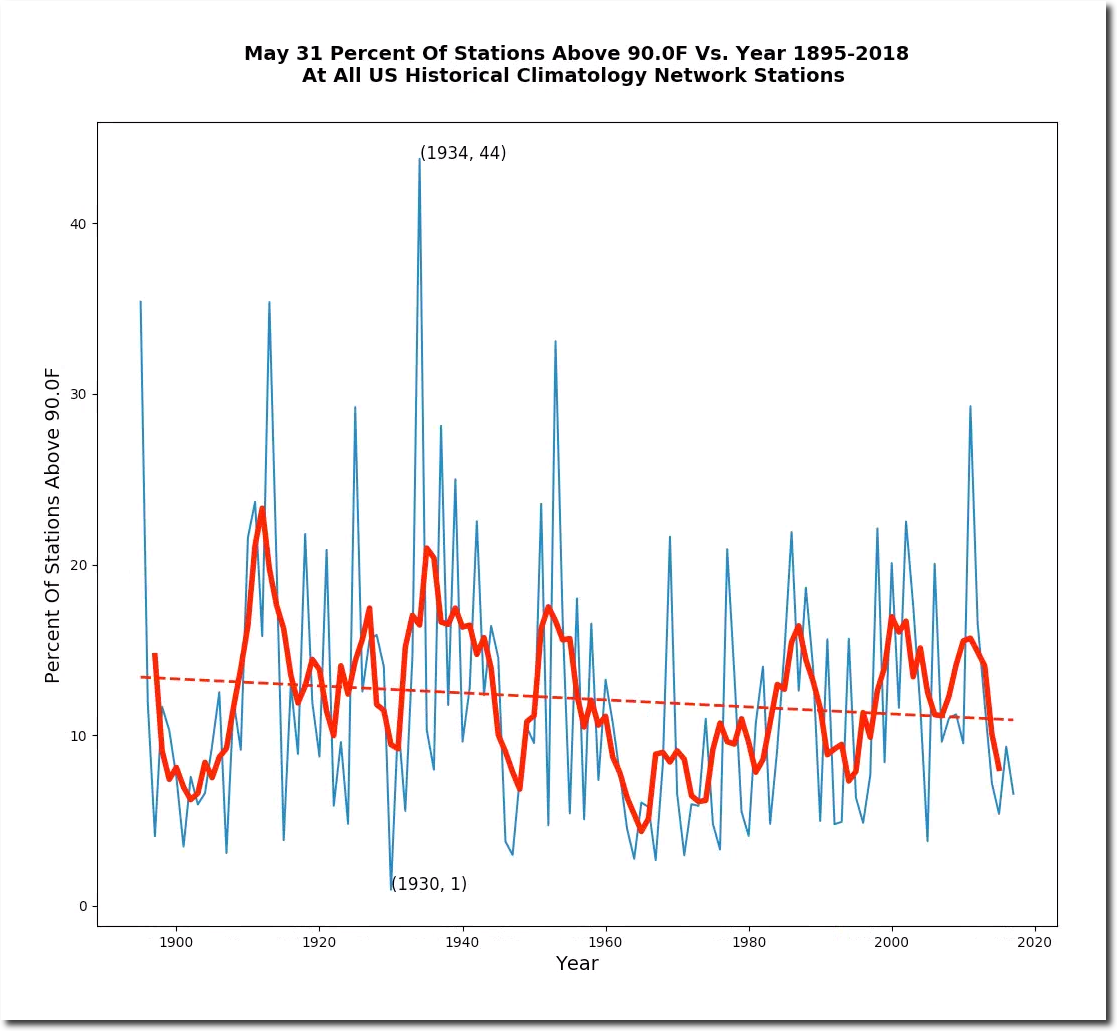
The likelihood of hot weather on May 31 has plummeted in the US over the past century.
On the last day of May, 1934 100 degree temperatures covered the Great Plains and Midwest. Fayette, Iowa was 109 degrees. Temperatures that hot in Iowa are inconceivable now in July, much less in May.
1934 was the warmest year on record in the US, and NOAA compensates for the heat by simply erasing it.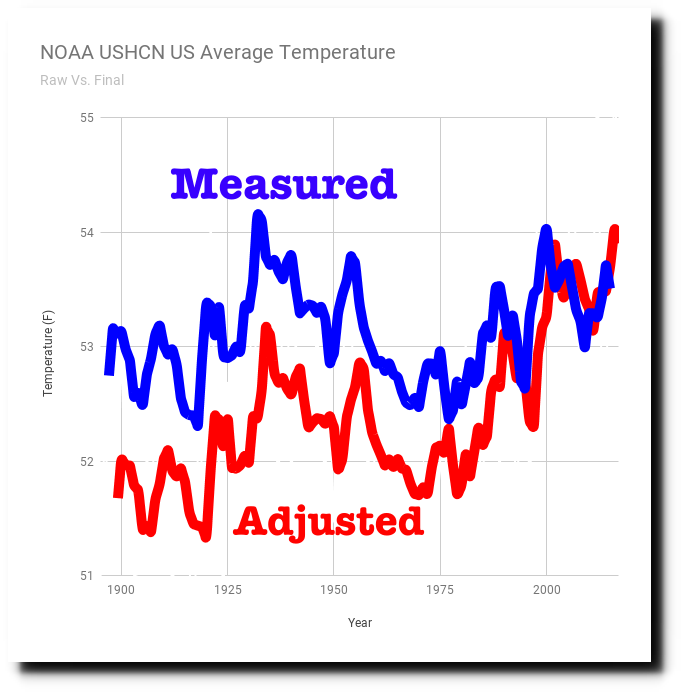
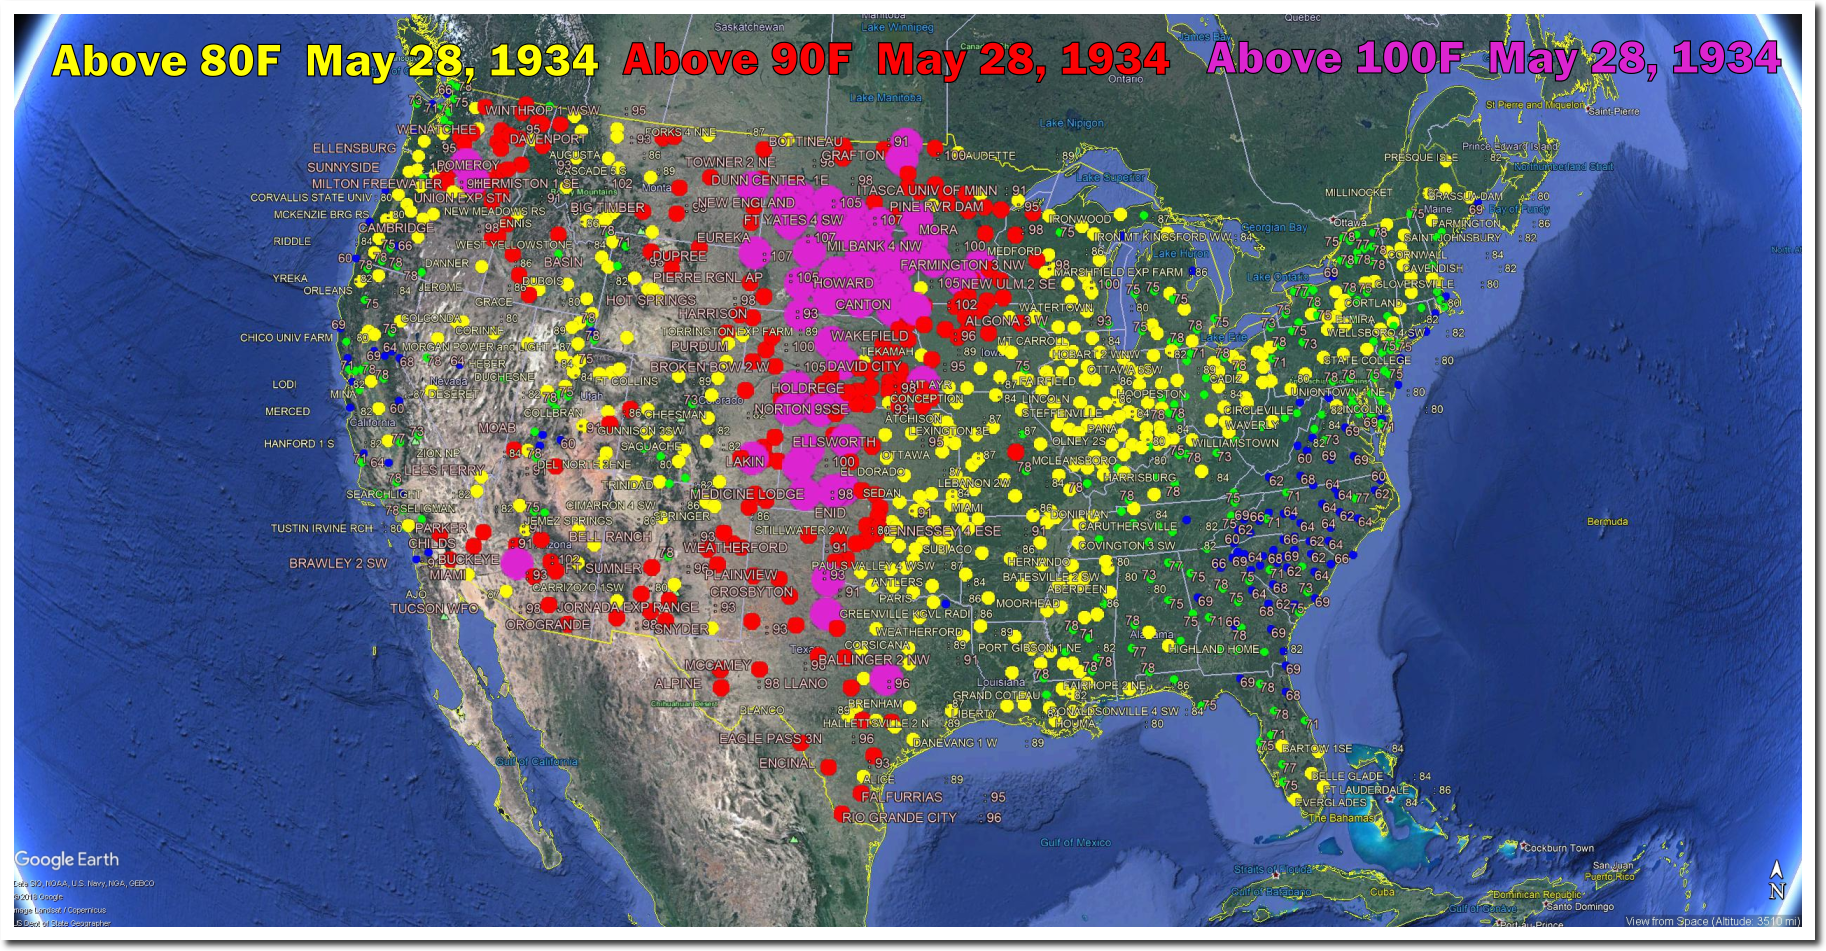
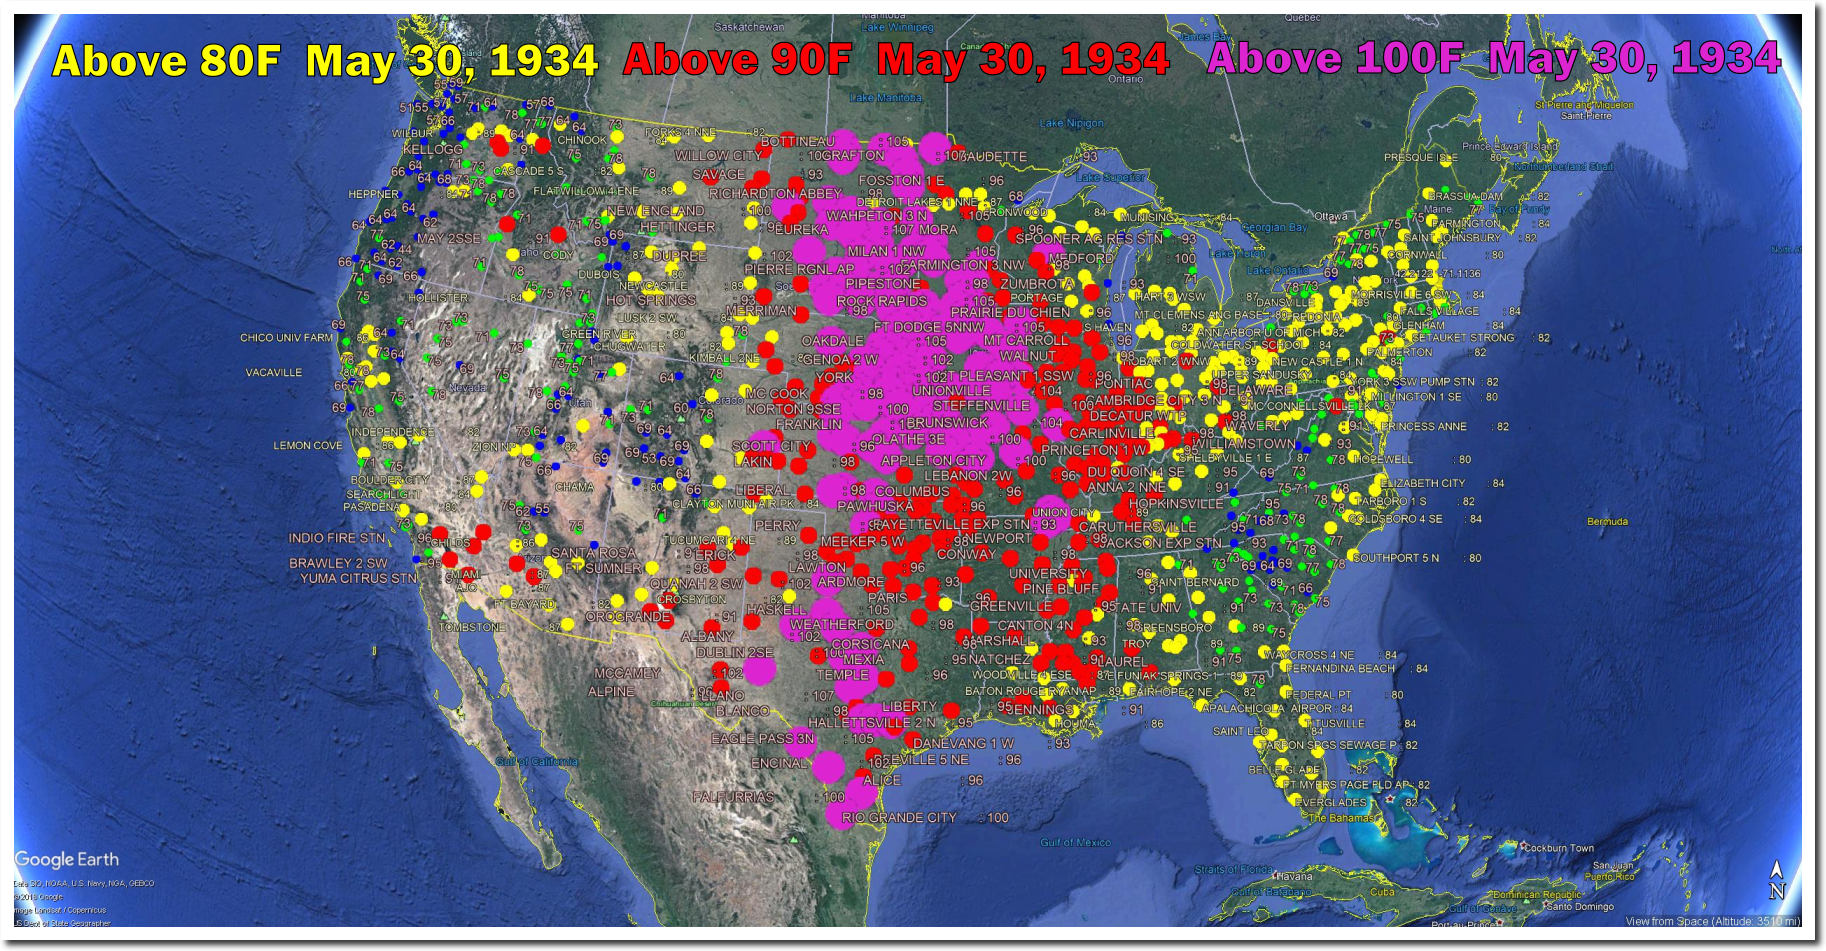
May, 1934 brought three incredible heatwaves to the US. The first peaked on May 8, the second on May 18, and the third on May 30. It was 109 degrees at Gann Valley, SD on May 28, 1934 – twenty degrees warmer than today’s forecast.
By May 30, the heatwave got even more intense and covered all of the Great Plains and Midwest. North Dakota reached 111 degrees.
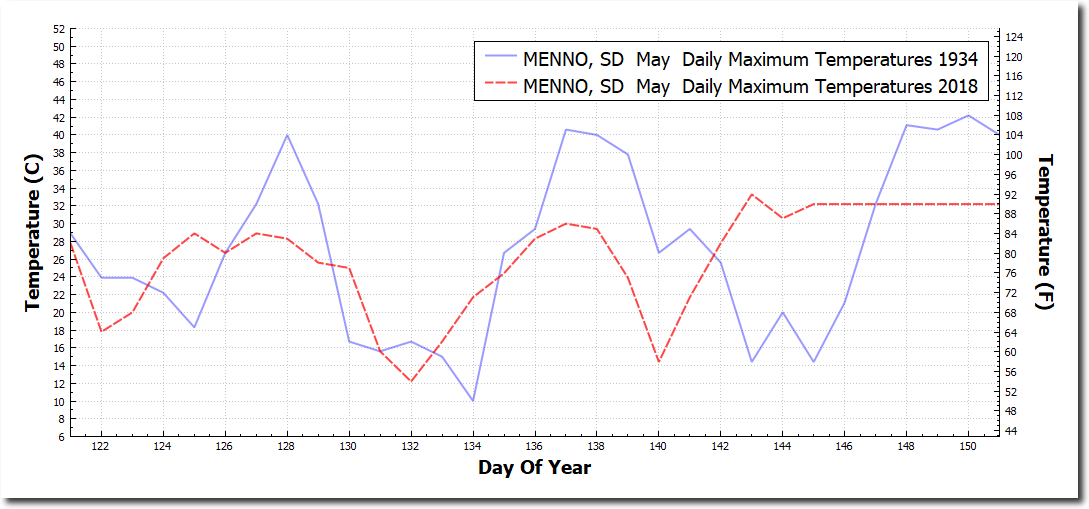
Menno, SD averaged five degrees warmer during May 1934 than this year.
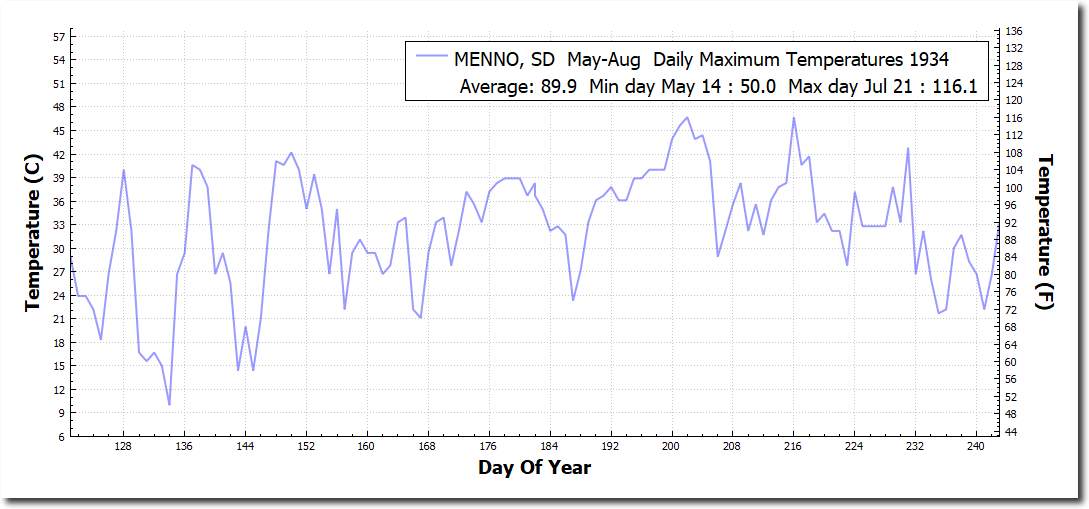
As the summer of 1934 progressed, temperatures kept getting hotter. Menno reached 116 degrees during July and August 1934.
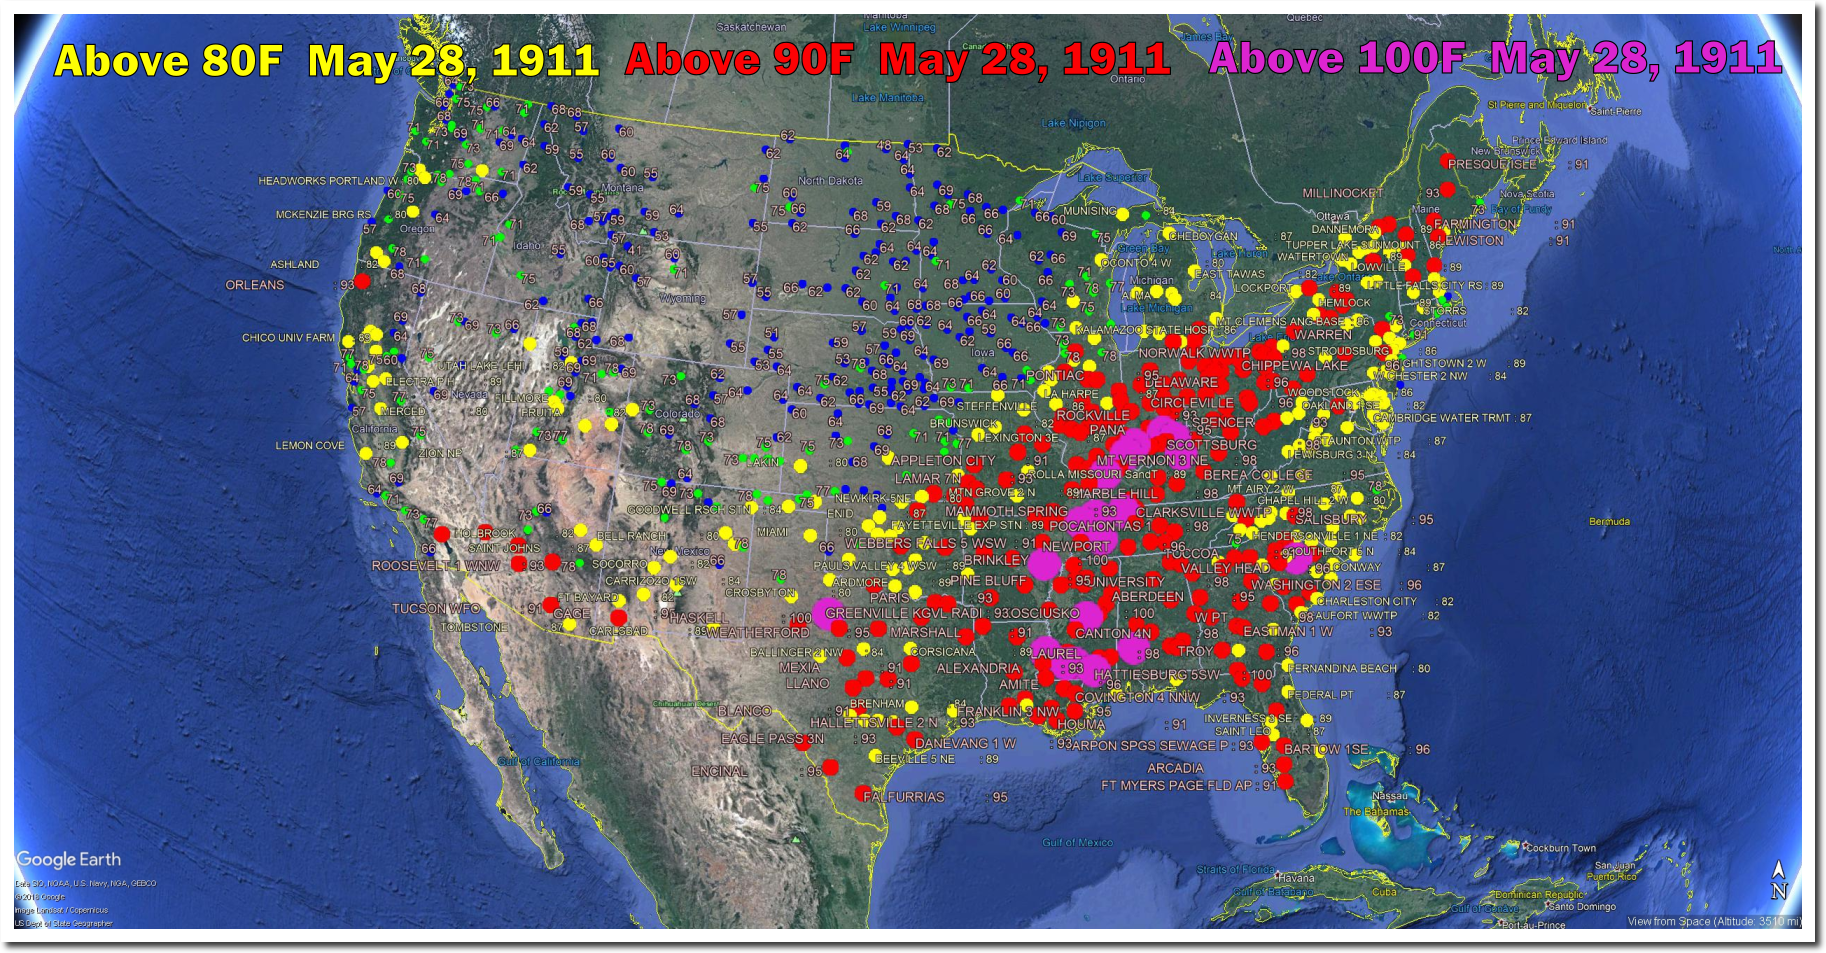
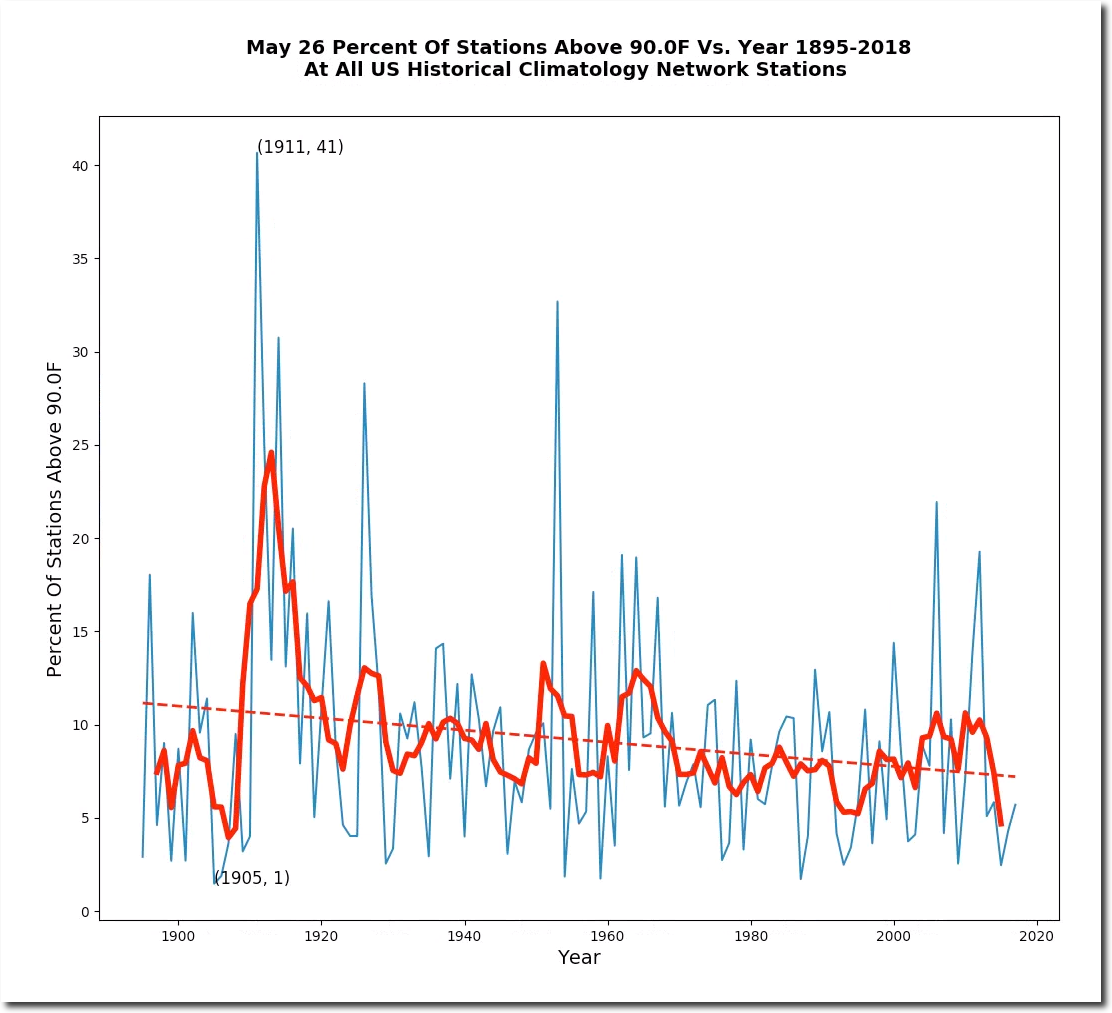
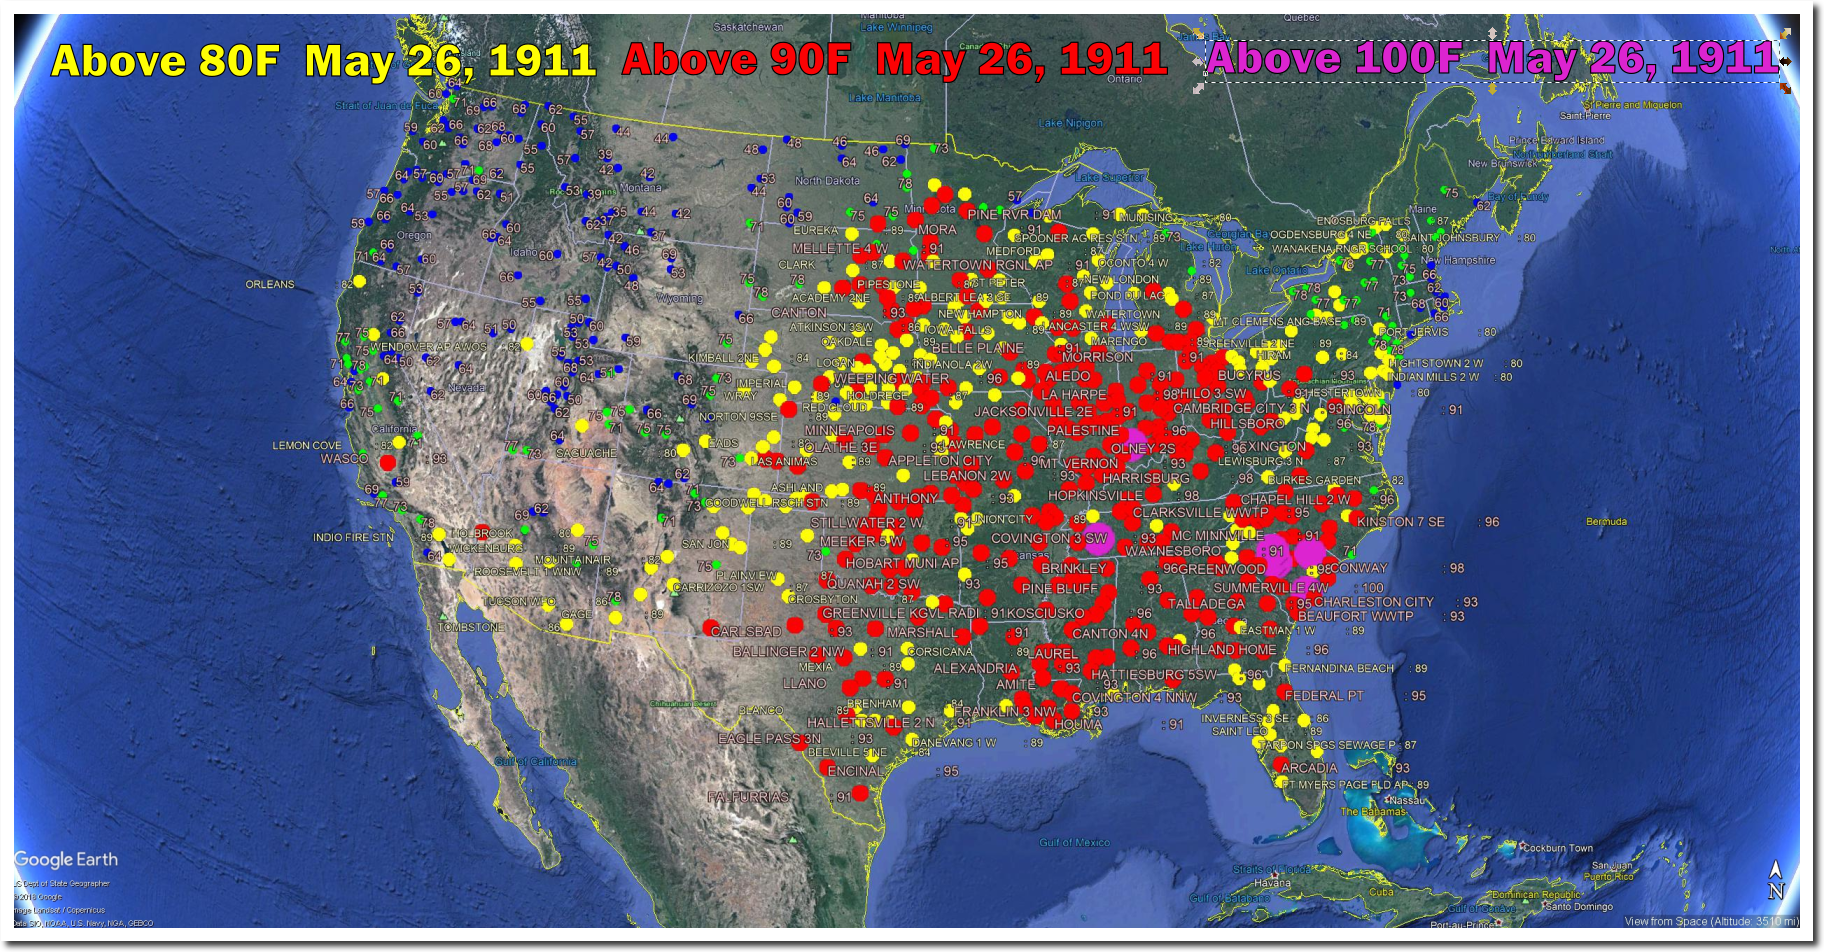
Ninety degree weather on May 28 peaked in 1911, and has been declining ever since.
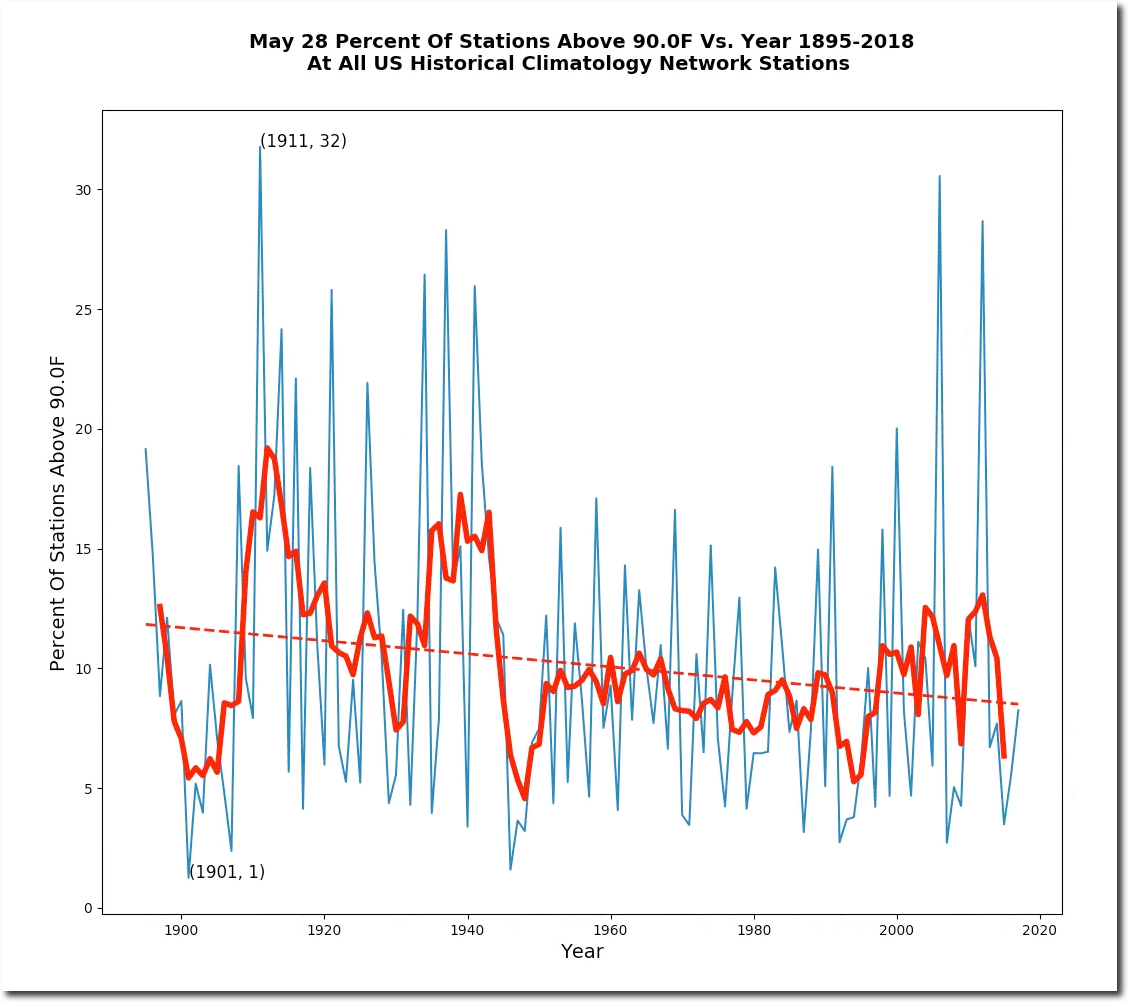
On this date in 1911, 90 and 100 degree temperatures dominated the eastern US, spreading all the way to the northern tip of Maine.
The whole aim of practical politics is to keep the populace alarmed (and hence clamorous to be led to safety) by menacing it with an endless series of hobgoblins, all of them imaginary.
- H. L. Mencken
In 1969, the world’s most famous environmental scientist (Paul Ehrlich of Stanford) warned we would all die by 1989 in a cloud of blue steam.
“The trouble with almost all environmental problems,” says Paul R. Ehrlich, the population biologist, “is that by the time’ we have enough evidence to convince people, you’re dead.”
“We must realize that unless we are extremely lucky, everybody will disappear in a cloud of blue steam in 20 years”
- New York Times August 10, 1969, Page 53
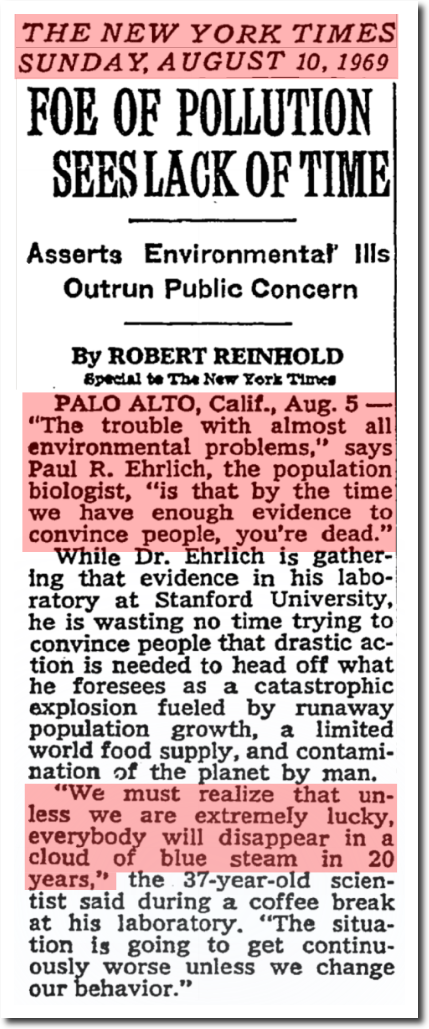
FOE OF POLLUTION SEES LACK OF TIME The New York Times
A year later he said we would run out of water by 1974, and out of food by 1980.
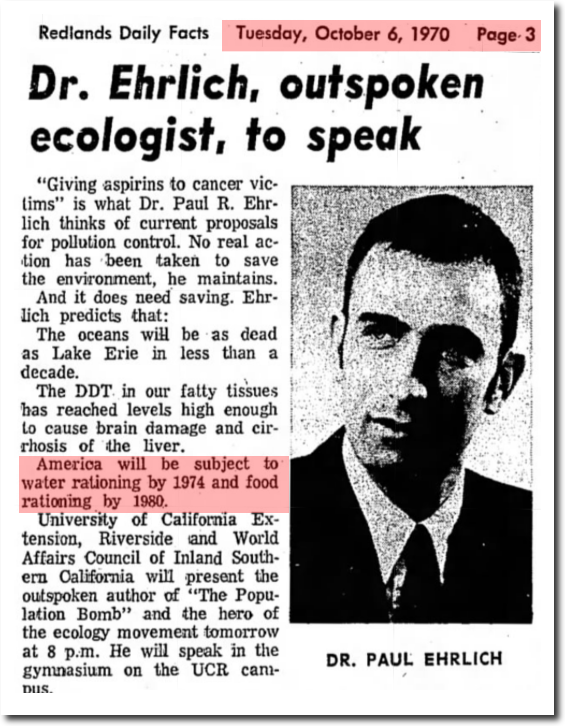
06 Oct 1970, Page 3 – Redlands Daily Facts at Newspapers.com
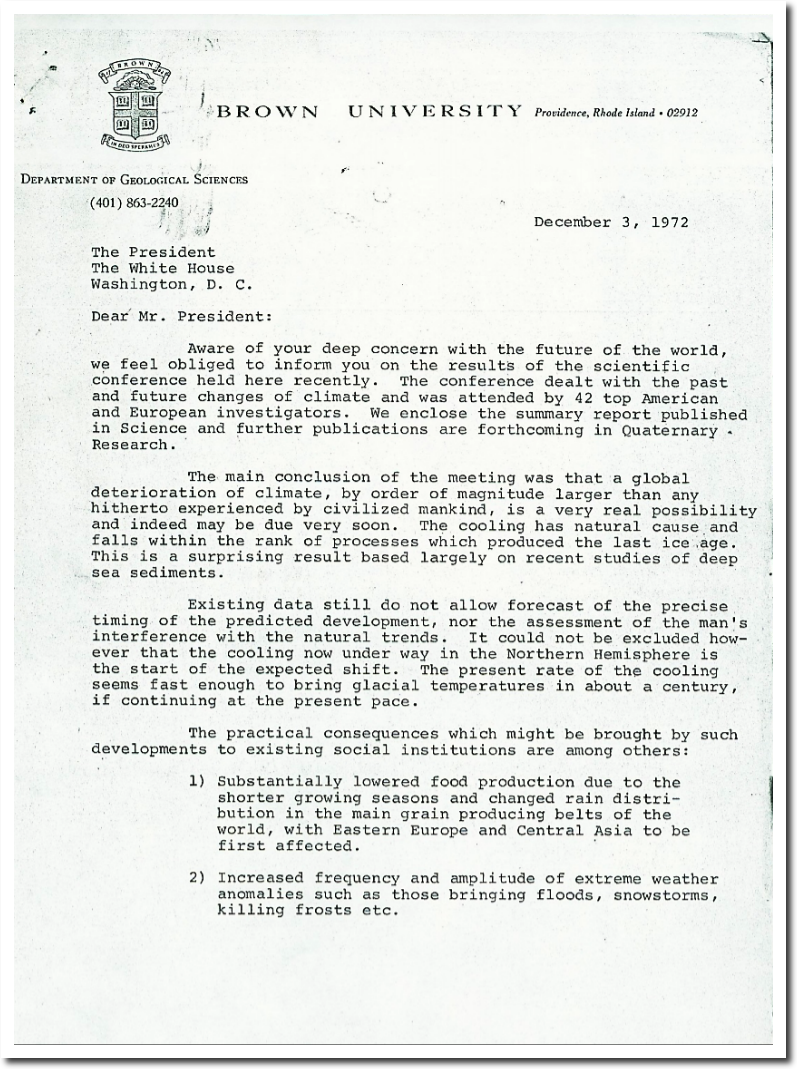
Two years later, the world’s leading climate experts warned President Nixon about a new ice age “in about a century.”
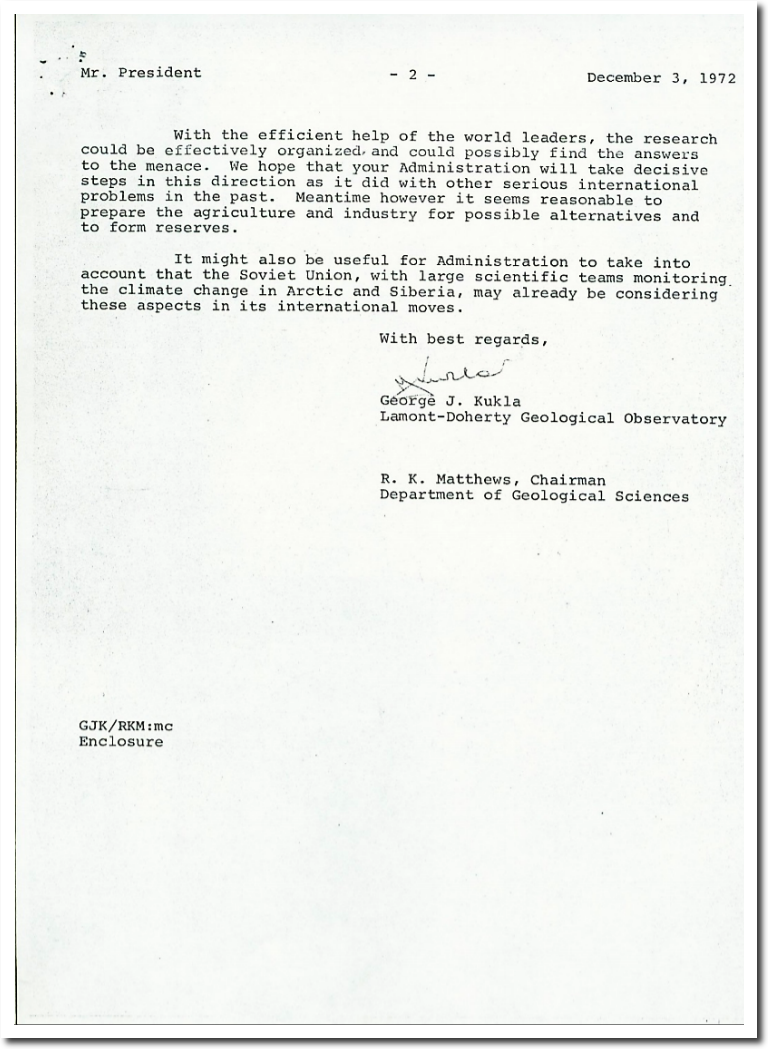
THE ROLE OF NOAA’S CLIMATE PREDICTION CENTER IN THE DEVELOPMENT OF CLIMATE SERVICES
We didn’t run out of water by 1974 as Paul Ehrlich predicted, so he switched over to the global cooling scam.
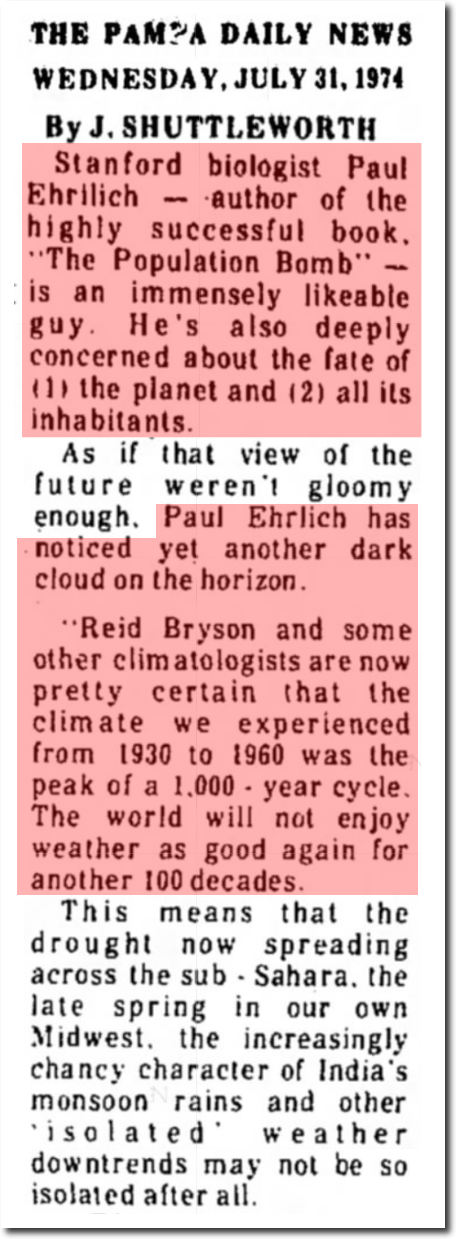
31 Jul 1974, Page 7 – Pampa Daily News at Newspapers.com
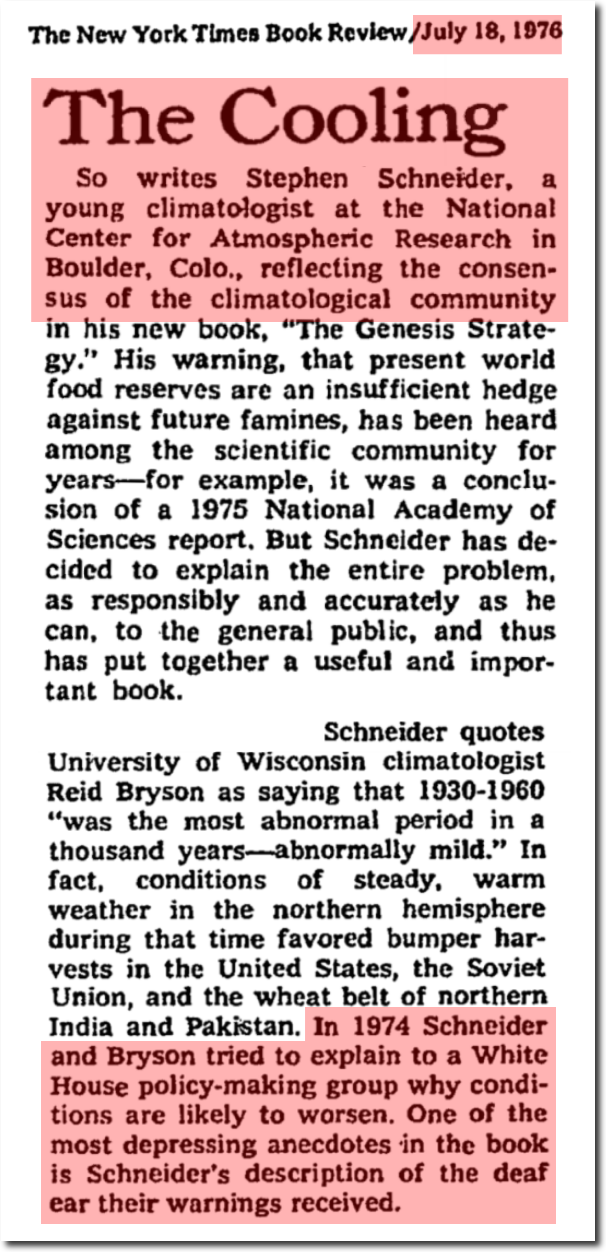
In 1974, Steven Schneider took the scientific consensus of global cooling to the White House.
climatic researchers are becoming alarmed that in the next 10 to 100 years humanity will be unable to feed itself
So writes Stephen Schneider, a young climatologist at the National Center for Atmospheric Research in Boulder, Colo., reflecting the consensus of the climatological community in his new book, “The Genesis Strategy.” His warning, that present world food reserves are an insufficient hedge against future famines, has been heard among the scientific community for years—for example, it was a conclusion of a 1975 National Academy of Sciences report. But Schneider has decided to explain the entire problem, as responsibly and accurately as he can, to the general public, and thus has put together a useful and important book.
It is a matter, as Schneider explains, of statistics. The last 15,000 years have been unusually warm when compared to global temperatures for the last 150,000. The last 200 years have been unusually warm when compared to the last 1,000. But there is considerable evidence that this warm period is passing and that temperatures on the whole will get colder. For example, in the last 100 years mid?latitude air temperatures peaked at an all?time warm point in the 1940’s and?have been cooling ever since.
In 1974 Schneider and Bryson tried to explain to a White House policy?making group why conditions are likely to worsen. One of the most depressing anecdotes in the book is Schneider’s description of the deaf ear their warnings received.
- New York Times July 18, 1976
The Genesis Strategy – The New York Times
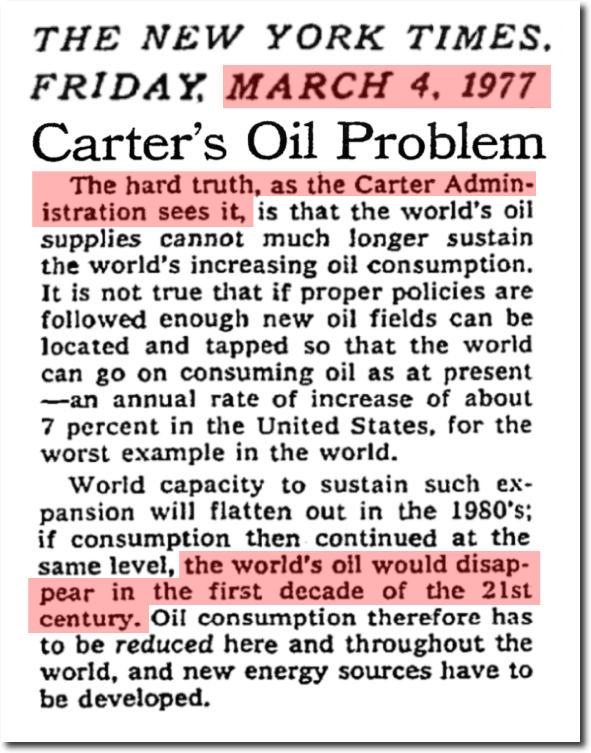
Three years later President Carter warned that we would run out of oil before 2010.
The hard truth, as the Carter Administration sees it, is that the world’s oil supplies cannot much longer sustain the world’s increasing oil consumption.
if consumption then continued at the same level, the world’s oil would disappear in the first decade of the 21st century. Oil consumption therefore has to be reduced here and throughout the world, and new energy sources have to be developed.
- New York Times March 4, 1977
Carter’s Oil Problem – The New York Times
Two years later, experts determined that nuclear reactors were going to melt through the Earth all the way to China, and that Pennsylvania would be made uninhabitable.
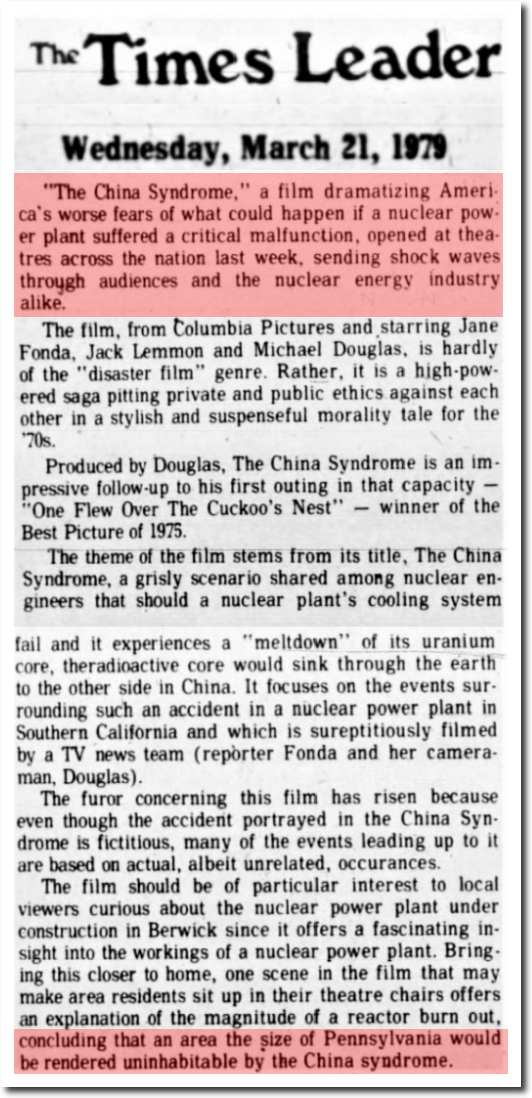
21 Mar 1979, 4 – The Times Leader at Newspapers.com
That didn’t happen, so a year later “frightened” experts decided that acid rain was going to make Pennsylvania uninhabitable, and all they needed was $100 million dollars to fix it.
“Acid rain …… It’s a lot worse than we thought”
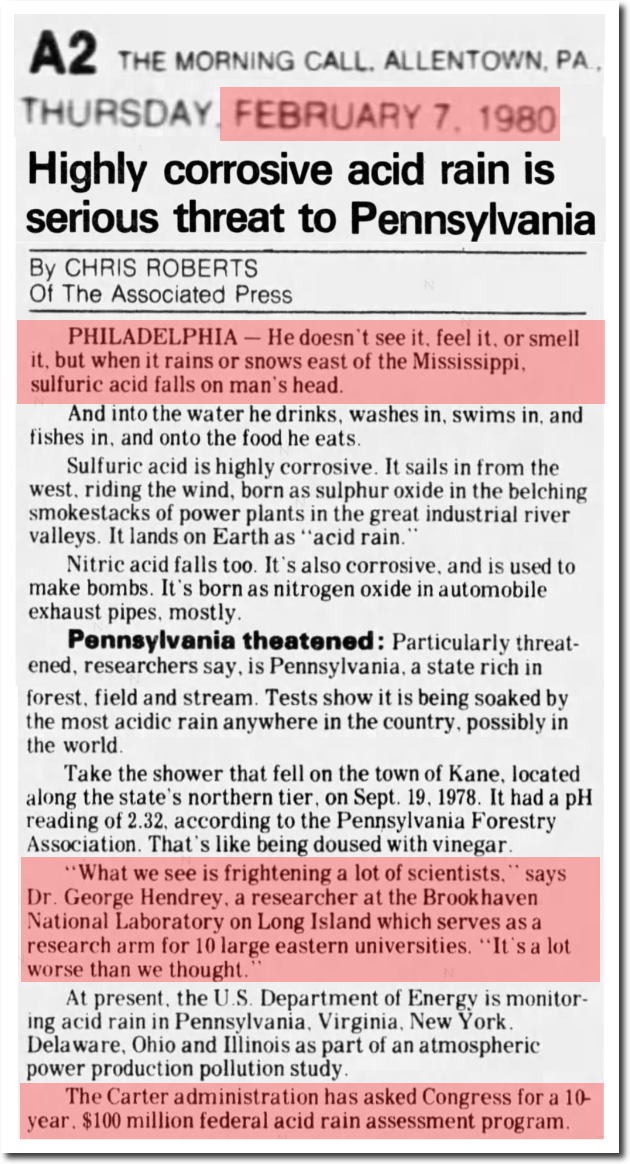
07 Feb 1980, 2 – The Morning Call at Newspapers.com
What stands out for me is the $100 million. Scientists now expect $billions for their scams.
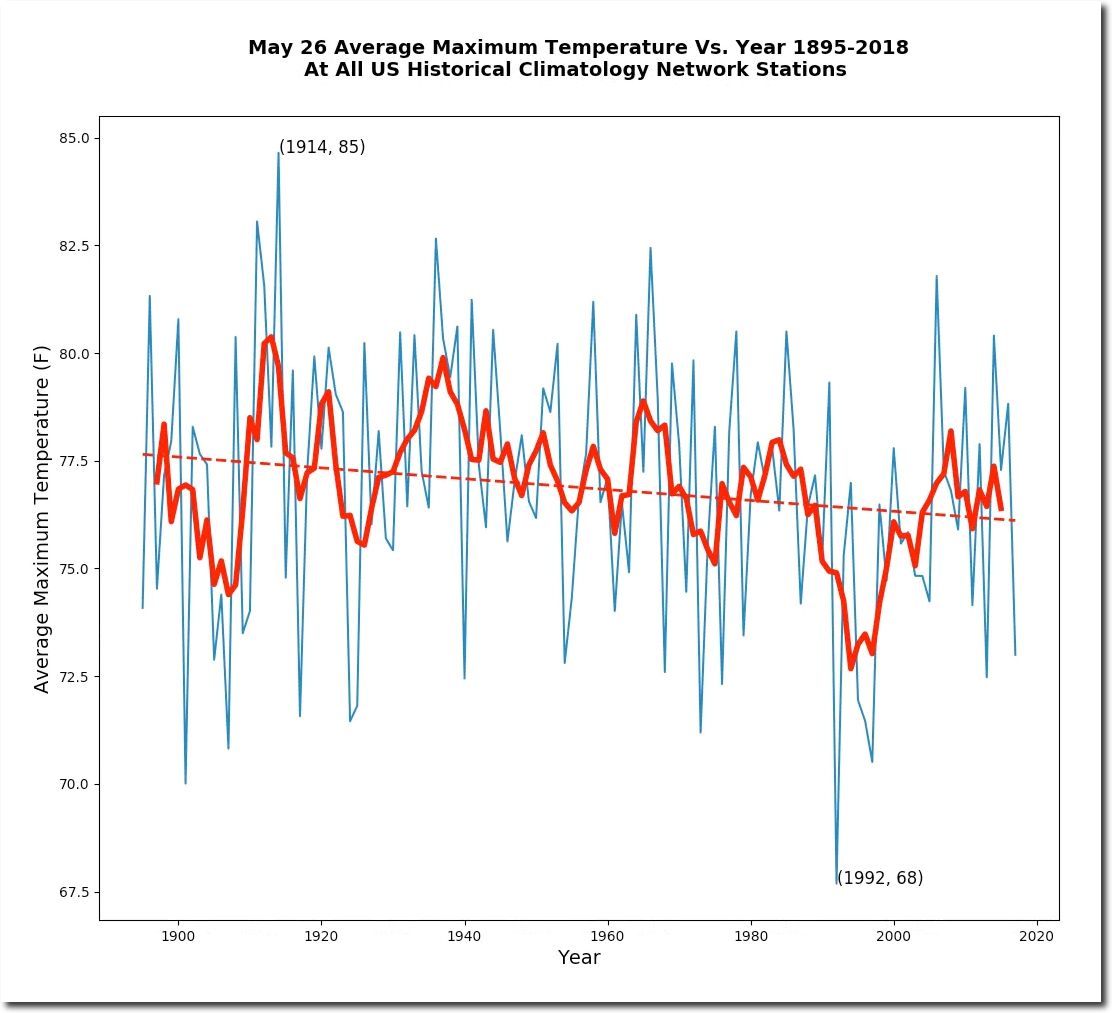
May 26 temperatures in the US have declined sharply since about 1910.

On this date in 1911, almost the entire eastern US was over 90 degrees.
Similar story in 1914, with 90 degree weather up into Vermont.


