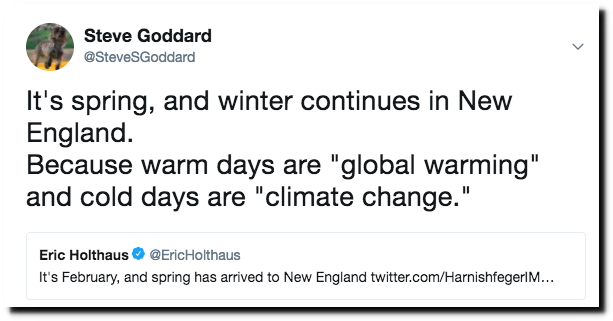
Spring has gone missing.
And the bird is angry.

Spring has gone missing.
And the bird is angry.
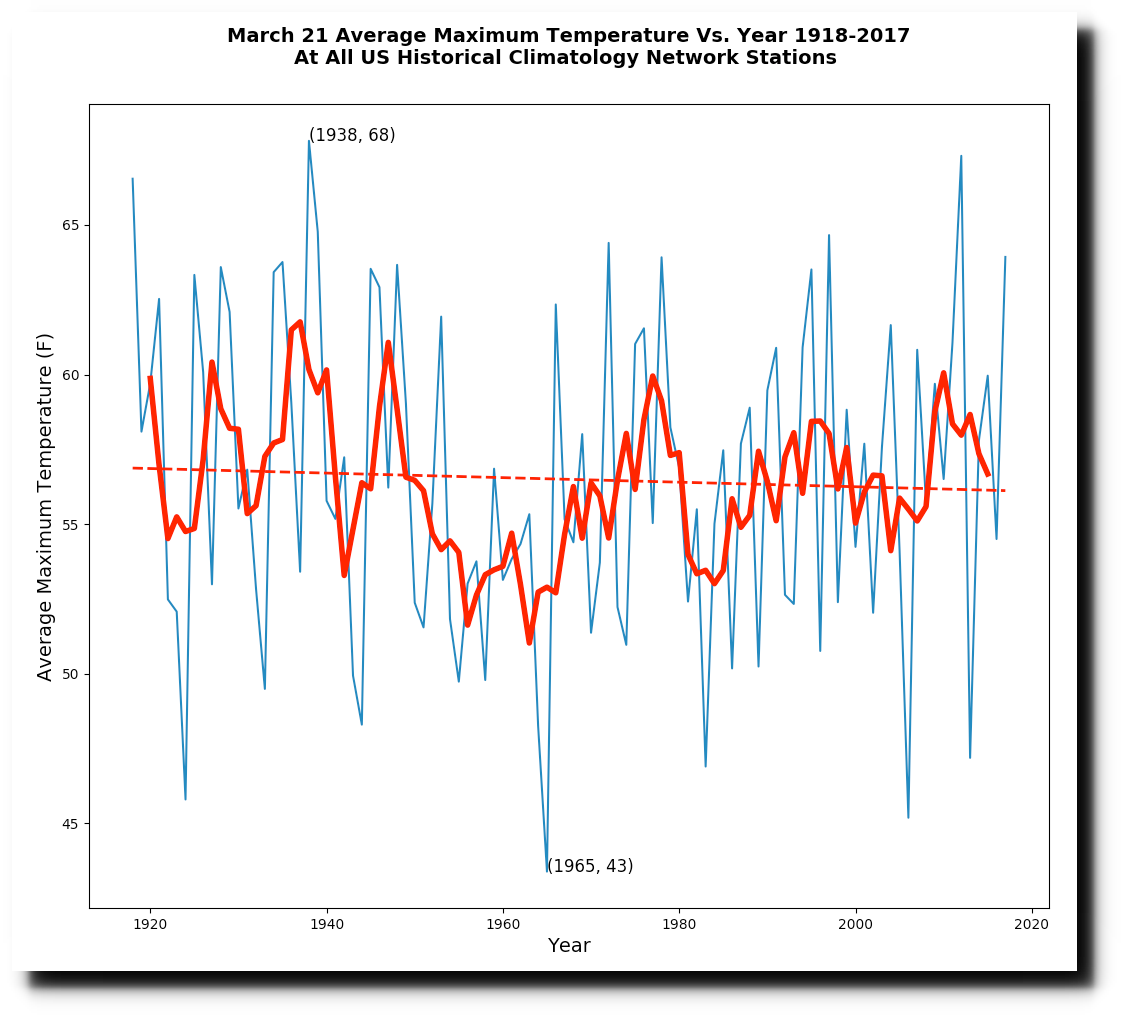
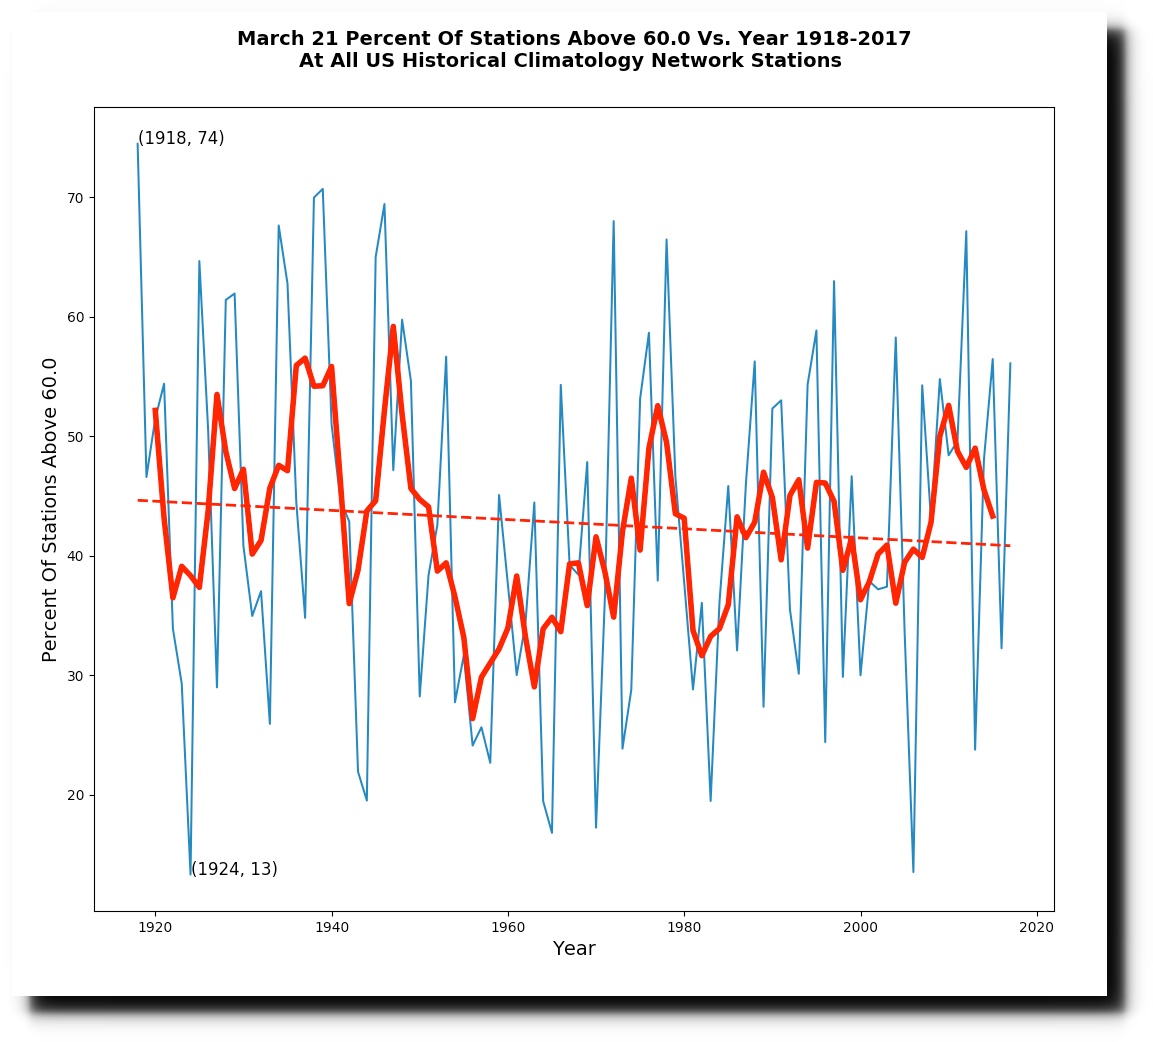
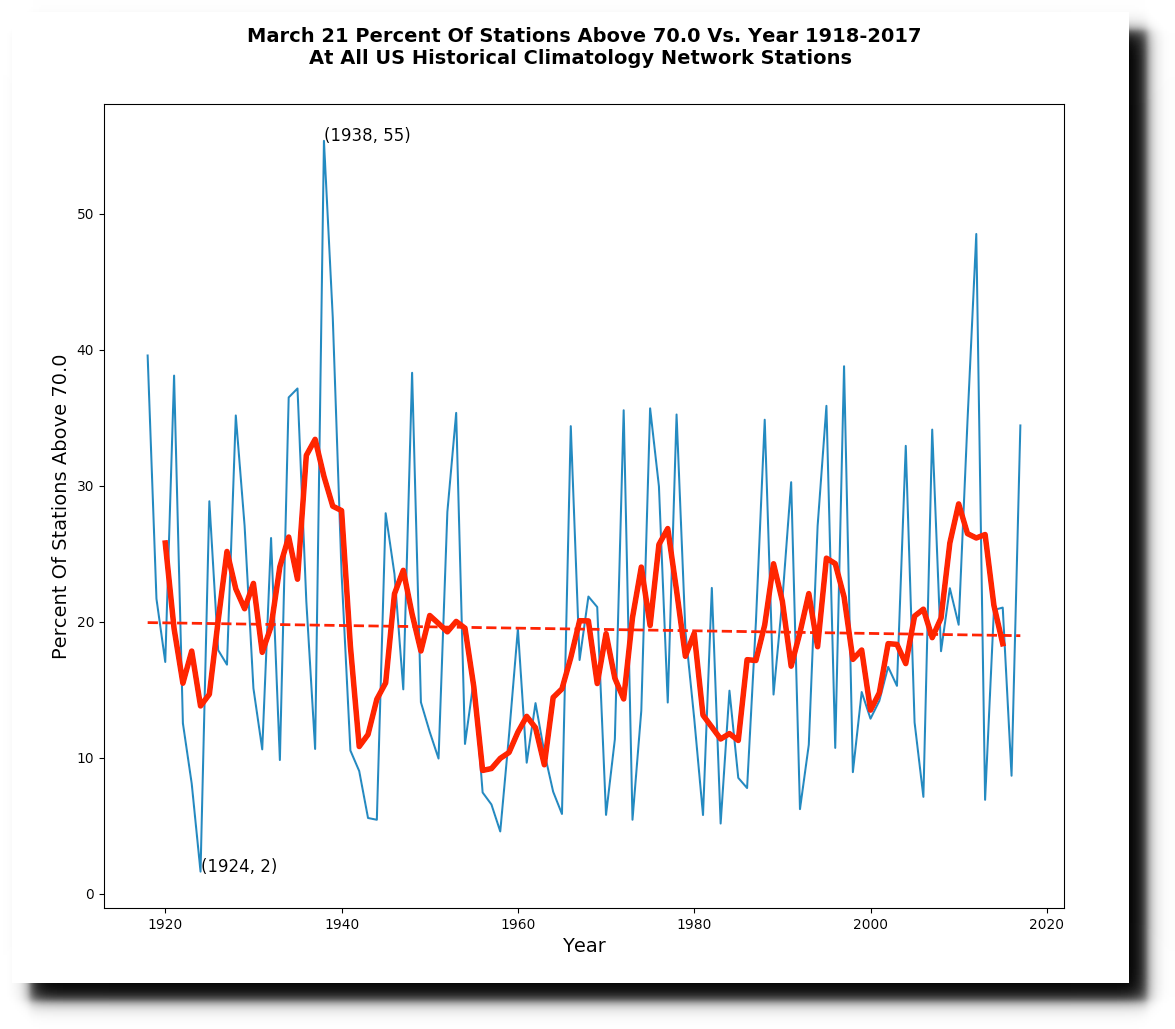
We are having a blizzard on the East Coast and same in the California mountains, but March 21 wasn’t always cold like this. March 21 temperatures were generally much warmer prior to the 1950’s.
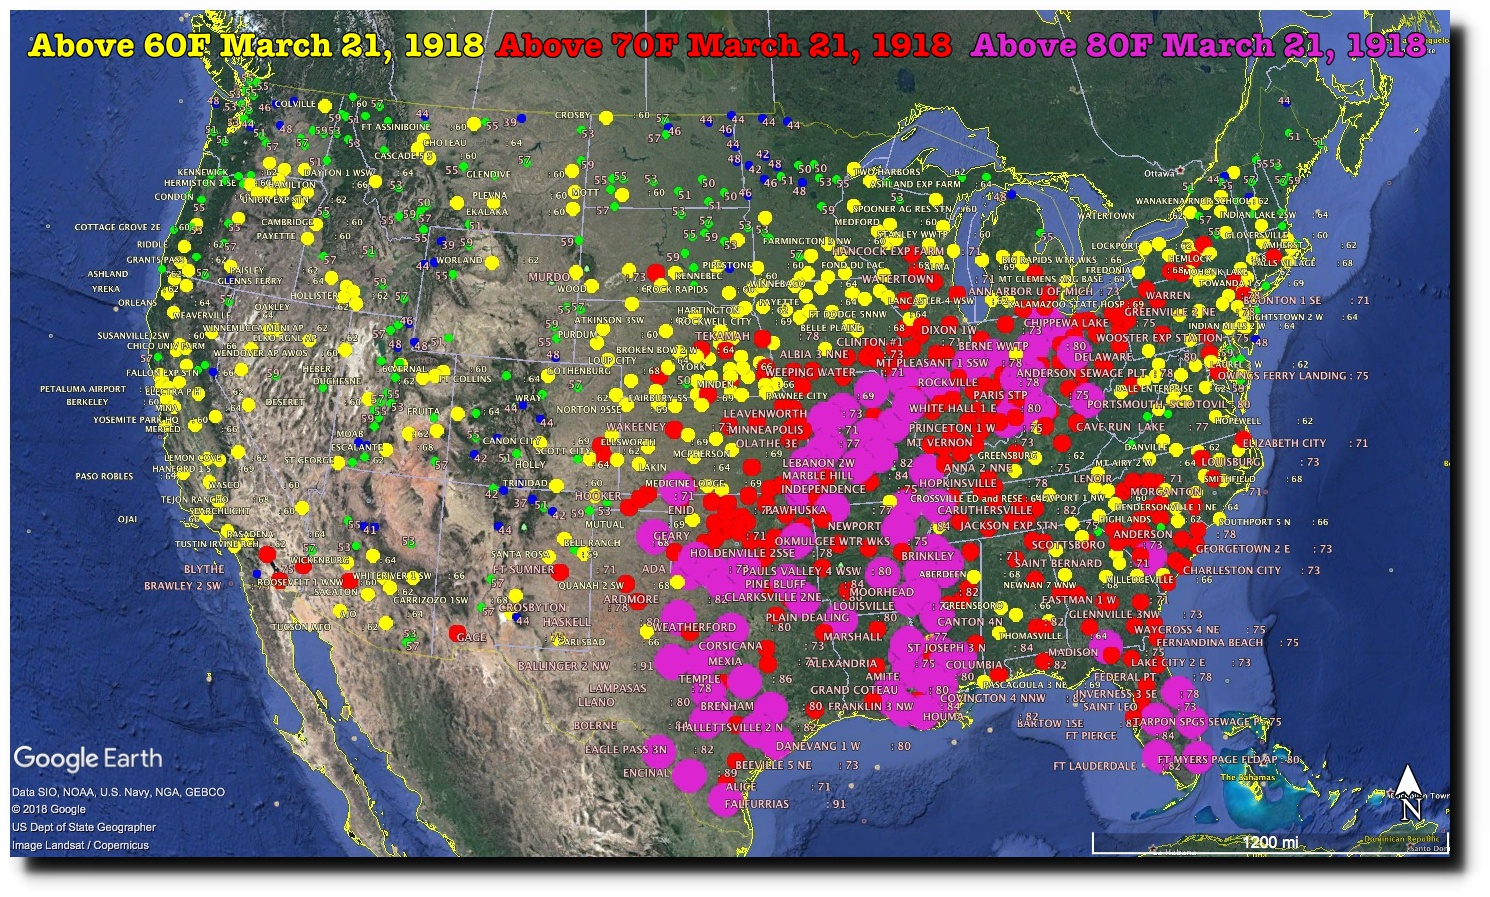
On hundred years ago today, almost three fourths of the US was above 60F.
On this date 80 years ago, more than half of the US was over 70F.
On this date in 1921, it was hot in Boston and one person died from the heat.
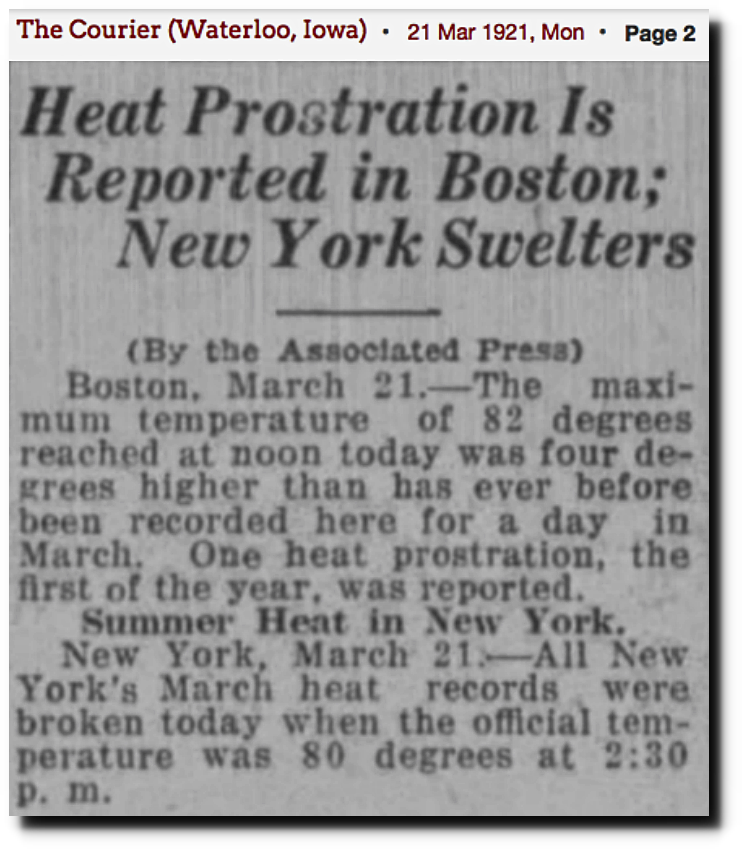
21 Mar 1921, 2 – The Courier at Newspapers.com
It is freezing cold here in Philadelphia and snowing, and has been all month. But it wan’t always cold like this. There were many years (when atmospheric CO2 was lower) during which March 21 was a very warm day.


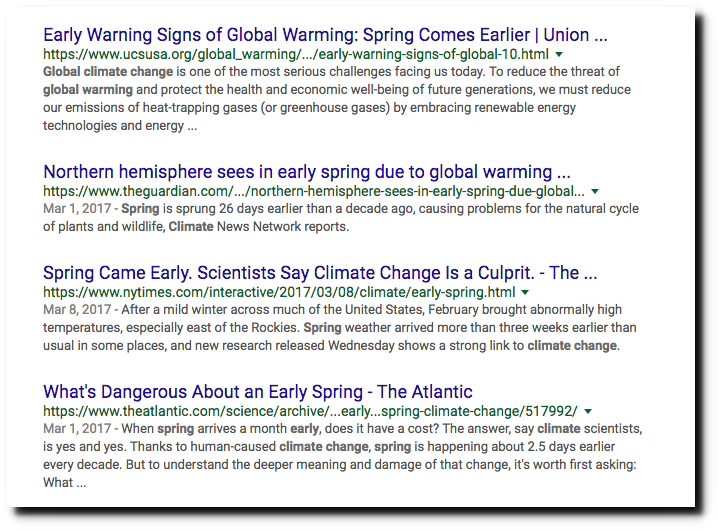
Climate experts claim that spring is arriving earlier due to global warming, but like with everything else they say – they have no idea what they are talking about.
Washington DC cherry trees are blooming about two days later than they did 30 years ago, when CO2 was below 350 PPM.
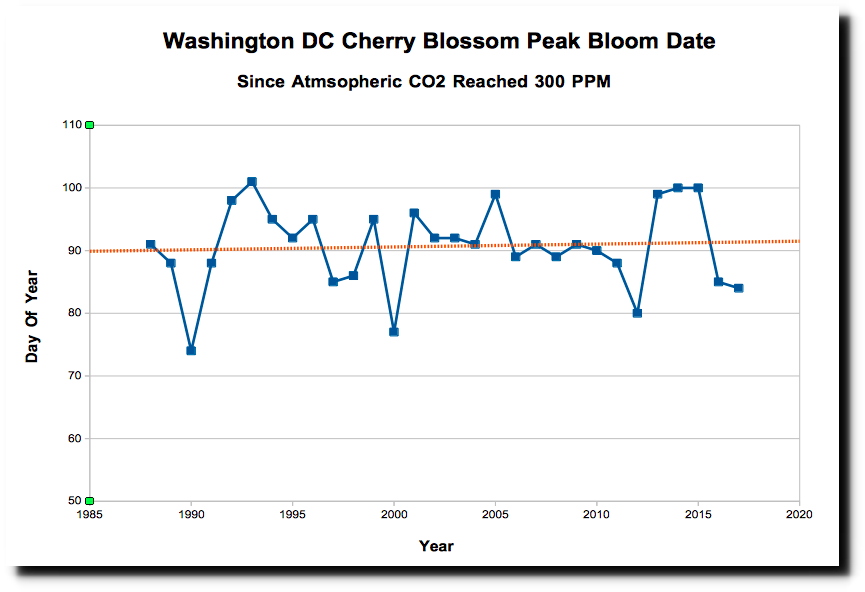
https://www.epa.gov/sites/production/files/2016-08/cherry-blossoms_fig-1.csv
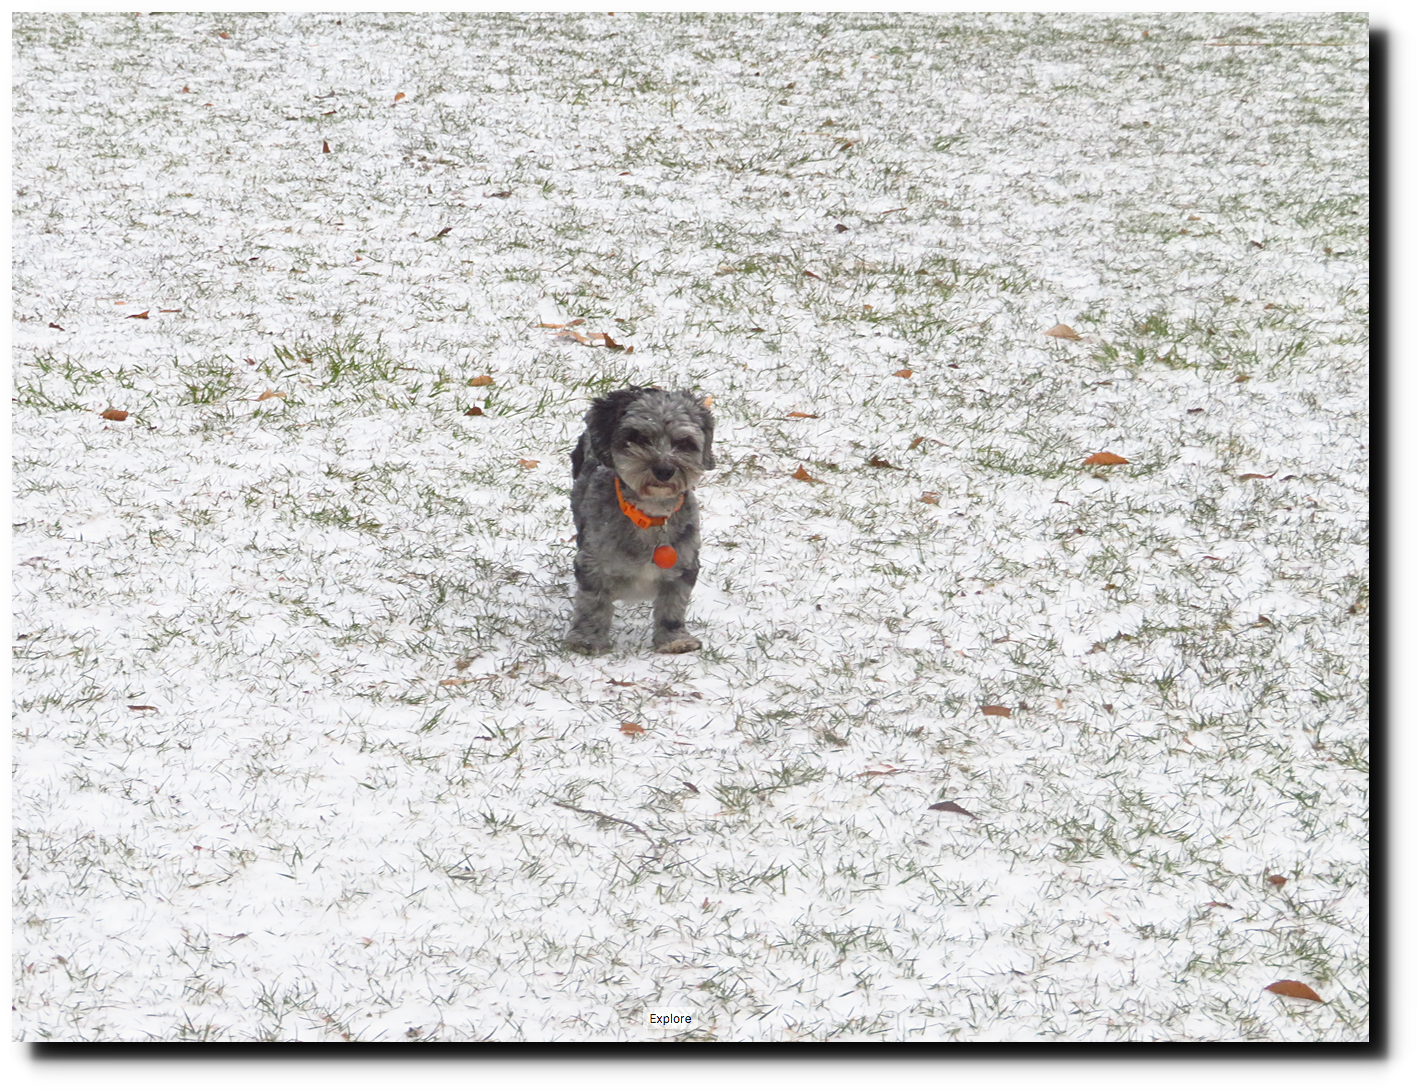
This is Toto’s fourth global warming research project in the past three weeks. He is expecting another foot of global warming today.
President Eisenhower was a real prophet. He predicted that government money would corrupt science, and that corrupted science would corrupt public policy.
“a government contract becomes virtually a substitute for intellectual curiosity. For every old blackboard there are now hundreds of new electronic computers ….. the prospect of domination of the nation’s scholars by Federal employment, project allocations, and the power of money is ever present – and is gravely to be regarded … public policy could itself become the captive of a scientific-technological elite”
– Dwight Eisenhower 1960
Fake prophet James Hansen is one of the people he warned us about.
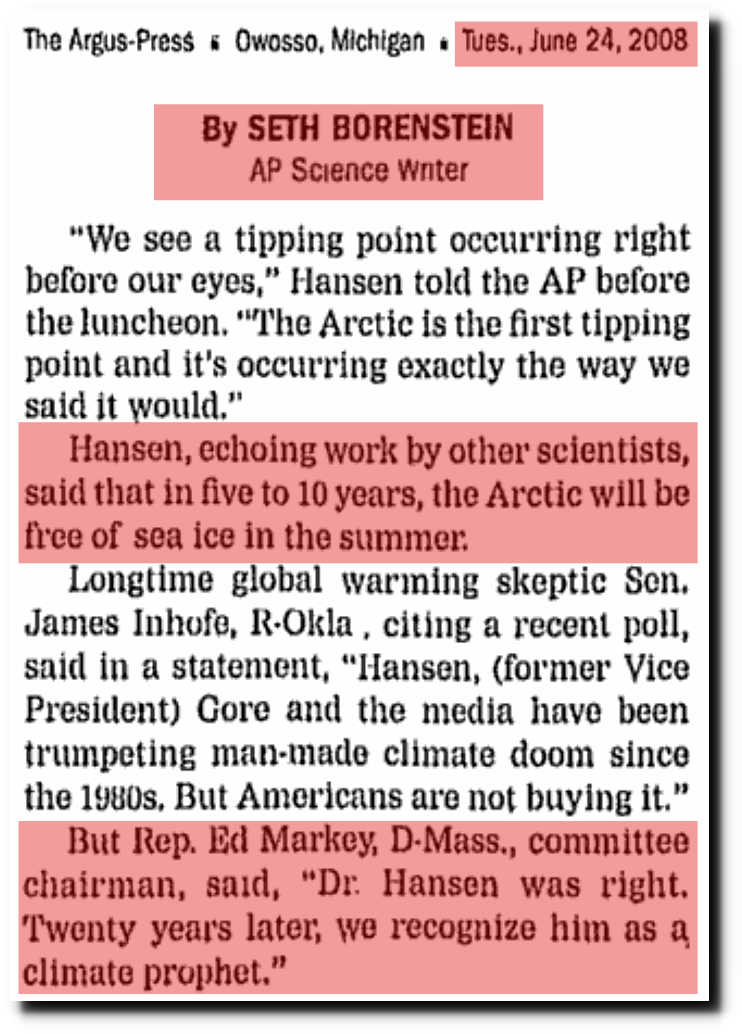
The Argus-Press – Google News Archive Search
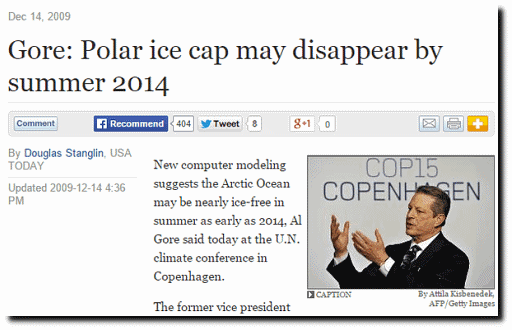
As was Nobel Laureate Al Gore.
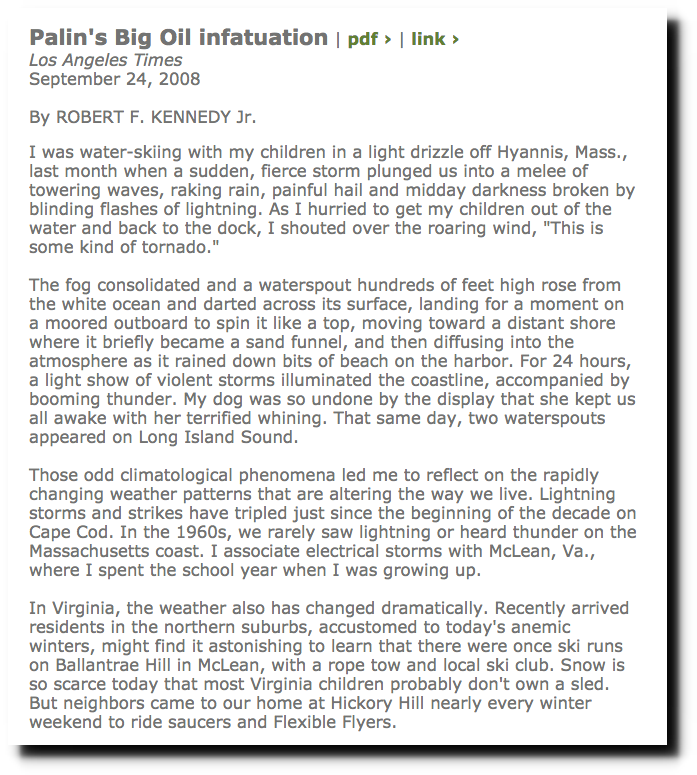
Snow is so scarce today that most Virginia children probably don’t own a sled.
- RFK Junior, 2008
Ten years ago, Robert Kennedy Junior said the lack of of snow in McClean, Virginia is due to global warming, and said that it was Sarah Palin’s fault.
McClean is expecting another foot of snow to bring in the Spring.
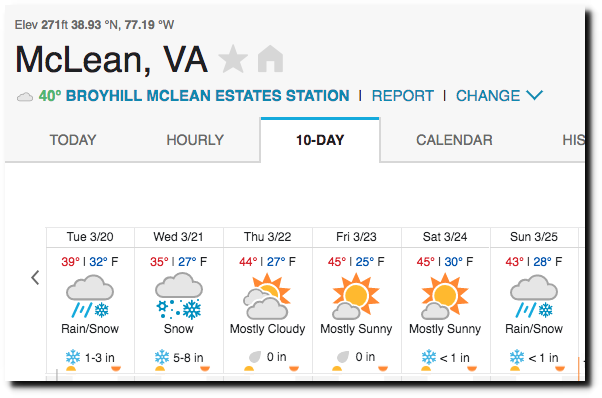
McLean, VA 10-Day Forecast | Weather Underground
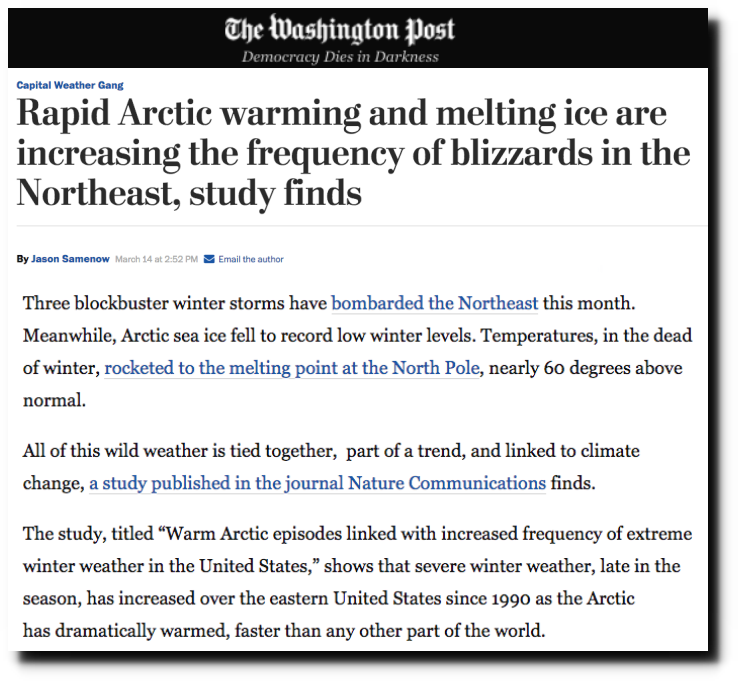
The Washington Post now says that all the snow they are having is caused by global warming.
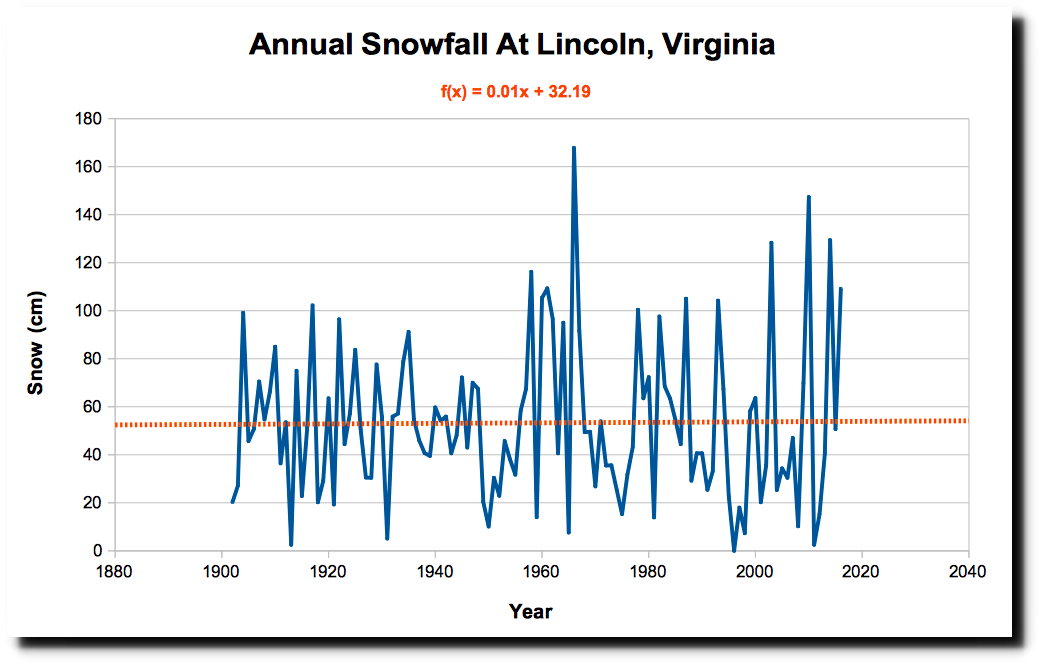
There has been no trend in snowfall since the year 1900 at the closest USHCN station to McClean, and four of their ten snowiest winters have occurred since the year 2000.
Everything climate alarmists believe is based on superstition, and they change their story as the weather changes. But just like the 16th century, they still blame weather they don’t like on witches.
We are expecting a foot of snow the next couple of days in Philadelphia, but on this date in 1921, about half of the US was over 80 degrees.

The heat then moved east and brought record warmth to the East Coast.
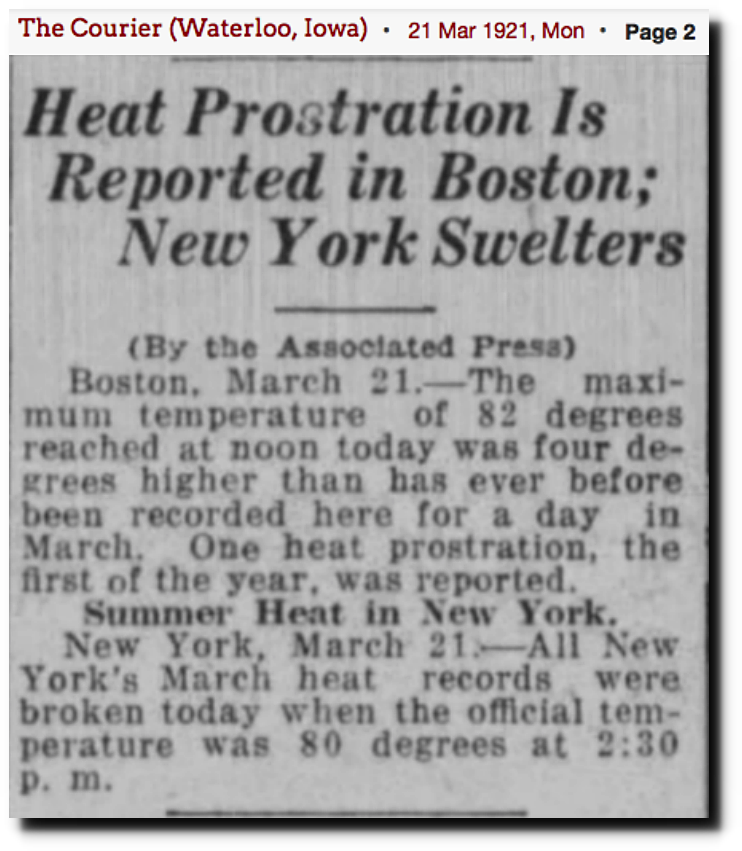
21 Mar 1921, 2 – The Courier at Newspapers.com
The warmth remained most of the year, and 1921 was the second warmest year on record in the US, after 1934.
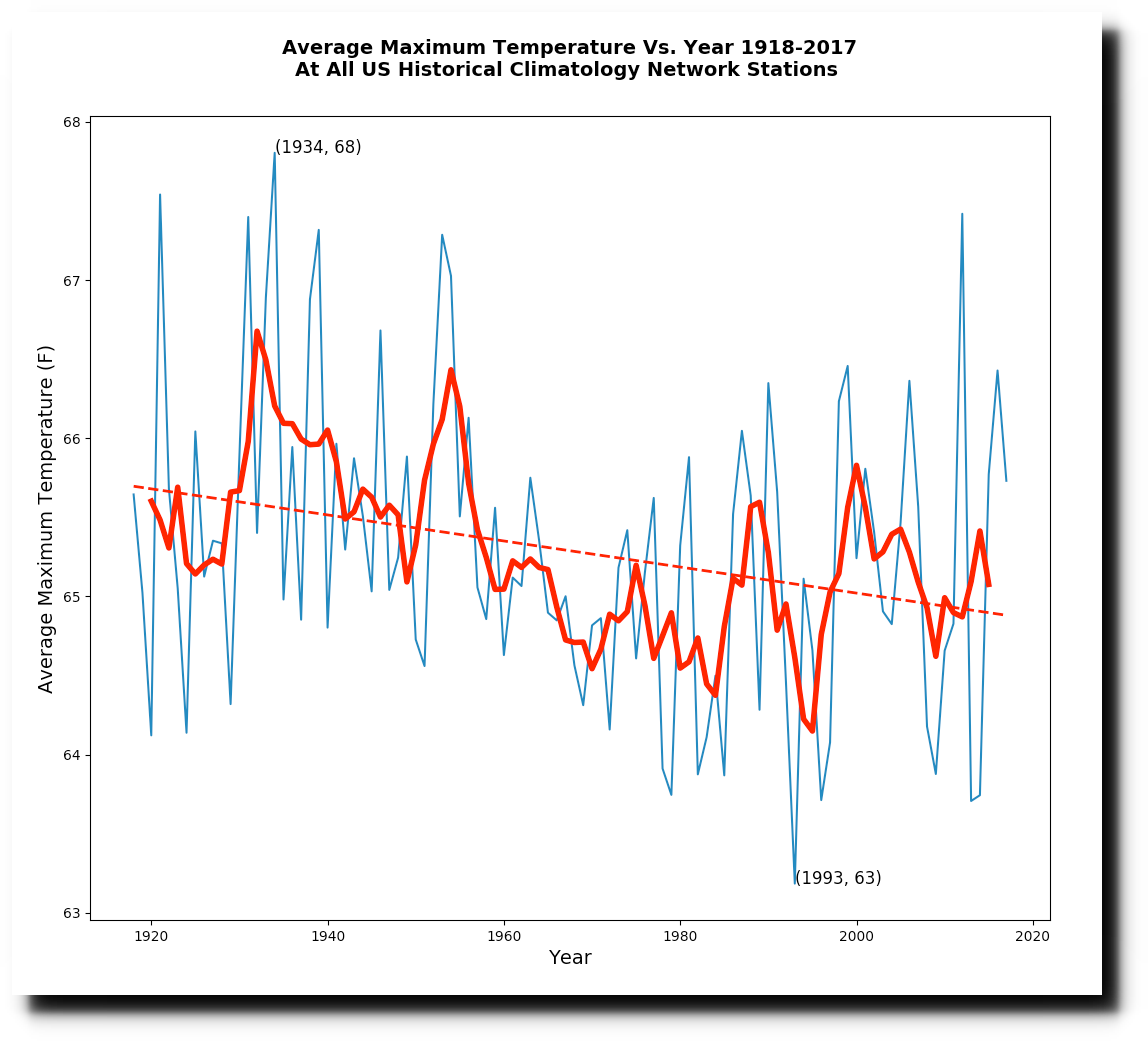
1921 was the only year where more than two thirds of days were above 60F in the United States.
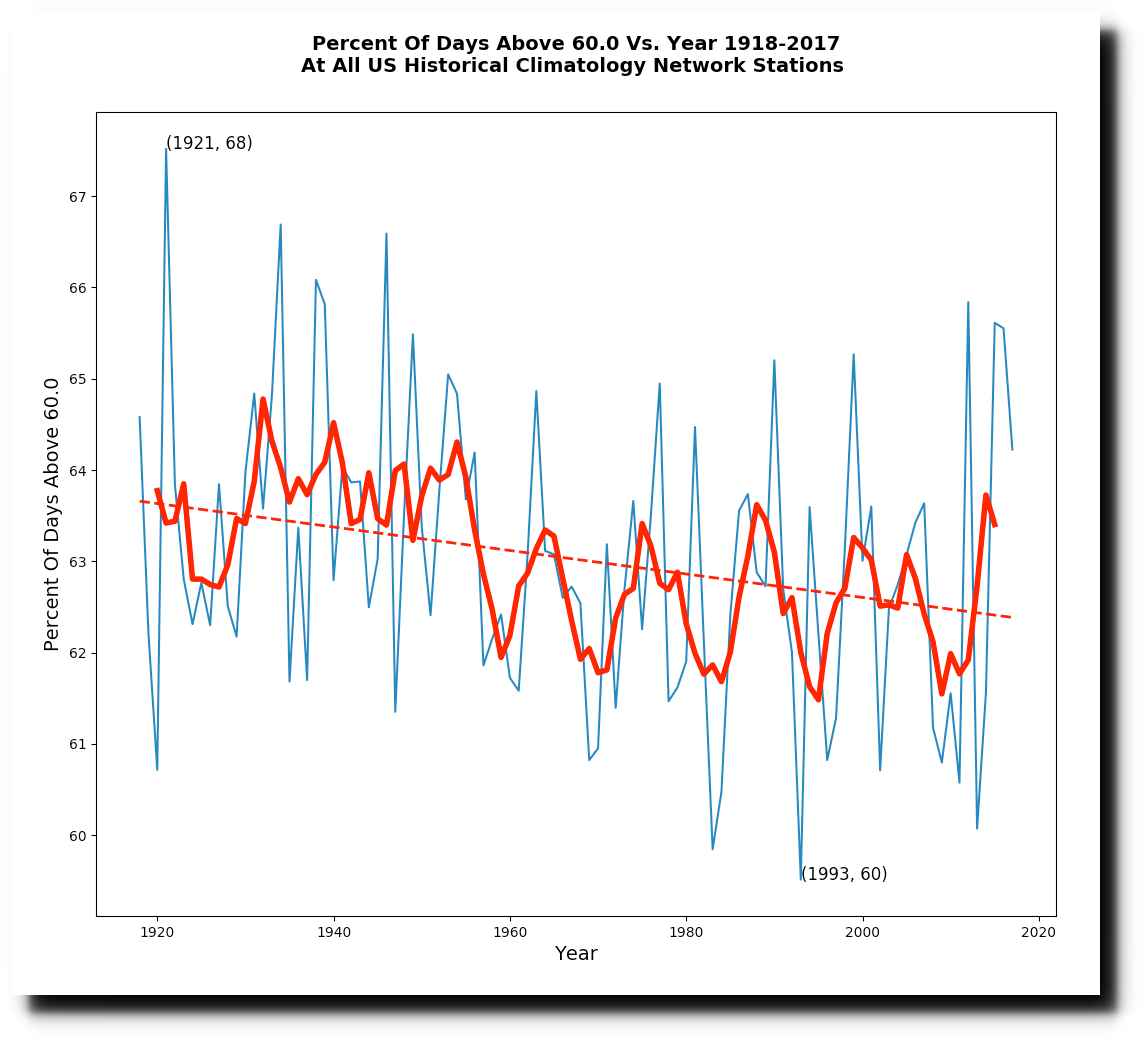
1921 had the second highest percent of days over 70F.

1921 had the fourth highest percentage of days above 80F
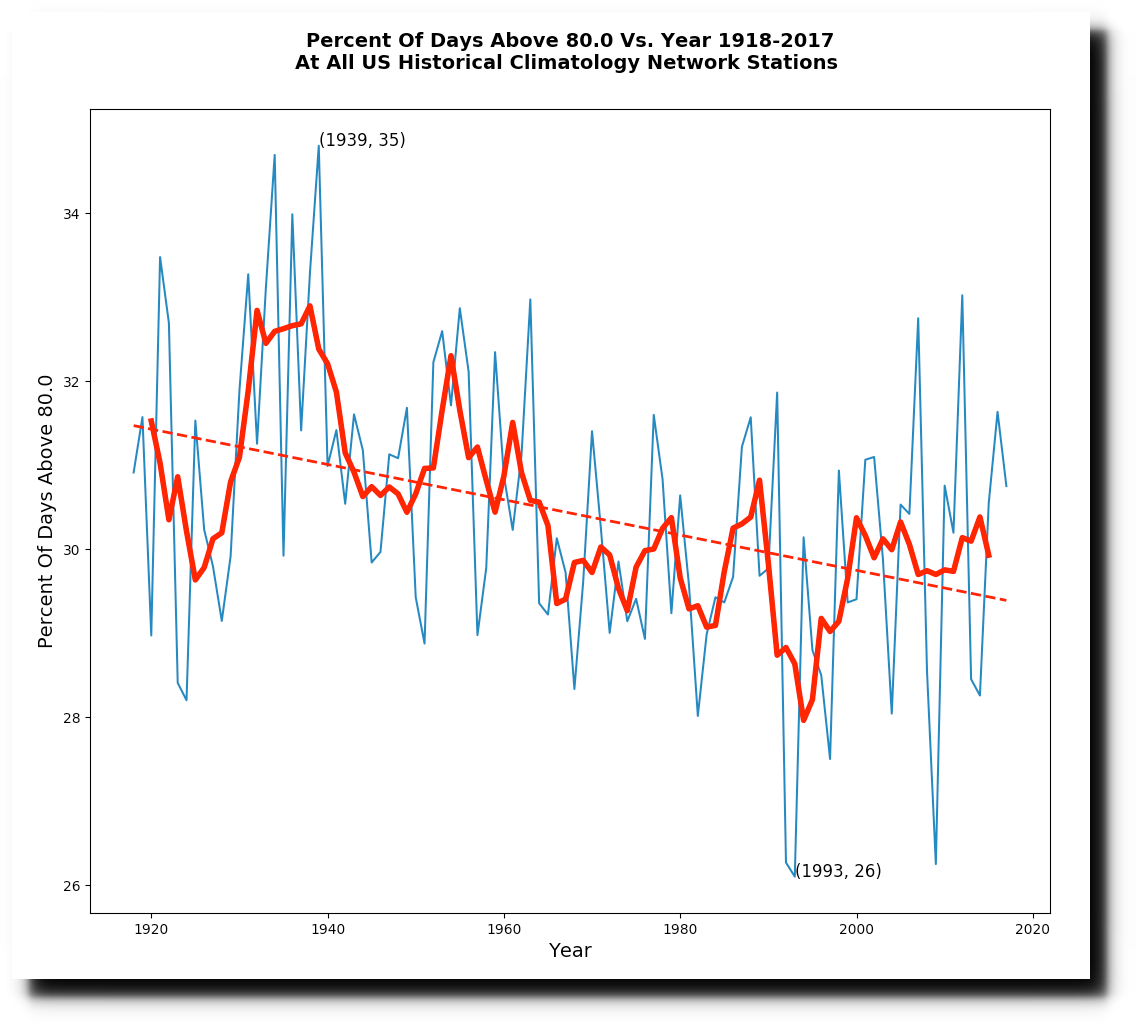
The frequency of 90 degree days in 1921 was well above average, but less spectacular.
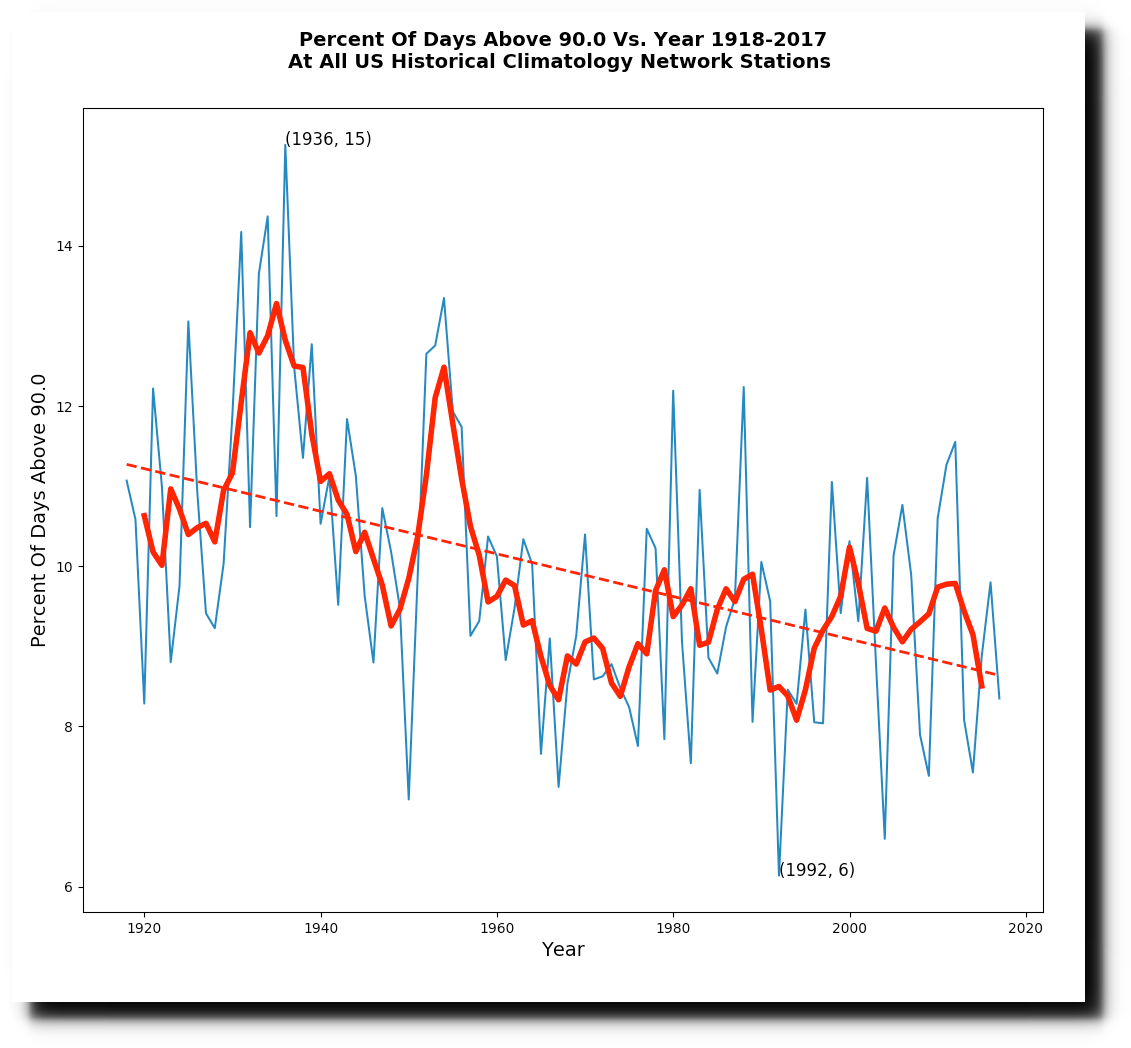
The frequency of below 20F nights was fifth lowest on record in 1921.
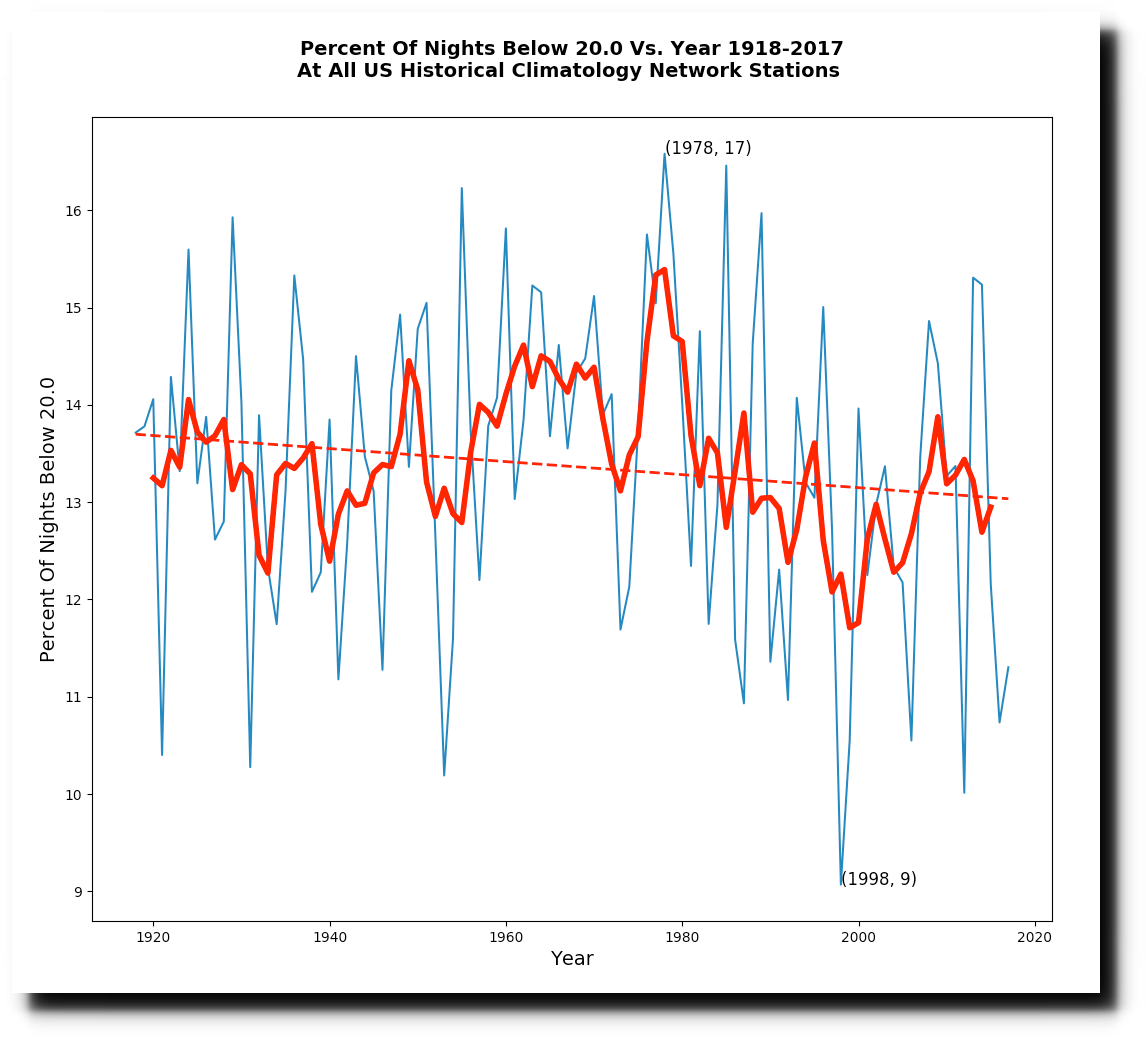
The interesting thing about 1921, is that it wasn’t extremely hot like 1931, 1933, 1934, 1936 or 1954 – but the weather was very warm throughout the year. CO2 was barely above 300 PPM at the time.
NOAA’s US temperature record shows that US was warmest in the 1930’s and has generally cooled as CO2 has increased. This wrecks greenhouse gas theory, so they “adjust” the data to make it look like the US is warming.
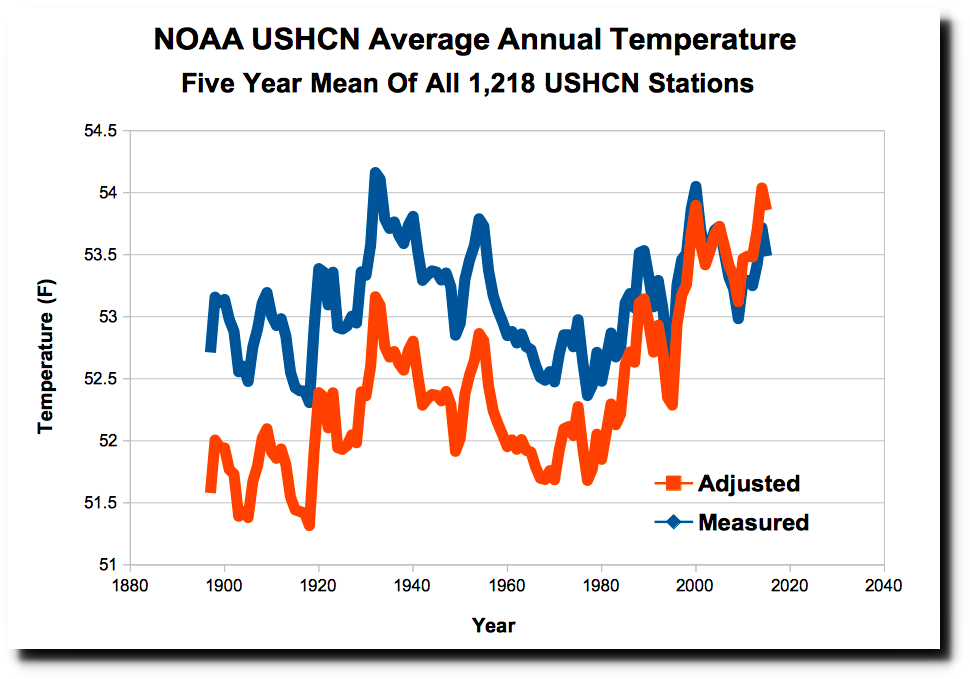
Raw NOAA Data Adjusted NOAA Data
The NOAA data tampering produces a spectacular hockey stick of scientific fraud, which becomes the basis of vast amounts of downstream junk climate science. Pre-2000 temperatures are progressively cooled, and post-2000 temperatures are warmed. This year has been a particularly spectacular episode of data tampering by NOAA, as they introduce nearly 2.5 degrees of fake warming since 1895.
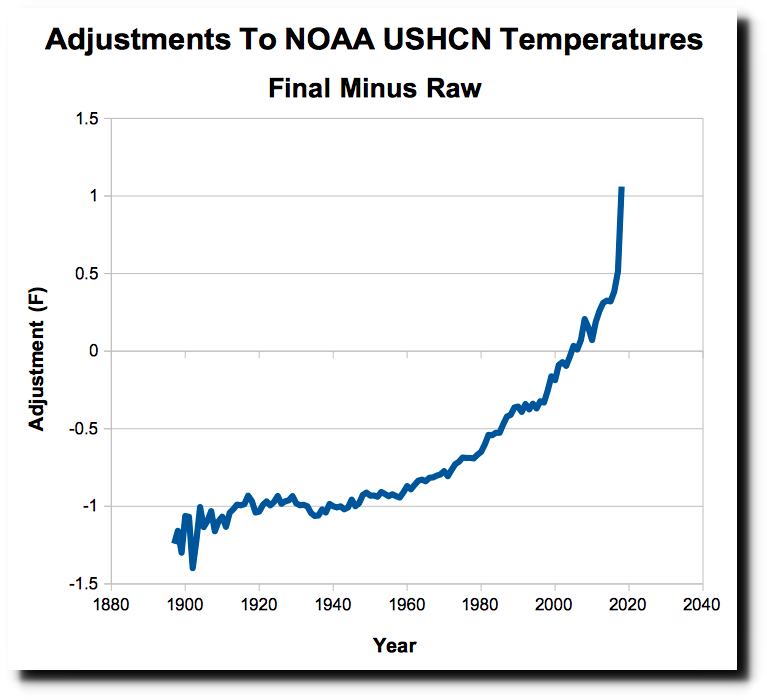
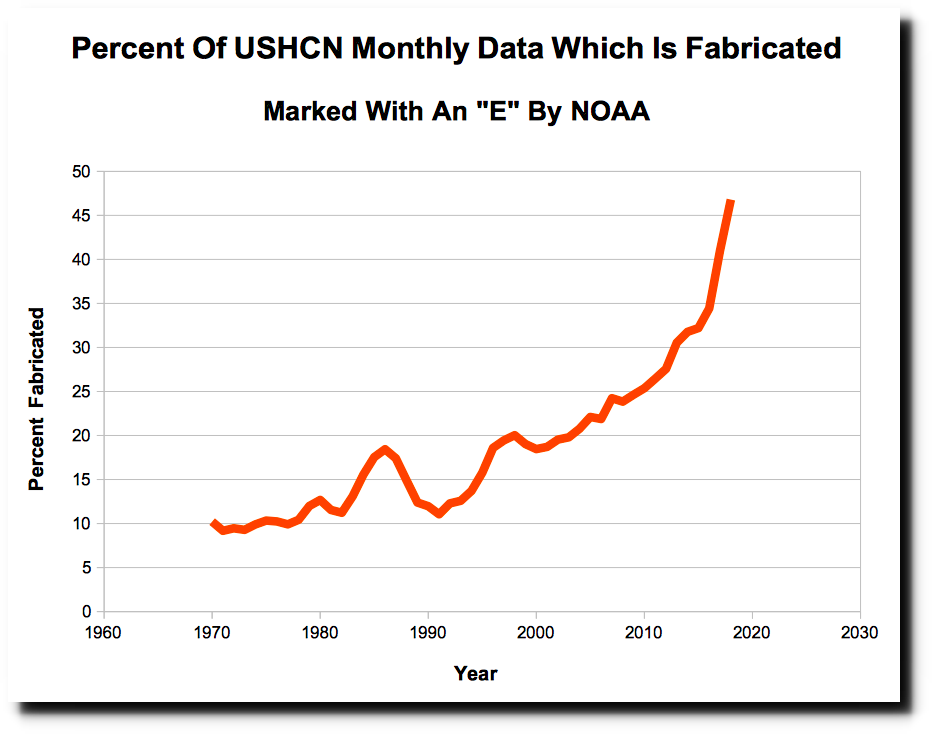
Most of these adjustments are due to simply making up data. Every month, a certain percentage of the 1,218 United States Historical Climatology Network (USHCN) stations fail to report their data, and the temperature gets estimated by NOAA using a computer model. Missing data is marked in the USHCN database with an “E” – meaning “estimated.” In 1970, about 10% of the data was missing, but that number has increased to almost 50%, meaning that almost half of the current adjusted data is fake.
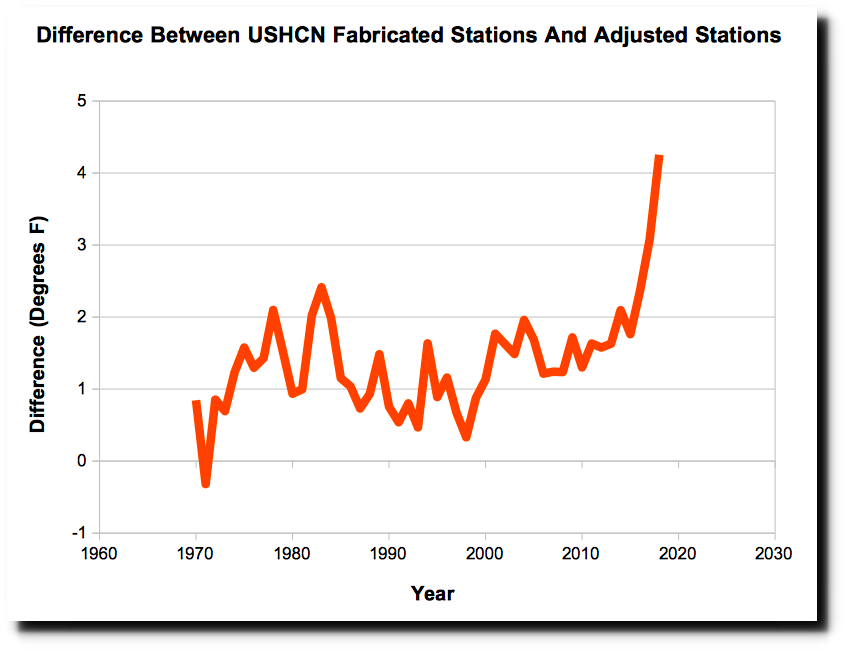
The fabricated temperatures have warmed four degrees since 1970, relative to the adjusted temperatures which were based on actual station data. This shows that the warming trend in the US claimed by NOAA is based on computer models, not actual thermometer data or even adjusted thermometer data.
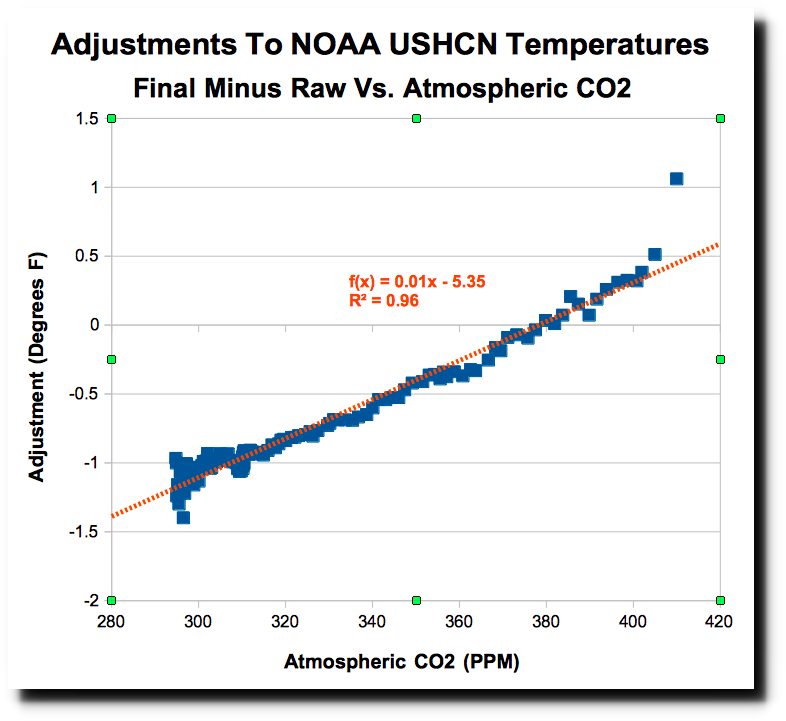
But here is the real smoking gun of fraud by NOAA. The adjustments being made almost perfectly match atmospheric CO2 levels – showing that the data is being altered precisely to match global warming theory.
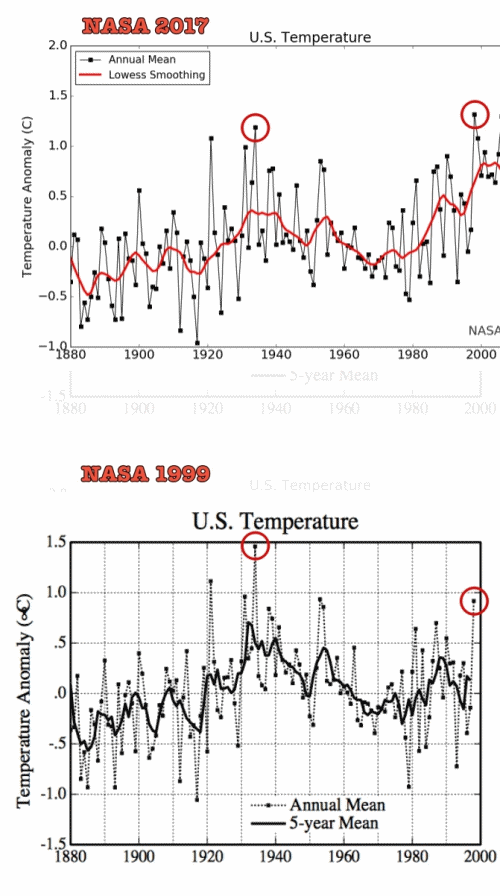
Science doesn’t get any worse than how NOAA handles US temperature data. NASA uses the NOAA data as the basis for their temperature graphs, which have also been massively altered to turn cooling into warming.
For the second year in a row, Greenland’s surface is gaining well above normal amounts of ice.
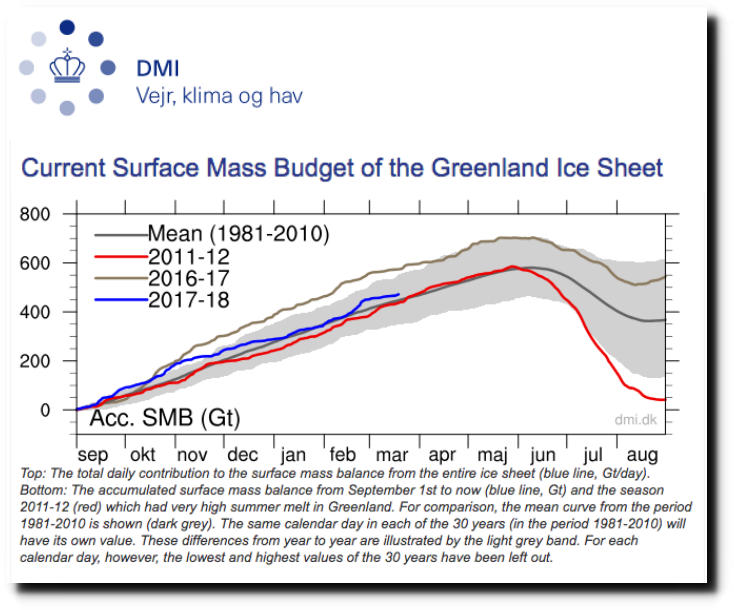
Greenland Ice Sheet Surface Mass Budget: DMI
Meanwhile, the propaganda organization known as the “Voice of America” is claiming that Greenland is melting down.
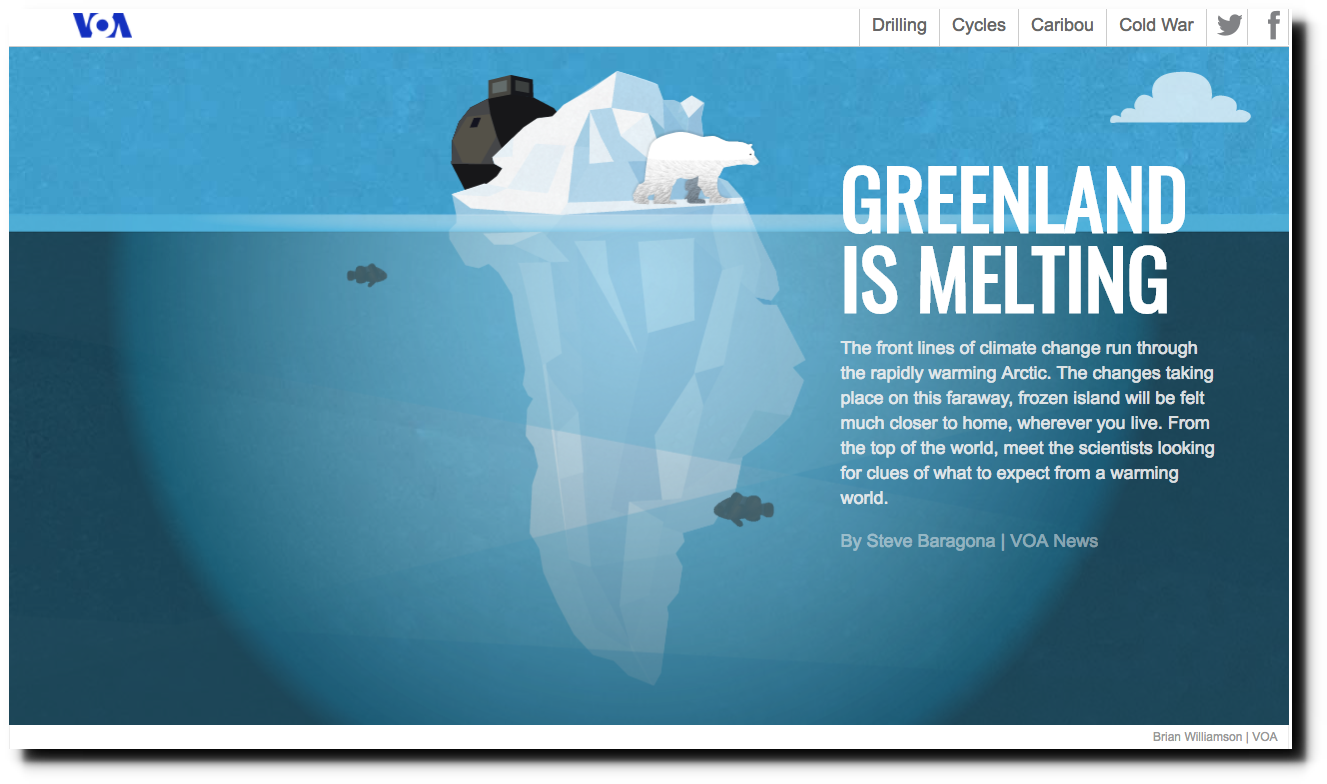
Greenland is melting | VOA Special Report
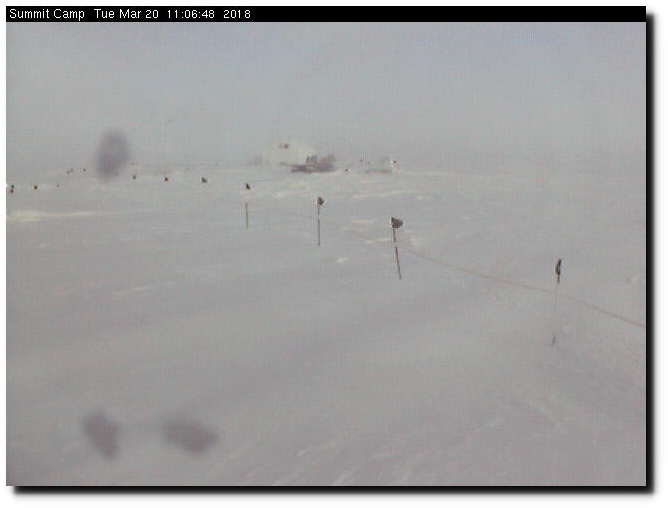
This is what the Greenland Country Club looks like this morning at -22C. The warmest temperature they have had for months.
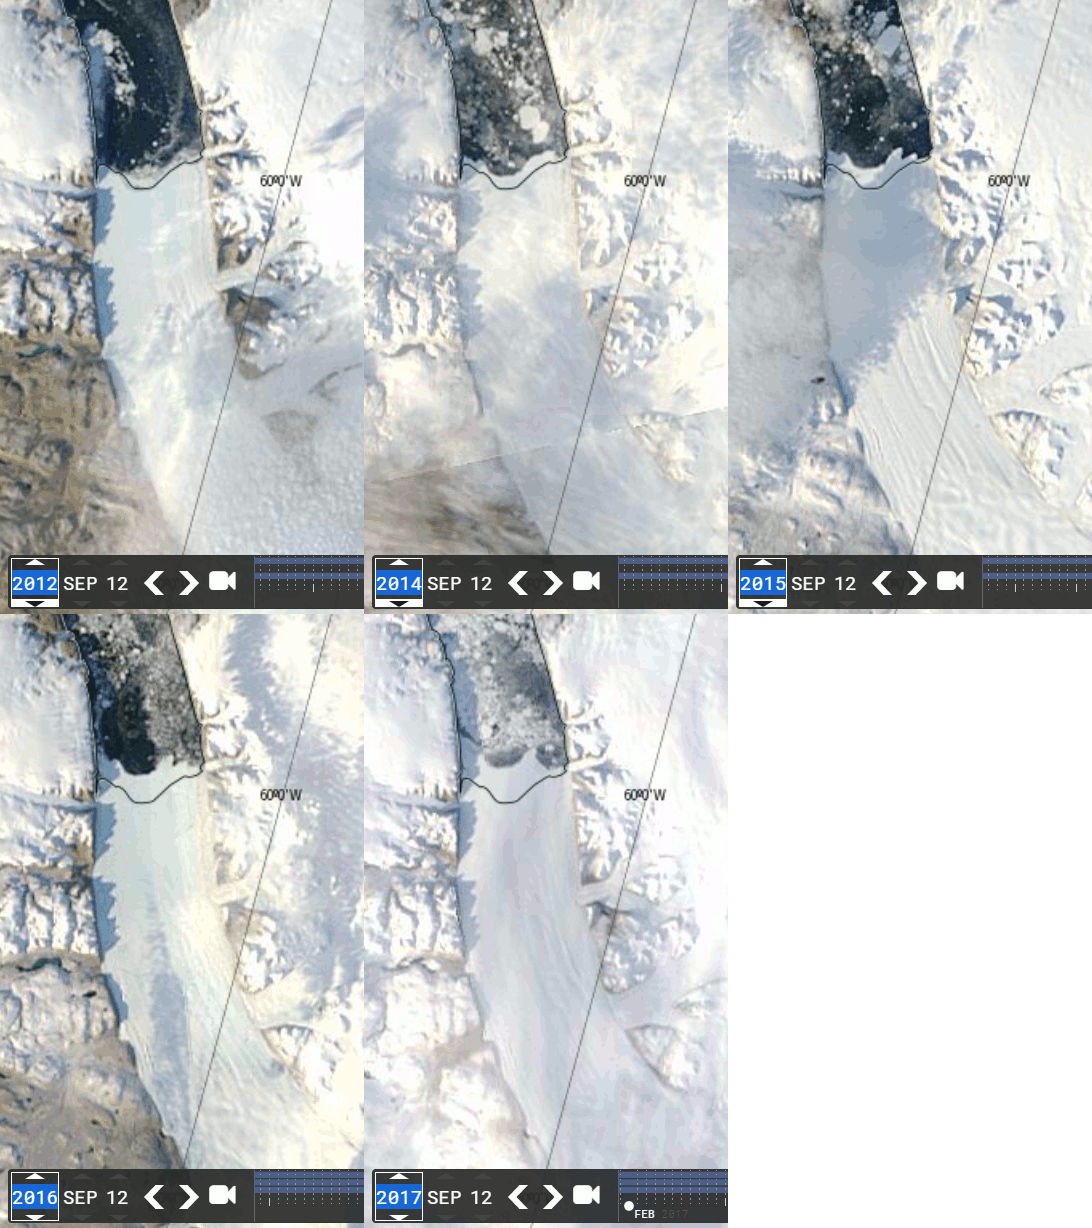
Greenland’s most famous glacier, the Petermann Glacier, has grown about 10 feet per day over the past six years.
Facts and data have no meaning to climate alarmists. They have an agenda, and nothing else matters.
You could put half of Trump’s supporters into what I call the basket of deplorables. Right? The racist, sexist, homophobic, xenophobic, Islamaphobic—you name it.
- Hillary Clinton
Hillary now says Trump supporters are like a virus. Her supporters are wealthy and dynamic (unlike the poor, lazy slugs who support the President) and that America will never be Great Again.

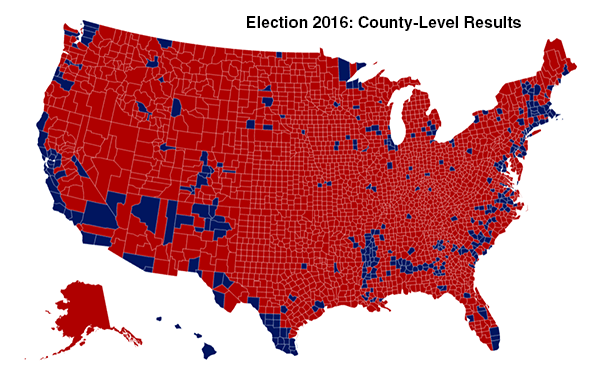
Now, having said all this, WHY AREN’T I FIFTY POINTS AHEAD YOU MIGHT ASK?