Disrupting the Borg is expensive and time consuming!
Google Search
-
Recent Posts
- Three Years Since The Apocalypse
- Arctic Report card Summer 2026
- Elon Pushing Pushing Geoengineering
- Earth, Wind And Fire
- On The Road Again
- Vandalism At The Reflecting Pool
- Fifty Years Ago Today
- Truth Or Consequences
- US Climate Trend Maps
- Declining Spring Snow Cover In Northern New Mexico
- You Can’t Fool Mother Nature
- Cattle And The Climate
- One Atomic Bomb Per Hour
- New Video : Analyzing Oil And Gas
- Is Antarctica Melting?
- High Speed Analysis And Visualization
- El Nino To The Rescue?
- Fake News Update
- Growth Of Antarctic Sea Ice
- 65 Years Of Progress!
- El Nino To The Rescue?
- Worst March Drought On Record
- ChartGL Process Control Demo
- The Biggest Money Laundering Scam
- Drought In The Headwaters Of Lake Powell
September 2026 M T W T F S S 1 2 3 4 5 6 7 8 9 10 11 12 13 14 15 16 17 18 19 20 21 22 23 24 25 26 27 28 29 30 Recent Comments
- Gordon Vigurs on Three Years Since The Apocalypse
- Denis Rushworth on Three Years Since The Apocalypse
- conrad ziefle on Earth, Wind And Fire
- Crispin Pemberton-Pigott on Three Years Since The Apocalypse
- Robertvd on Arctic Report card Summer 2026
- conrad ziefle on Three Years Since The Apocalypse
- Terry Shipman on Arctic Report card Summer 2026
- D. Boss on Arctic Report card Summer 2026
- Gordon Vigurs on Three Years Since The Apocalypse
1921 – Second Warmest Year On Record In The US
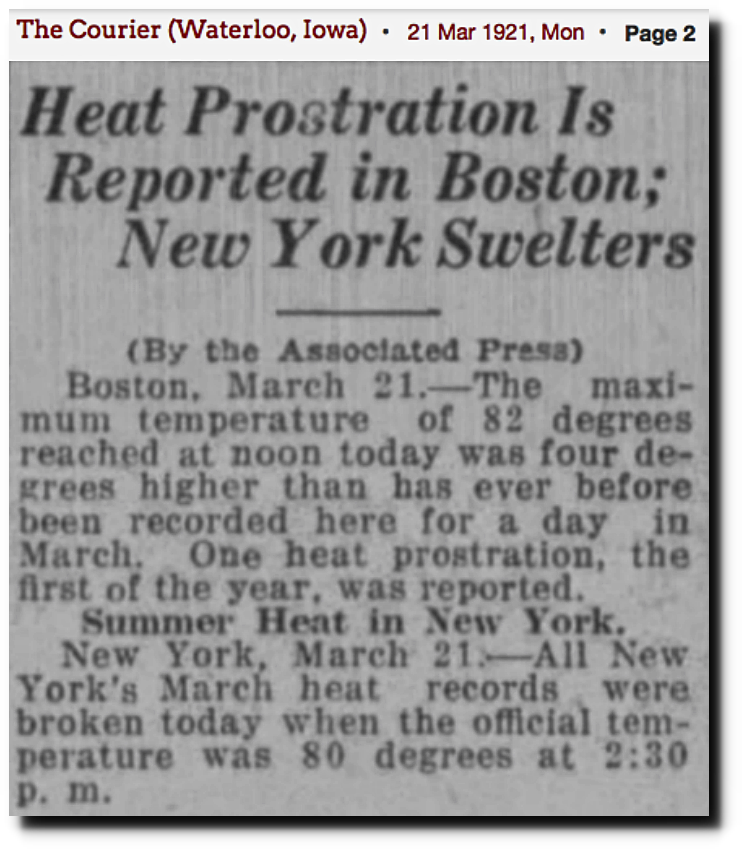
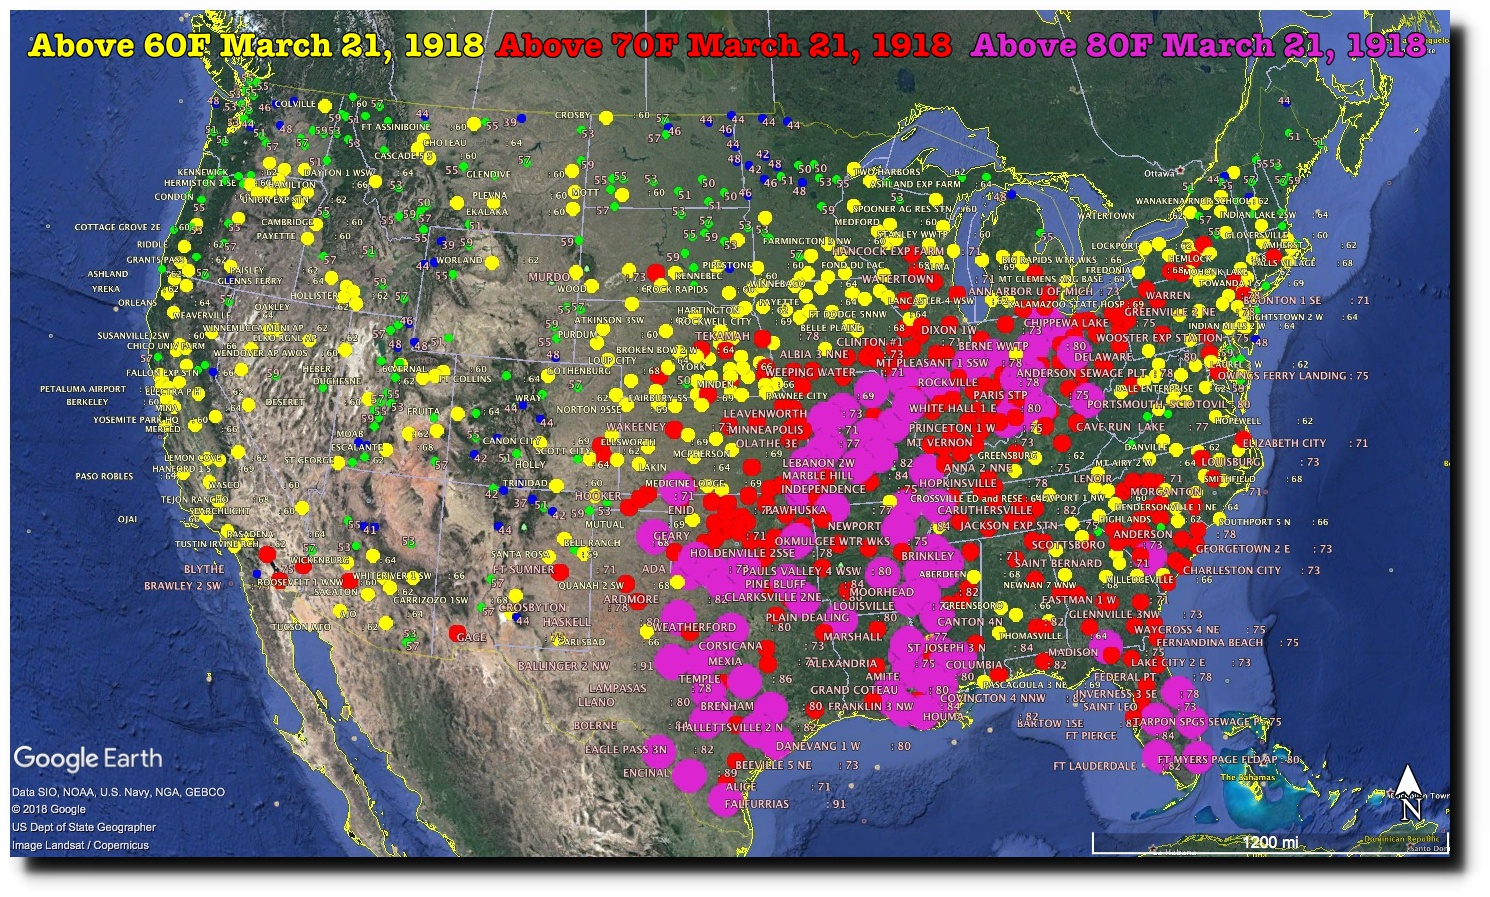
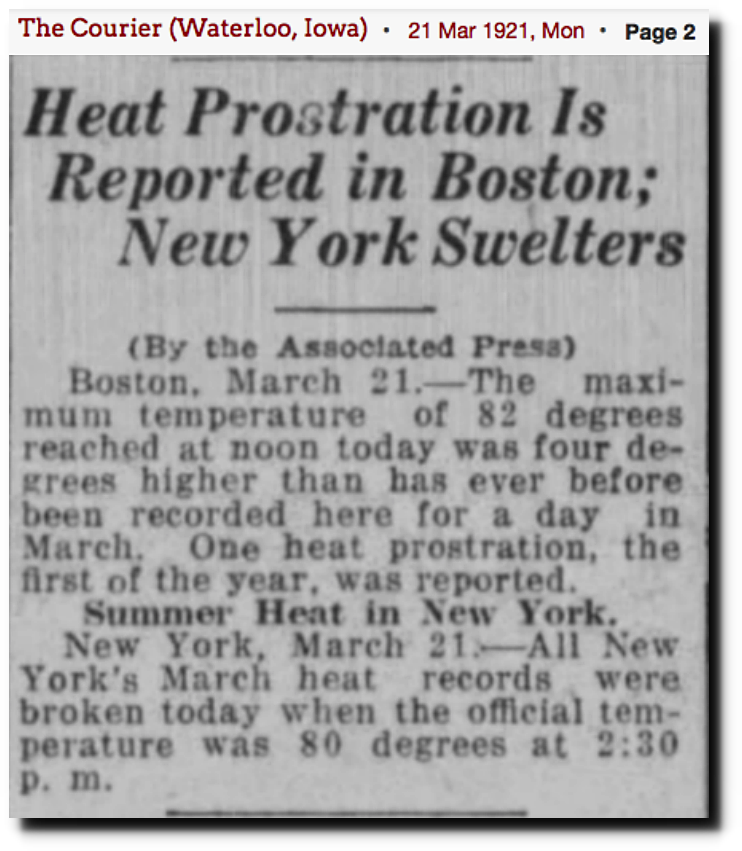
We are expecting a foot of snow the next couple of days in Philadelphia, but on this date in 1921, about half of the US was over 80 degrees.
The heat then moved east and brought record warmth to the East Coast.
21 Mar 1921, 2 – The Courier at Newspapers.com
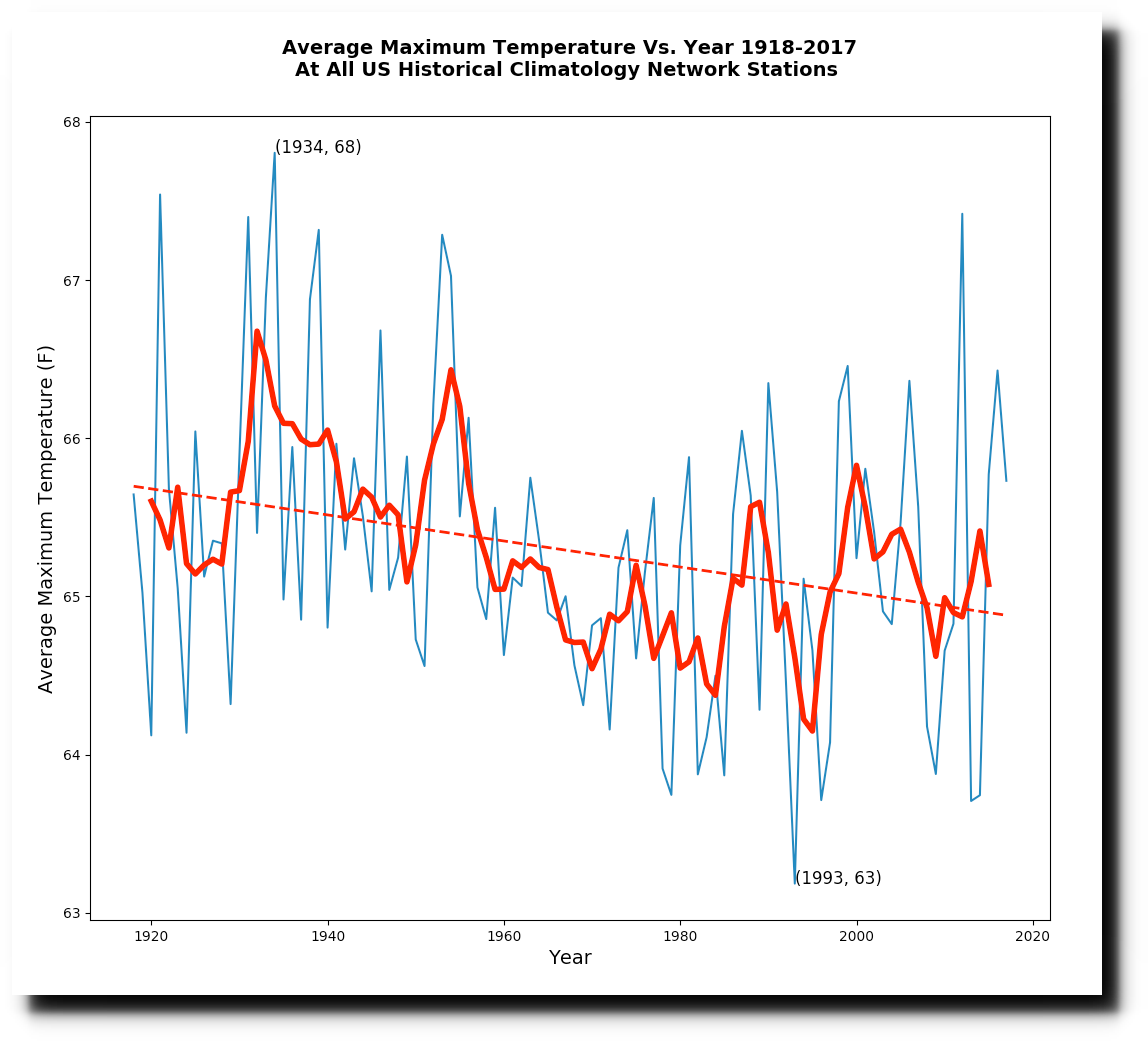
The warmth remained most of the year, and 1921 was the second warmest year on record in the US, after 1934.
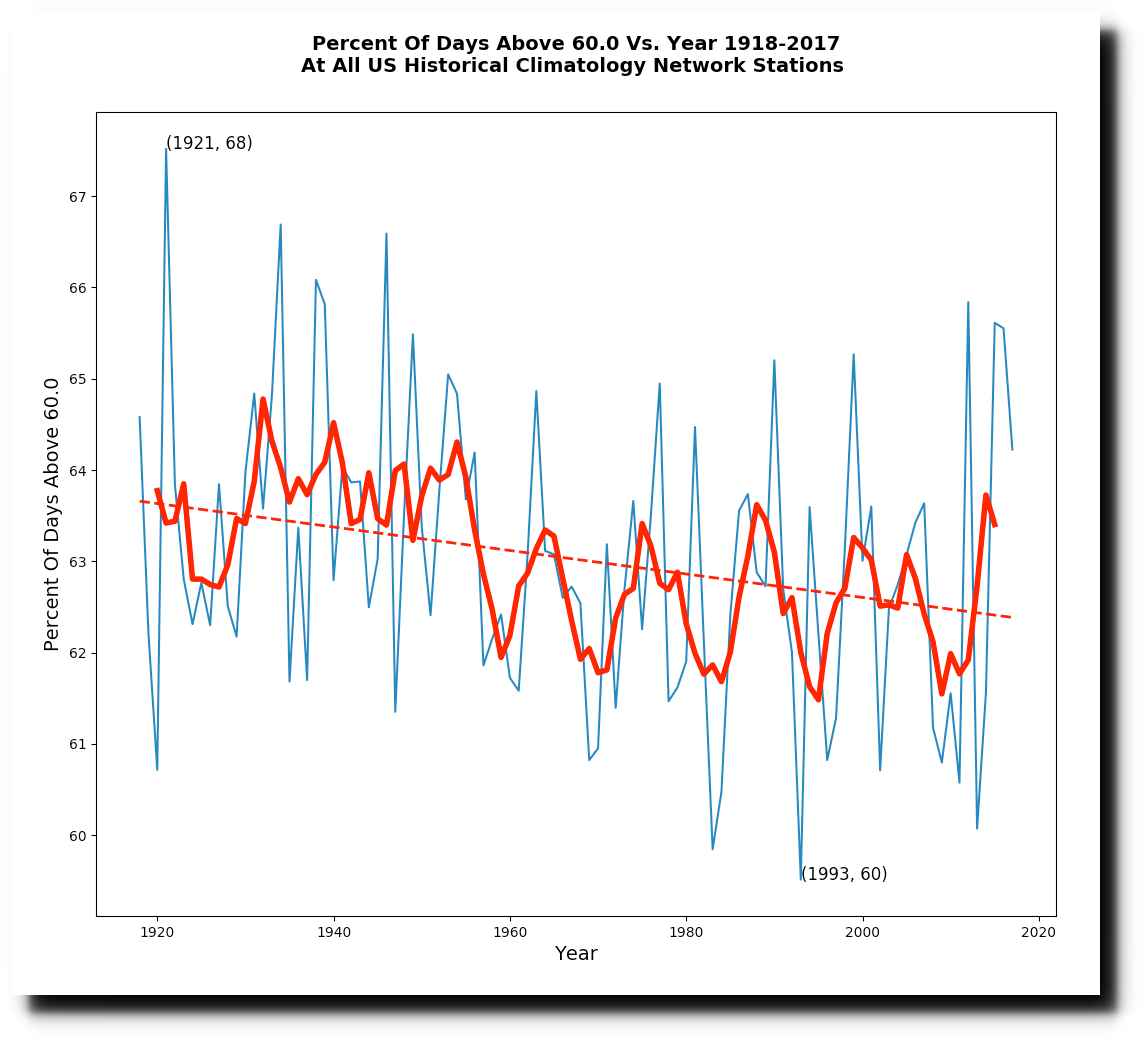
1921 was the only year where more than two thirds of days were above 60F in the United States.
1921 had the second highest percent of days over 70F.
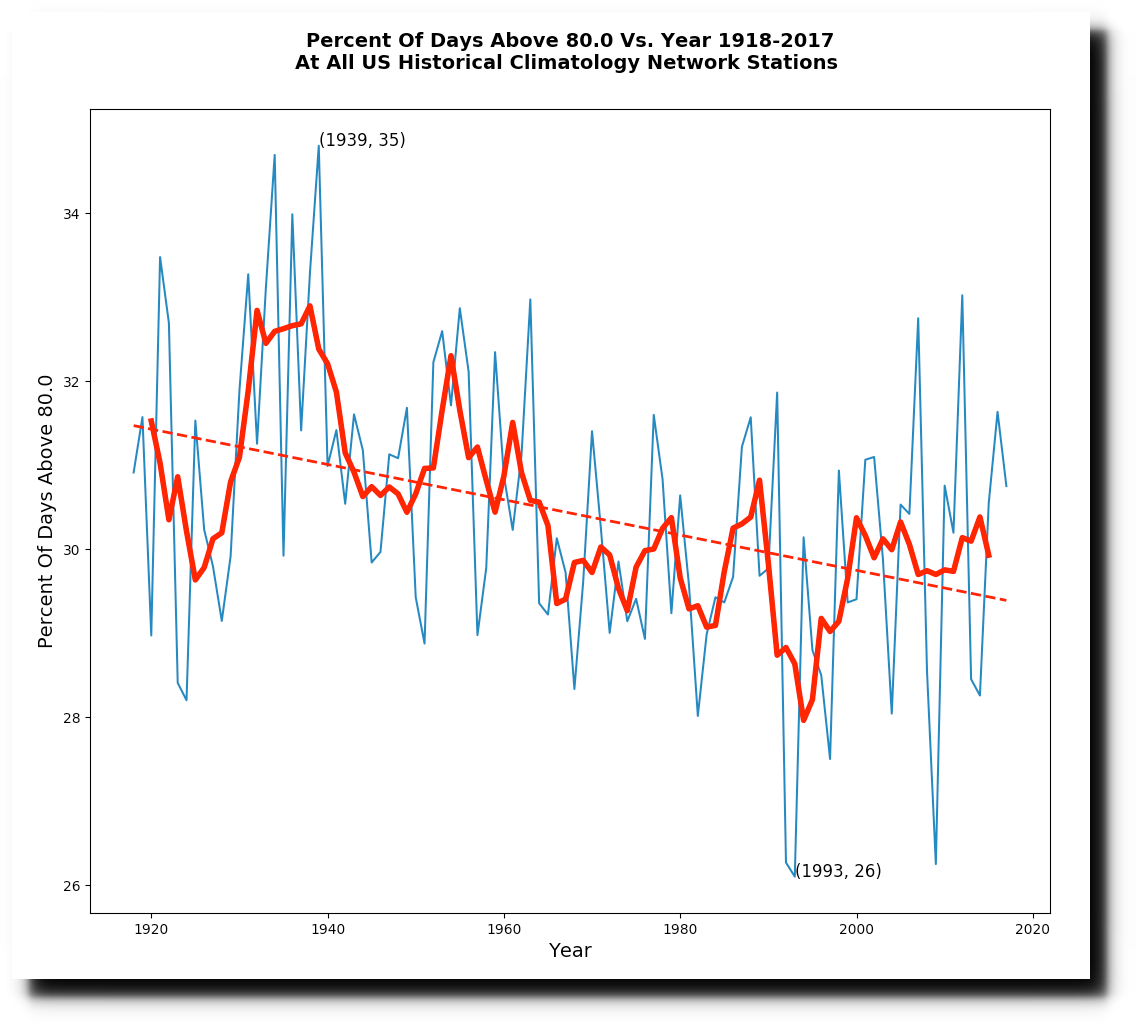
1921 had the fourth highest percentage of days above 80F
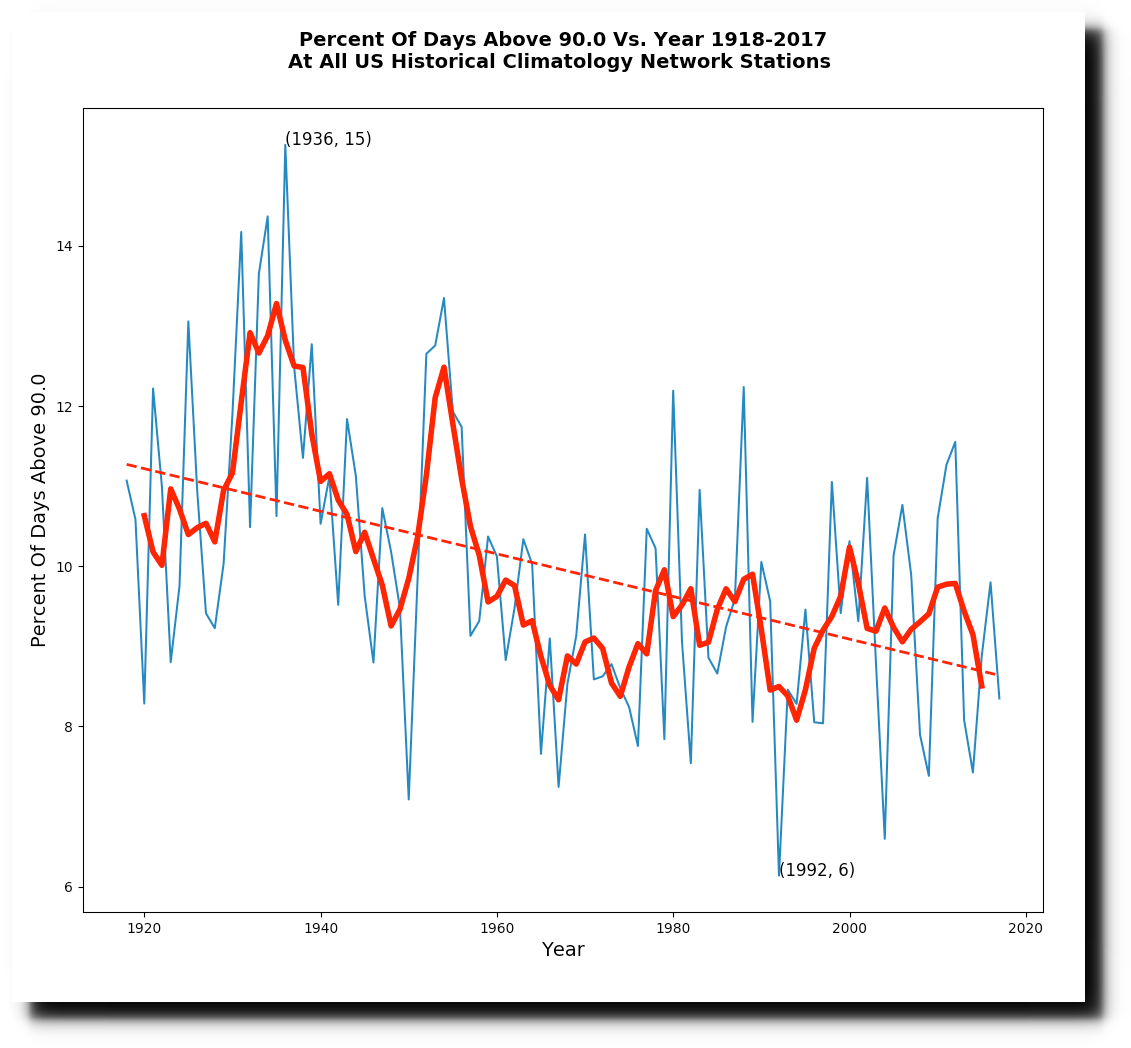
The frequency of 90 degree days in 1921 was well above average, but less spectacular.
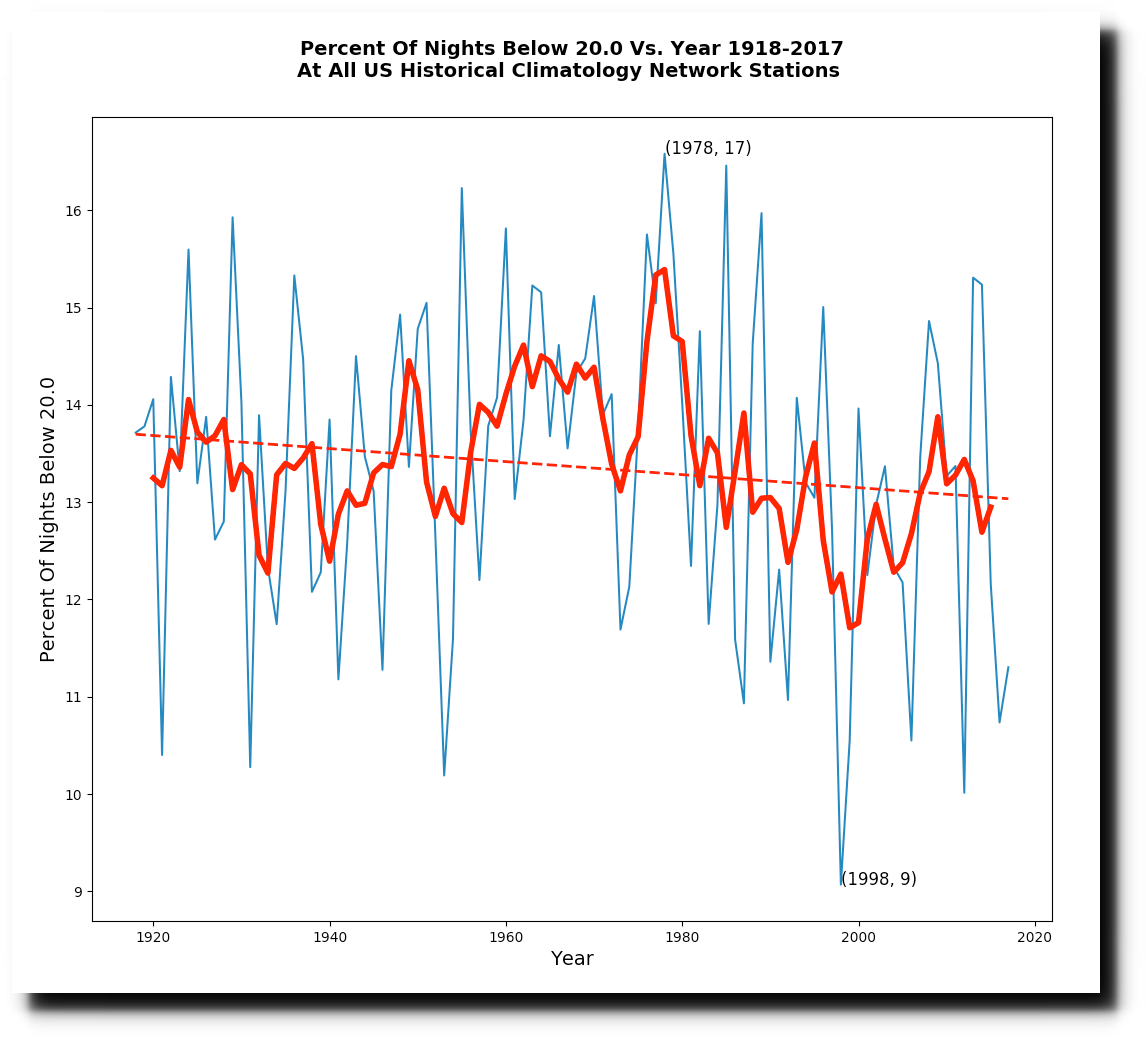
The frequency of below 20F nights was fifth lowest on record in 1921.
The interesting thing about 1921, is that it wasn’t extremely hot like 1931, 1933, 1934, 1936 or 1954 – but the weather was very warm throughout the year. CO2 was barely above 300 PPM at the time.
Posted in Uncategorized
Leave a comment
NOAA Data Tampering Approaching 2.5 Degrees
NOAA’s US temperature record shows that US was warmest in the 1930’s and has generally cooled as CO2 has increased. This wrecks greenhouse gas theory, so they “adjust” the data to make it look like the US is warming.
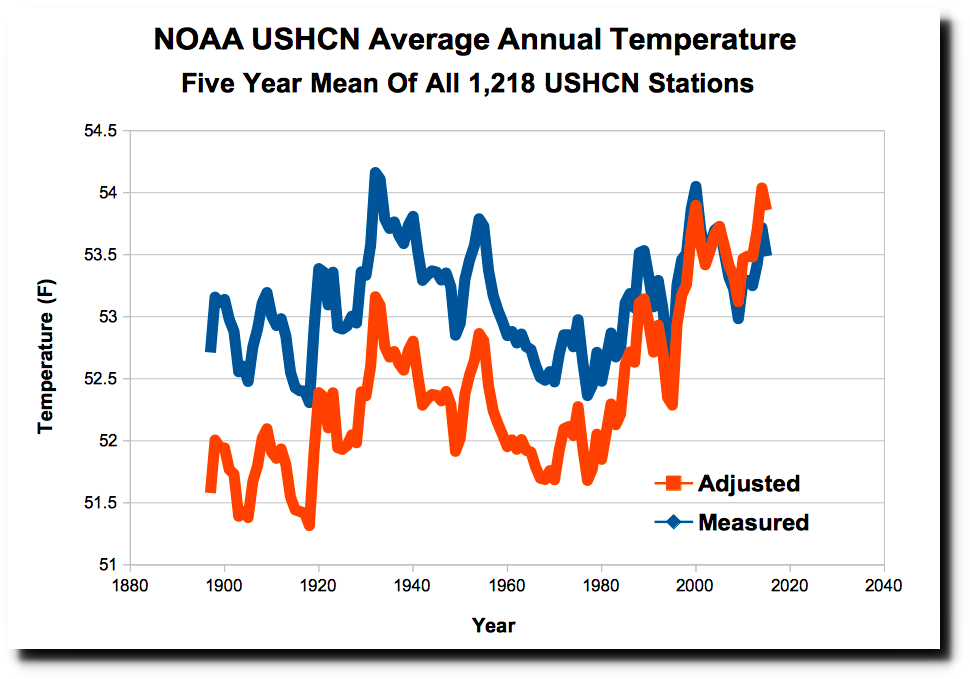
Raw NOAA Data Adjusted NOAA Data
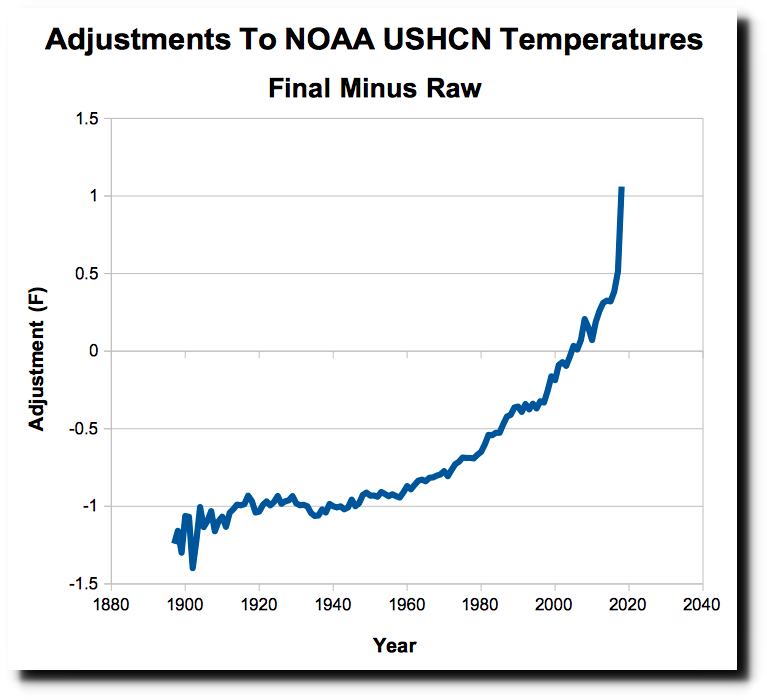
The NOAA data tampering produces a spectacular hockey stick of scientific fraud, which becomes the basis of vast amounts of downstream junk climate science. Pre-2000 temperatures are progressively cooled, and post-2000 temperatures are warmed. This year has been a particularly spectacular episode of data tampering by NOAA, as they introduce nearly 2.5 degrees of fake warming since 1895.
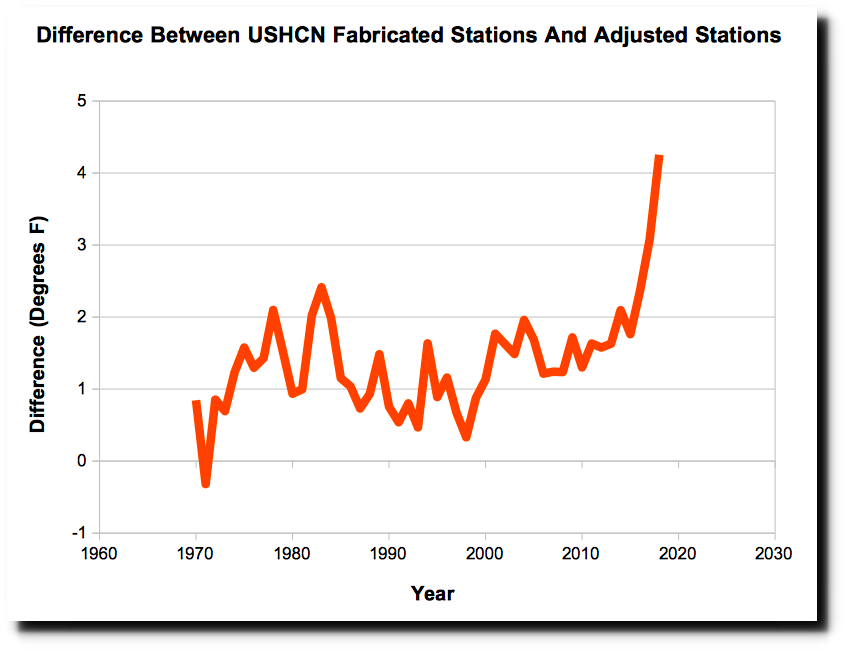
Most of these adjustments are due to simply making up data. Every month, a certain percentage of the 1,218 United States Historical Climatology Network (USHCN) stations fail to report their data, and the temperature gets estimated by NOAA using a computer model. Missing data is marked in the USHCN database with an “E” – meaning “estimated.” In 1970, about 10% of the data was missing, but that number has increased to almost 50%, meaning that almost half of the current adjusted data is fake.
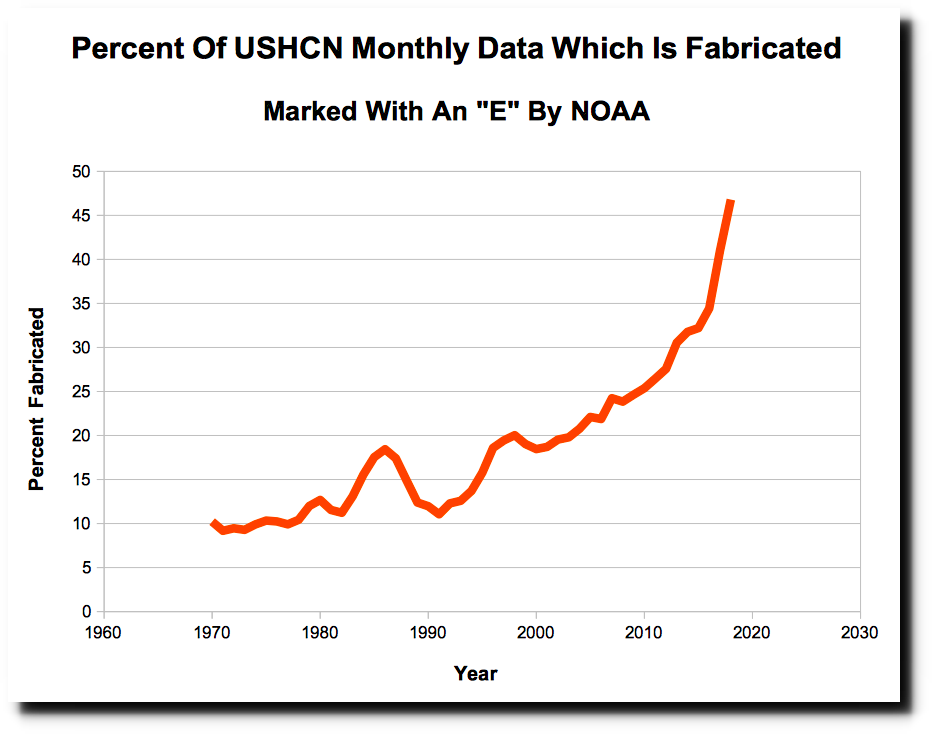
The fabricated temperatures have warmed four degrees since 1970, relative to the adjusted temperatures which were based on actual station data. This shows that the warming trend in the US claimed by NOAA is based on computer models, not actual thermometer data or even adjusted thermometer data.
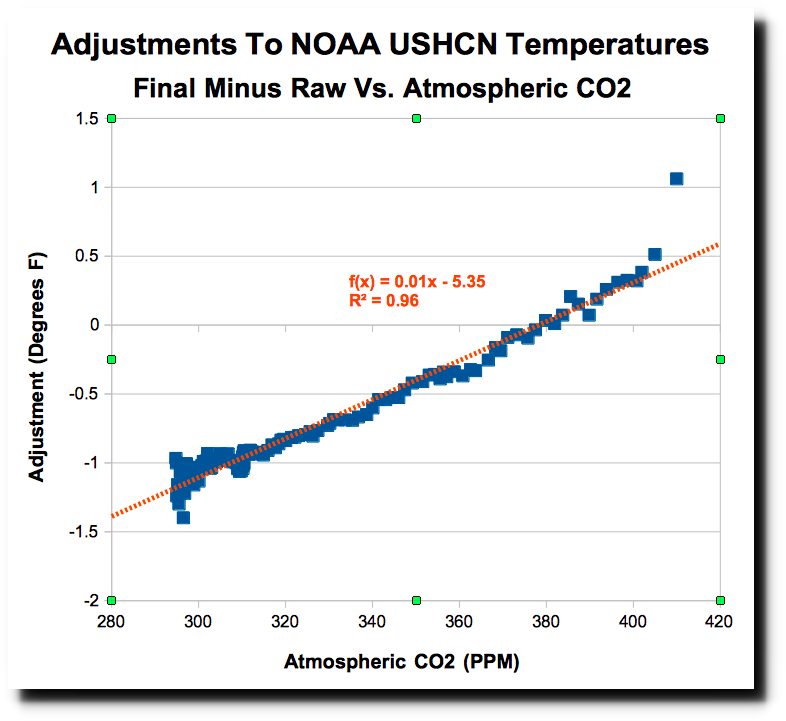
But here is the real smoking gun of fraud by NOAA. The adjustments being made almost perfectly match atmospheric CO2 levels – showing that the data is being altered precisely to match global warming theory.
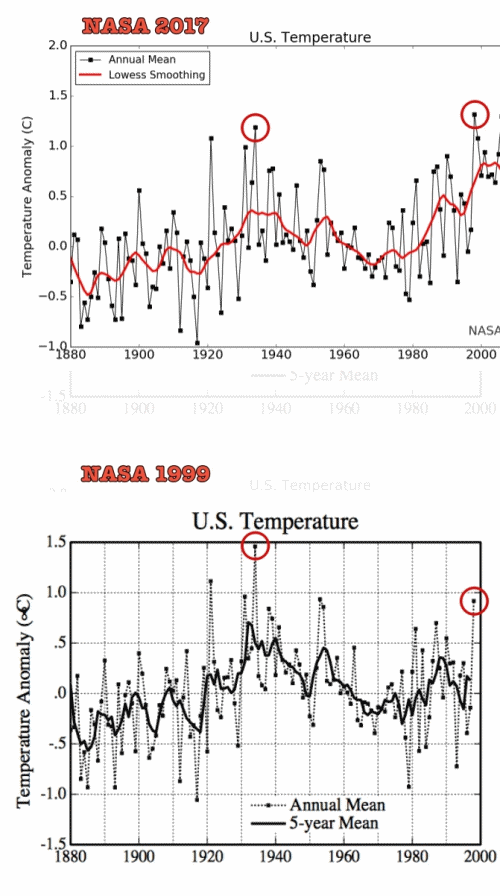
Science doesn’t get any worse than how NOAA handles US temperature data. NASA uses the NOAA data as the basis for their temperature graphs, which have also been massively altered to turn cooling into warming.
Posted in Uncategorized
2 Comments
Greenland Meltdown Update
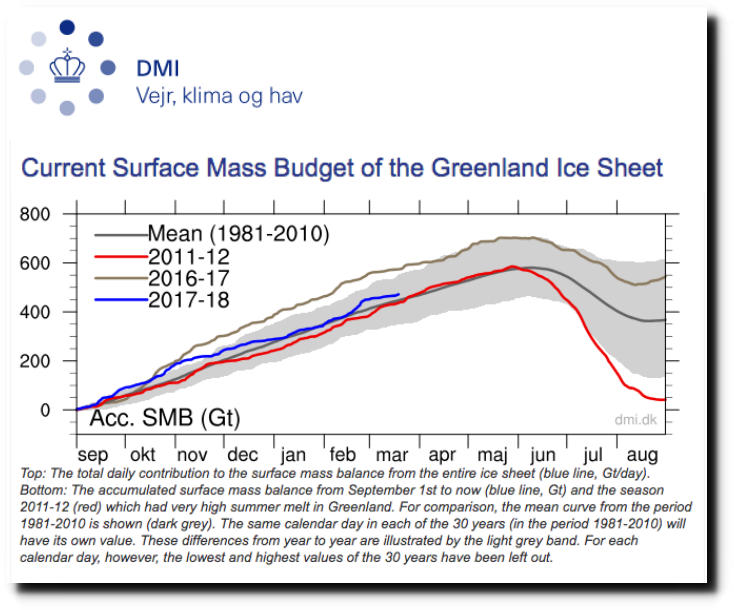
For the second year in a row, Greenland’s surface is gaining well above normal amounts of ice.
Greenland Ice Sheet Surface Mass Budget: DMI
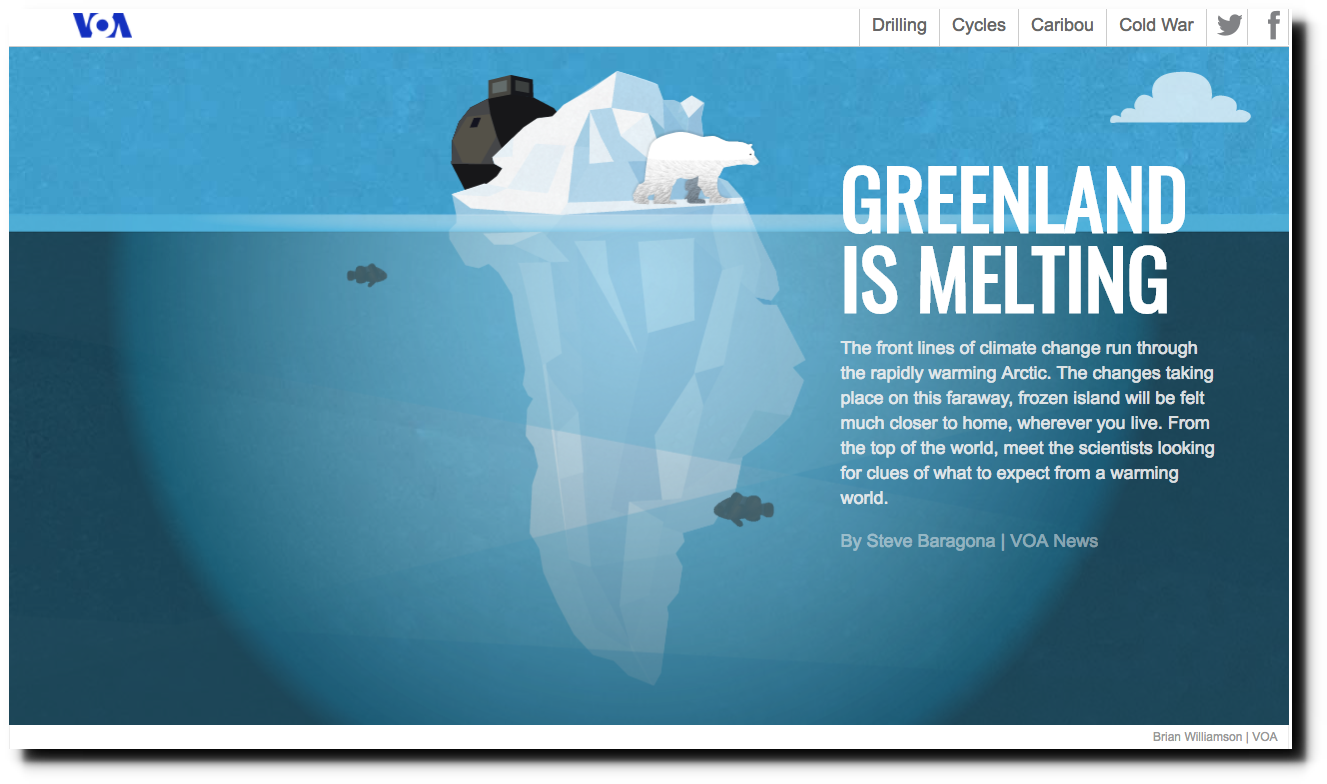
Meanwhile, the propaganda organization known as the “Voice of America” is claiming that Greenland is melting down.
Greenland is melting | VOA Special Report
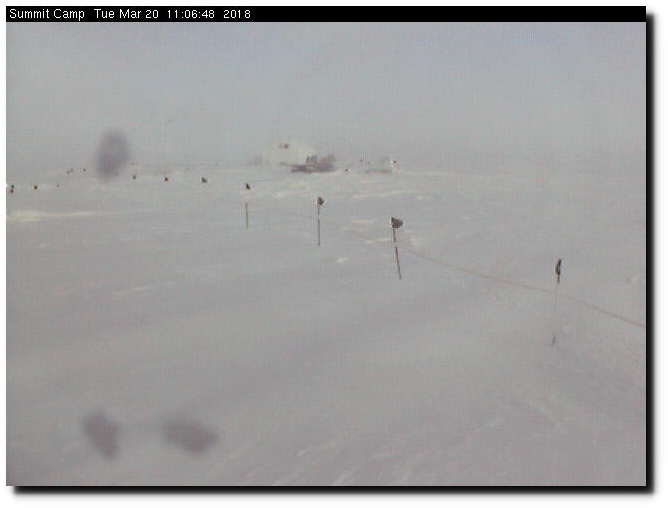
This is what the Greenland Country Club looks like this morning at -22C. The warmest temperature they have had for months.
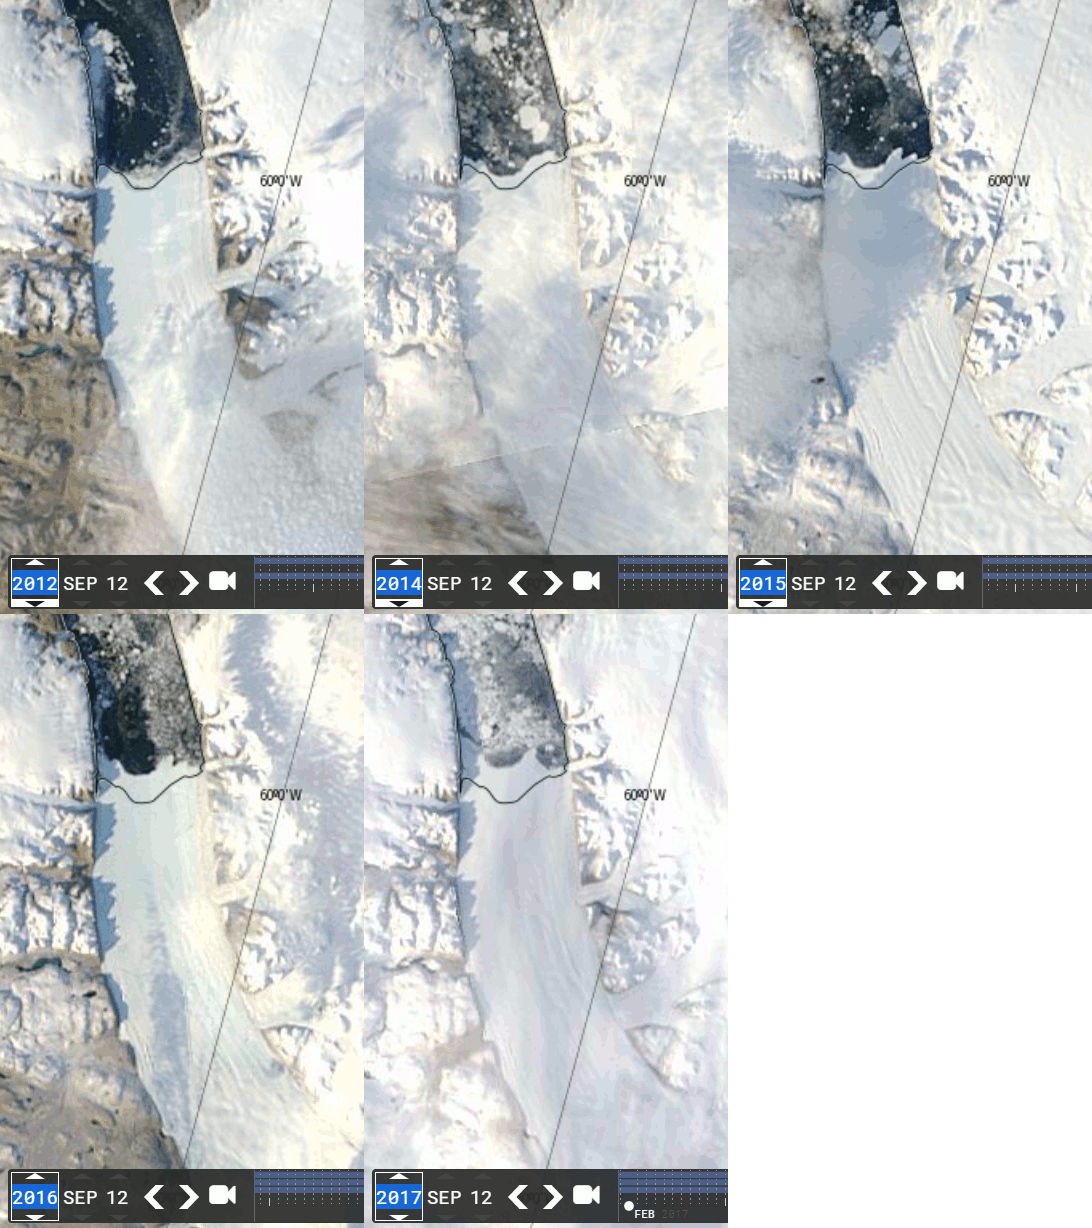
Greenland’s most famous glacier, the Petermann Glacier, has grown about 10 feet per day over the past six years.
Facts and data have no meaning to climate alarmists. They have an agenda, and nothing else matters.
Posted in Uncategorized
Leave a comment
No Longer Deplorable – Now A Virus
You could put half of Trump’s supporters into what I call the basket of deplorables. Right? The racist, sexist, homophobic, xenophobic, Islamaphobic—you name it.
- Hillary Clinton
Hillary now says Trump supporters are like a virus. Her supporters are wealthy and dynamic (unlike the poor, lazy slugs who support the President) and that America will never be Great Again.
Now, having said all this, WHY AREN’T I FIFTY POINTS AHEAD YOU MIGHT ASK?
Posted in Uncategorized
Leave a comment
Cherry Blossom Superstition Of The Global Warming Religion
No amount of experimentation can ever prove me right; a single experiment can prove me wrong.
- Albert Einstein
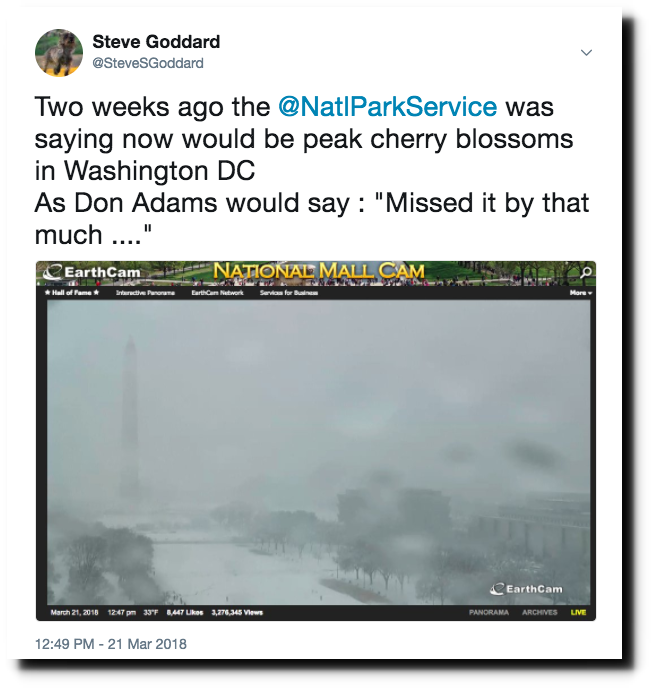
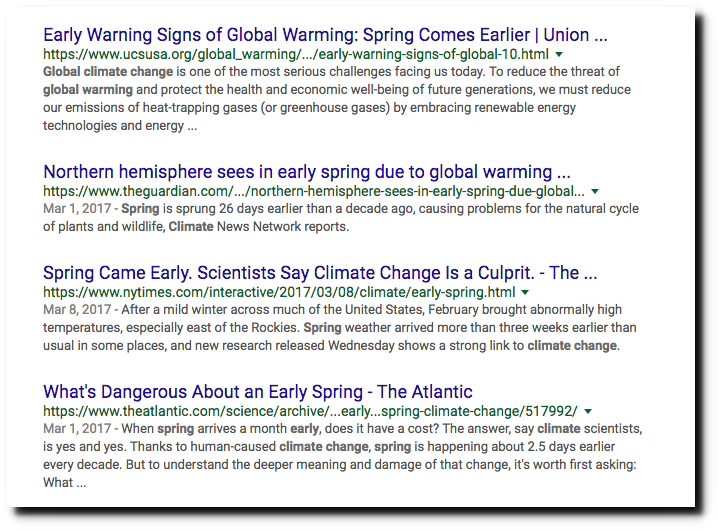
The news is full of stories that Washington DC’s cherry blossoms are blooming earlier and earlier due to “global warming.”
The Washington Post Even predicted that cherry trees would start blooming in January.
Could cherry blossoms one day be blooming in winter? – The Washington Post
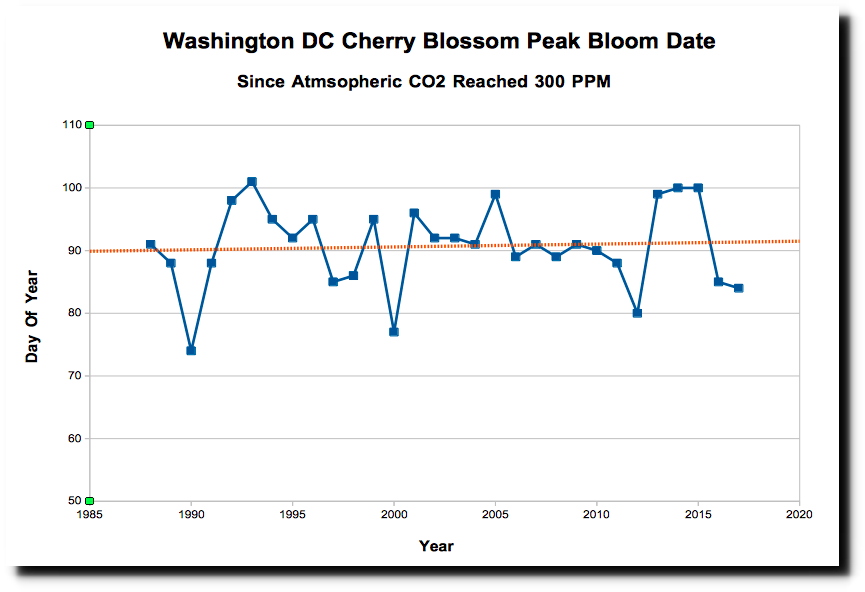
It is simple enough to test these theories out, using actual data. Since CO2 hit 350 PPM, the average peak bloom date has changed from March 31 to April 2 – i.e. the trees are blooming two days later than they did 30 years ago.
https://www.epa.gov/sites/production/files/2016-08/cherry-blossoms_fig-1.csv
Five of the last six months of March have been below normal or normal temperatures in the DC area, with this month (so far) being the coldest since 1960.
The years 1945 and 1946 had very warm months of March, and the trees bloomed record early those years.
Ludington Daily News – Google News Archive Search
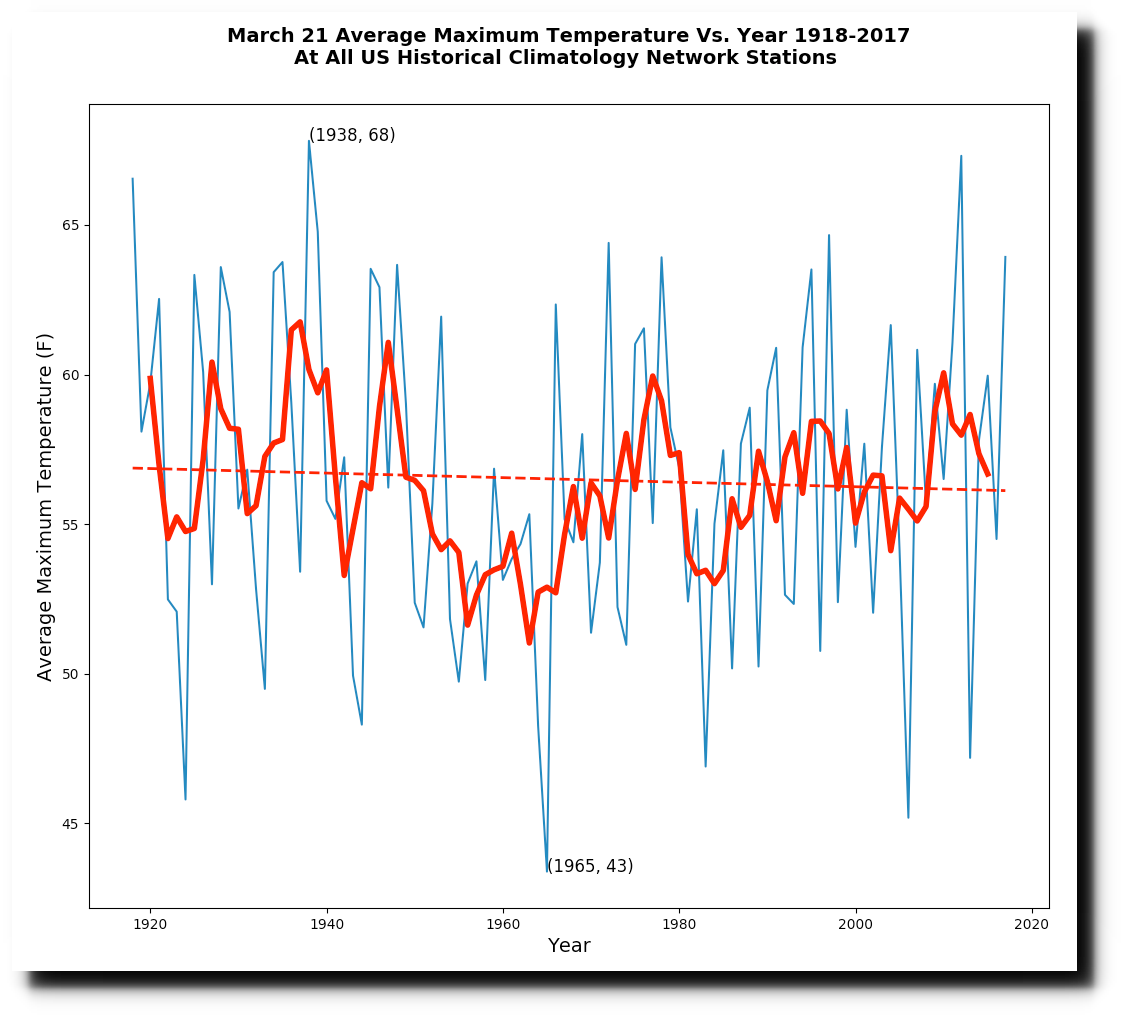
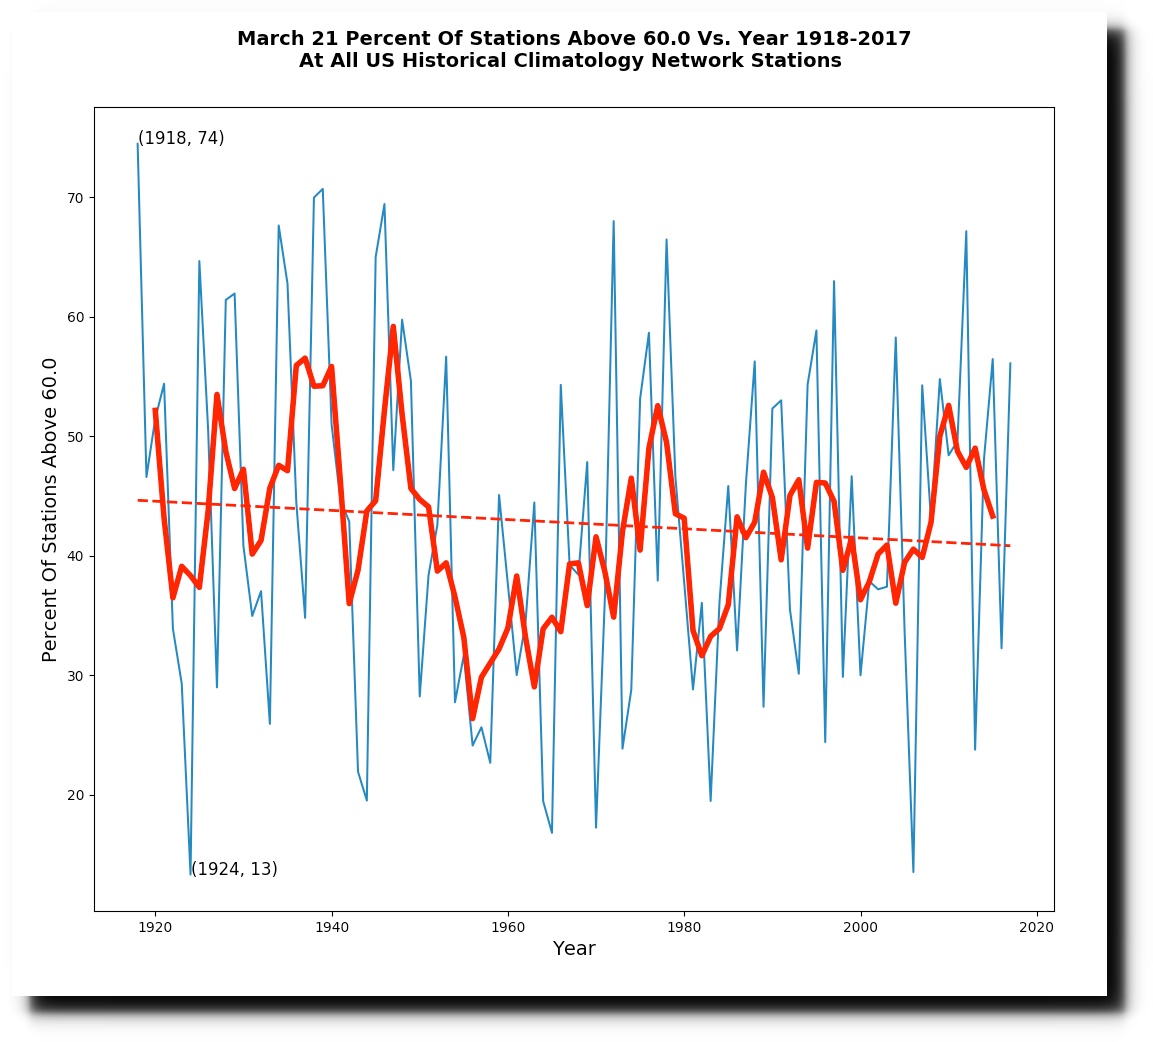
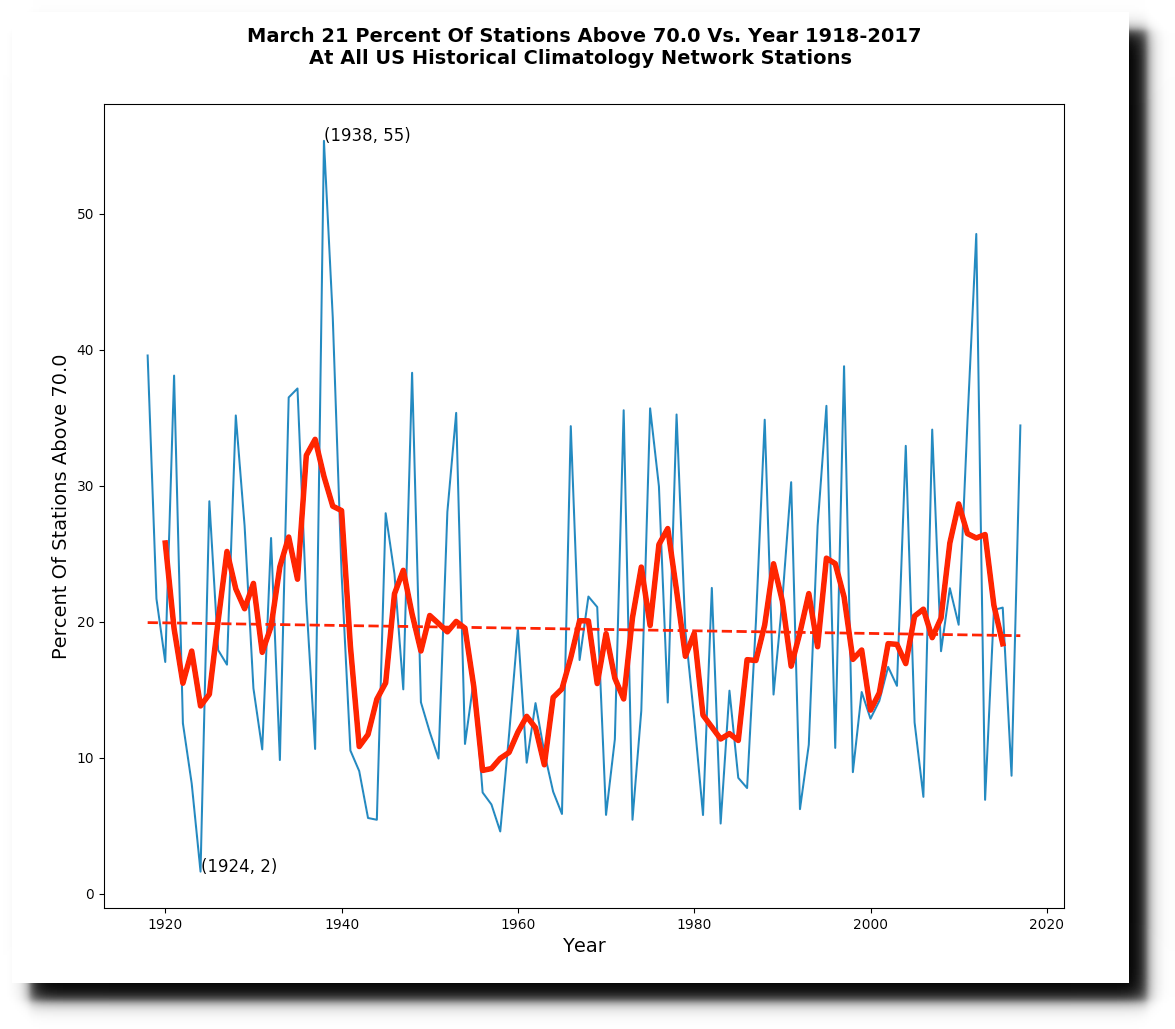
The frequency of 60 degree March days in the DC area has declined slightly over the past century, with this month (so far) being the lowest on record.
Washington DC is expecting another snowstorm on the first day of spring. This year will be a late bloom again.
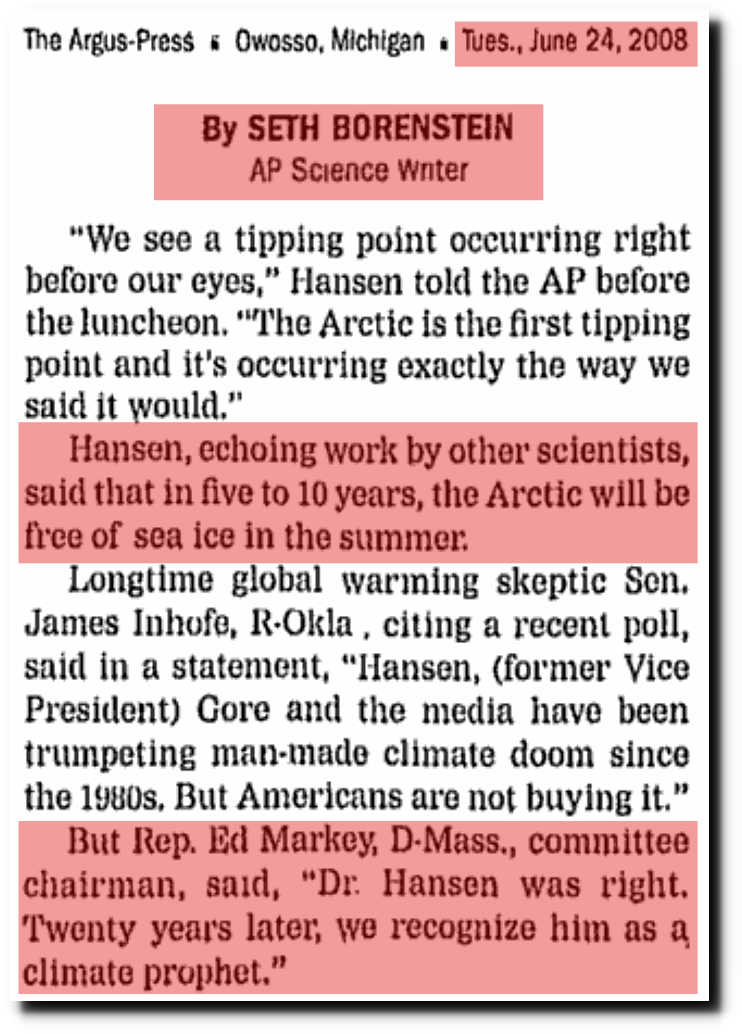
Like everything else which climate cult members believe, there is zero evidence backing up their belief that cherry tree bloom dates have anything to do with atmospheric CO2 levels. Since Hansen gave this testimony in DC, peak bloom date has gotten two days later.
On June 23, 1988, in the sweltering heat, Hansen told a U.S. Senate committee he was 99 percent certain that the year’s record temperatures were not the result of natural variation. It was the first time a lead scientist drew a connection between human activities, the growing concentration of atmospheric pollutants, and a warming climate.
“It’s time to stop waffling so much and say that the evidence is pretty strong that the greenhouse effect is here,” Hansen told reporters.
A look back at James Hansen’s seminal testimony on climate, part one | Grist
But the cult rolls on, believing their false prophets. They are completely oblivious to evidence.
Posted in Uncategorized
Leave a comment
Hollywood And The NFL
“films, football, beer and above all, gambling filled up the horizon of their minds. To keep them in control was not difficult.”
? George Orwell, 1984
Posted in Uncategorized
Leave a comment
The Missing Ice Cube Controls The Climate
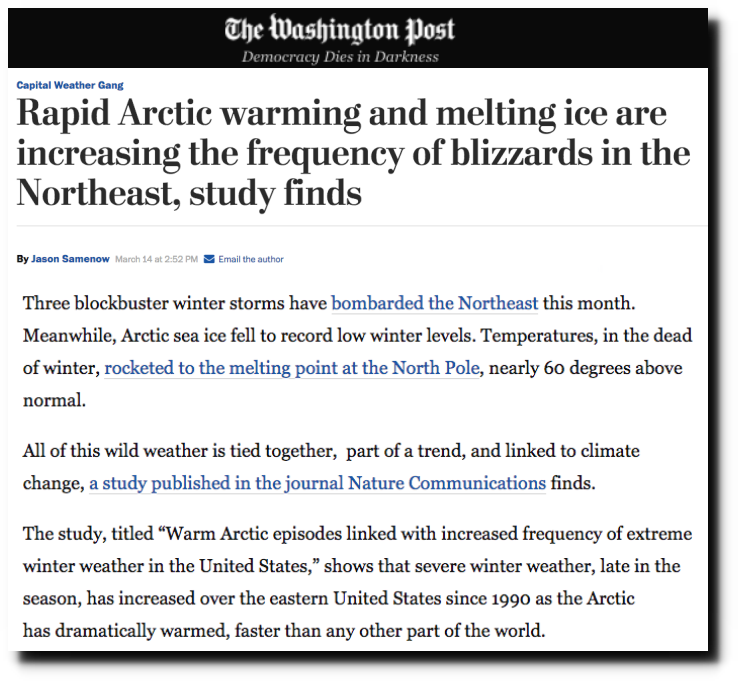
Climate scientists claim that “rapidly melting Arctic ice” is causing the record cold and snow here in Philadelphia.
Rapid Arctic warming and melting ice are increasing the frequency of blizzards in the Northeast, study finds – The Washington Post
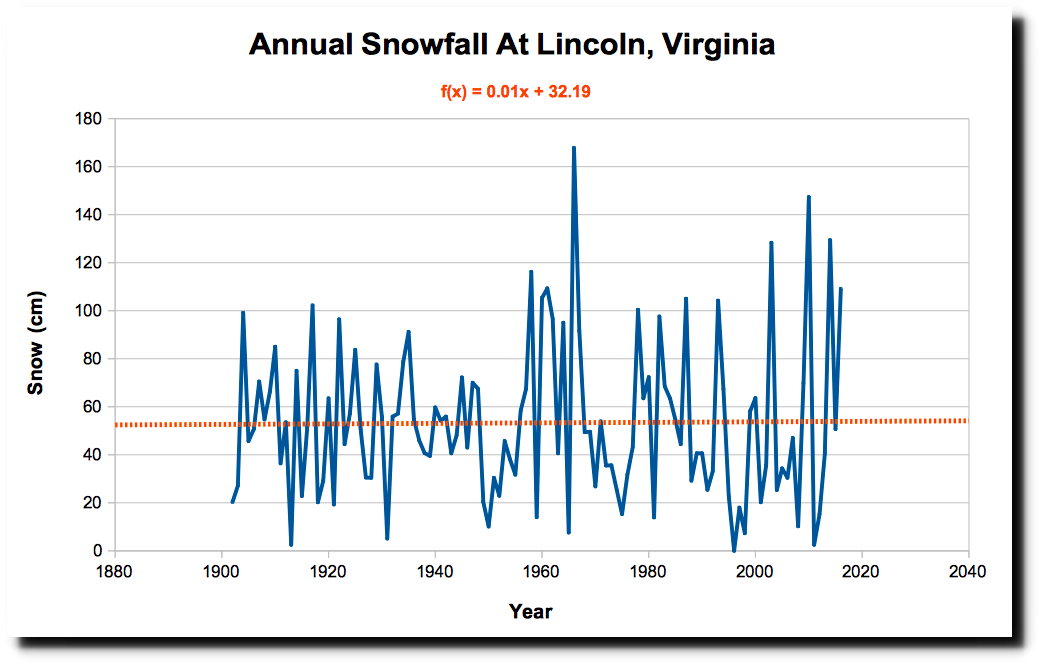
Besides the fact that their theory is nonsensical, the ice isn’t melting and there isn’t any missing ice in the Arctic.
The Arctic is extremely cold, and the cold air is spilling down to the East Coast.
Cold Arctic air is causing the snow, not the fake warm Arctic which exists only inside the heads of climate scientists and their religious cult followers.
Weather Street:Clouds and Precipitation Forecast Movie
This what Bath, England looks like this morning.
Posted in Uncategorized
Leave a comment
A Fairy Tale Of Two GHCN Cities
Buenos Aires and La Estanzuela are located 35 miles apart across the water. Buenos Aires is a massive heat island, and La Estanzuela is a small town of a few thousand people.
Buenos Aires warmed tremendously from 1931 to 1995, the period of record for the La Estanzuela station.
La Estanzuela temperatures cooled during that same period, and the frequency of hot days plummeted.

The two degree warming trend at Buenos Aires is bogus. The area is actually cooling. So how did NASA and NOAA deal with this? They reduced the two degree warming trend to 1.5 degrees warming.
Data.GISS: GISS Surface Temperature Analysis
The surface temperature record is a farce. These people make no attempt to be even remotely credible.
Posted in Uncategorized
Leave a comment