
Under Obama, every government agency became thoroughly corrupt. This was from two years ago.

Under Obama, every government agency became thoroughly corrupt. This was from two years ago.
According to climate alarmists at Earth-Sky, wildfires are on the increase in the US, and 2005, 2006, 2007, 2011 and 2012 were record years.
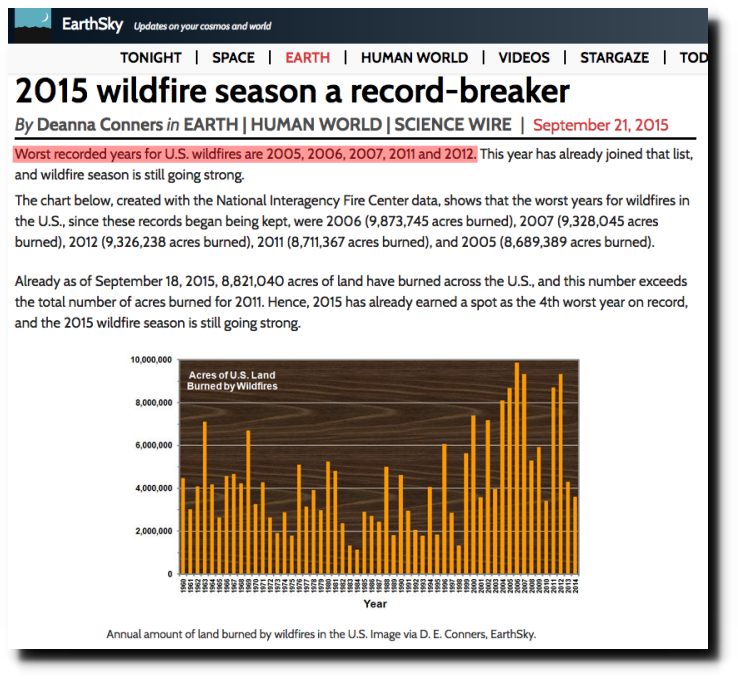
2015 wildfire season a record-breaker | Earth | EarthSky
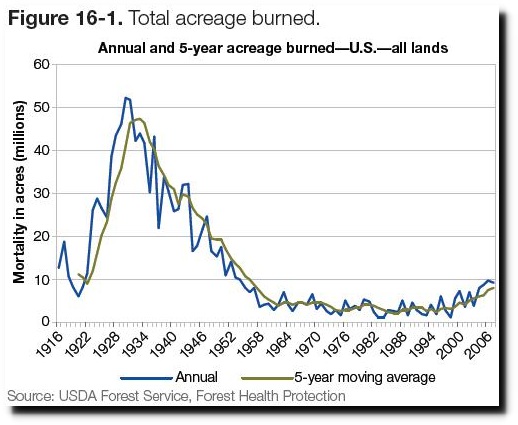
The graph above starts in 1960, and it isn’t hard to see why. Their graph starts at one of the lowest years on record. The graph below is a much longer record from the US Forest Service.
Indicator 3.16: Area and percent of forest affected by abiotic agents
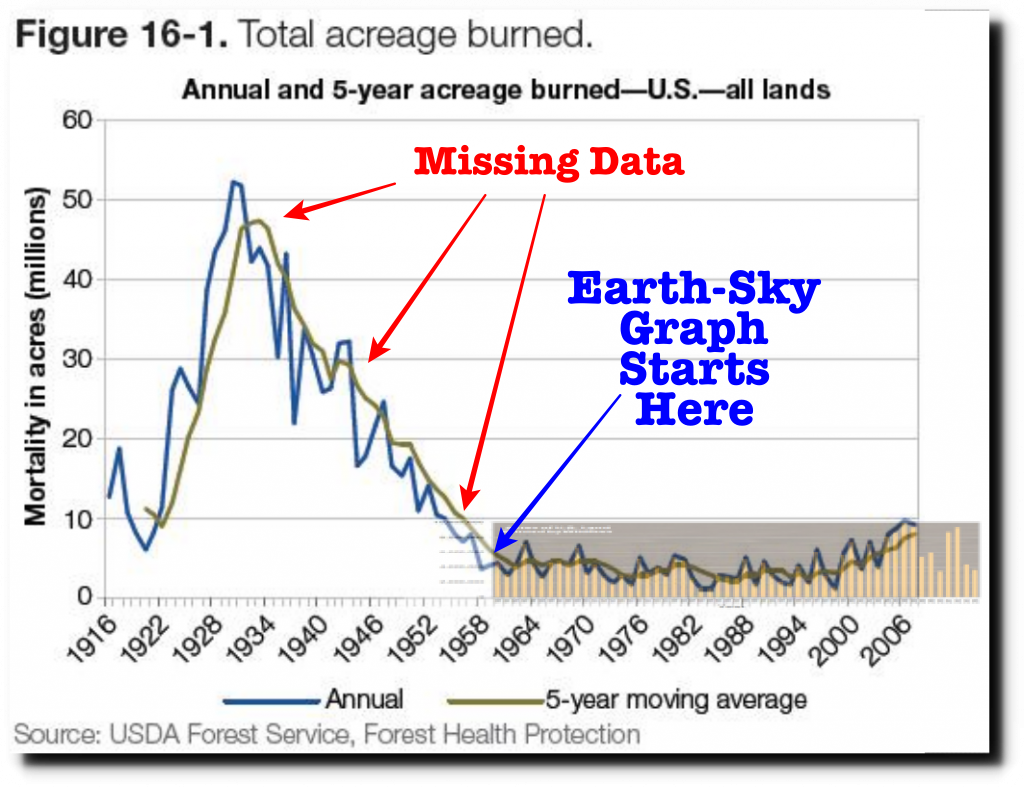
I overlaid the two graphs at the same scale below, showing the spectacular fraud behind the start date of 1960 in the 1960-2014 graph. Their record high years were actually closer to being record low years.
The USFS graph is quite real, and correlates well with newspaper reports from the time.
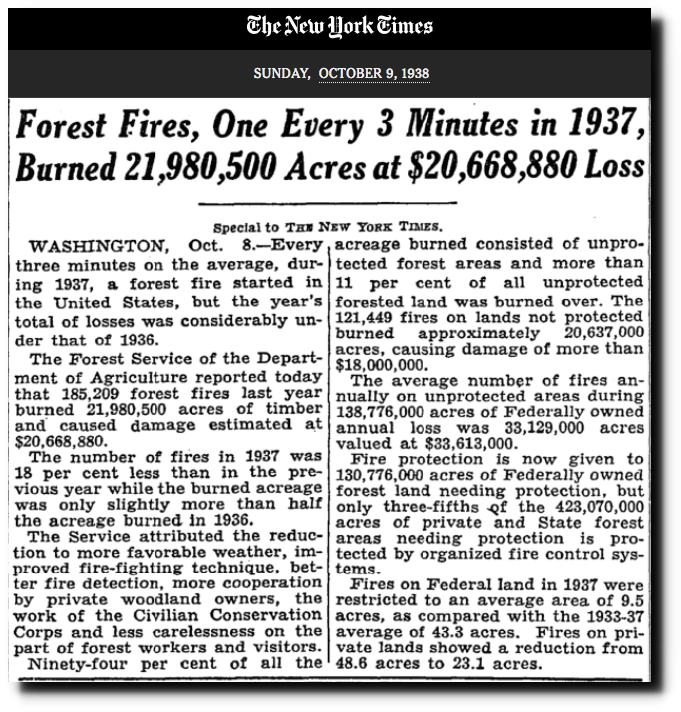
TimesMachine: October 9, 1938 – NYTimes.com
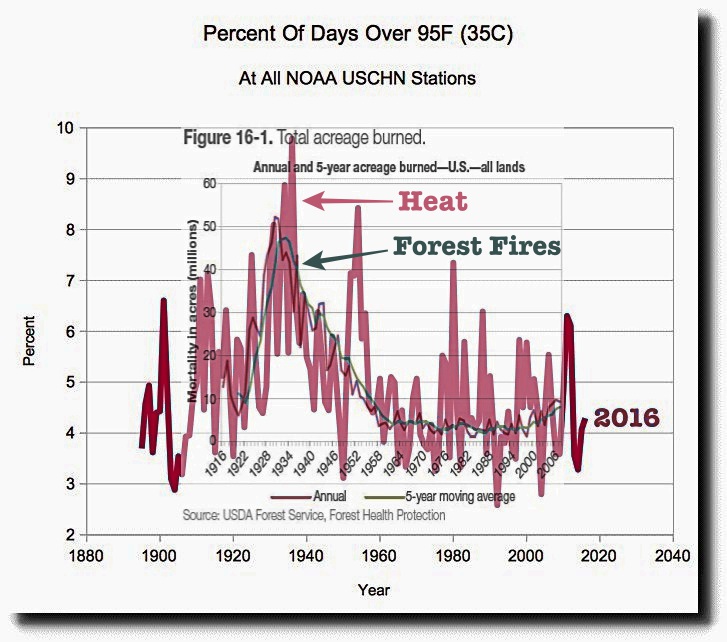
Forest fire burn acreage is down 90% since CO2 was 280 PPM.
https://www.nifc.gov/PIO_bb/Policy/FederalWildlandFireManagementPolicy_2001.pdf
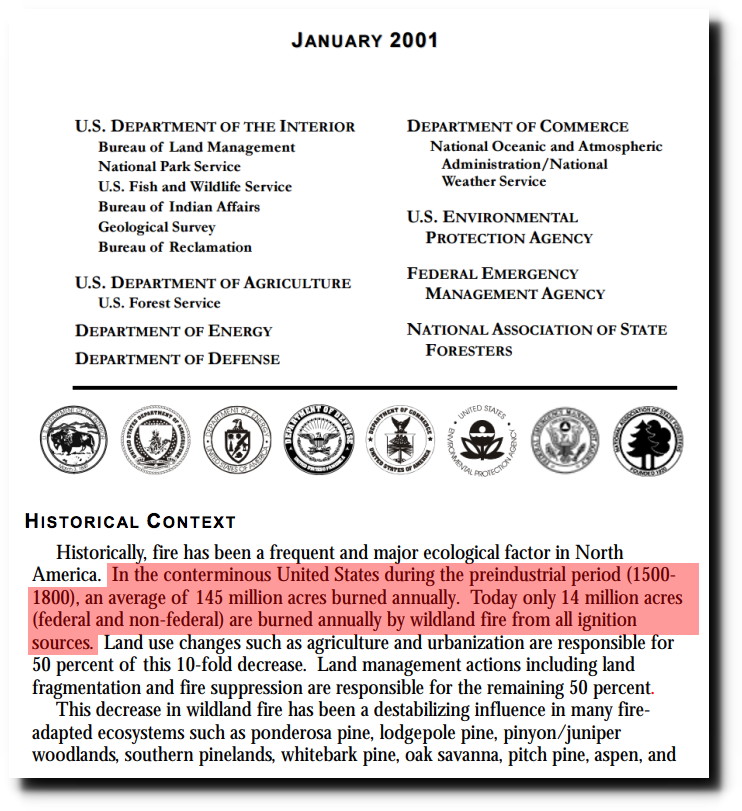
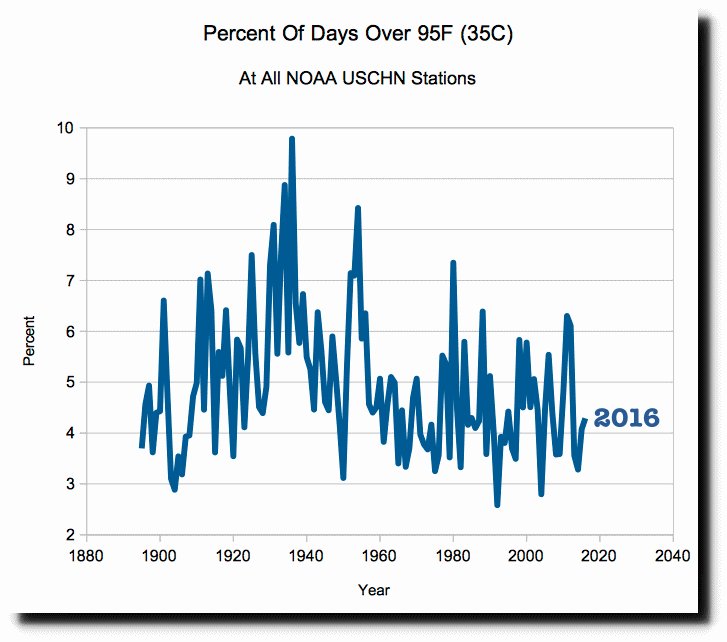
There is no correlation between fires and CO2, however there is an excellent correlation between fires and hot weather. The graph below shows the percent of days over 95F (35C) in yellow, and the fire burn acreage in black. They track each other very closely.
Climate alarmists can’t win the debate honestly, so they cheat, lie, cherry-pick start dates and tamper with data. And then they still lose the debate anyway.
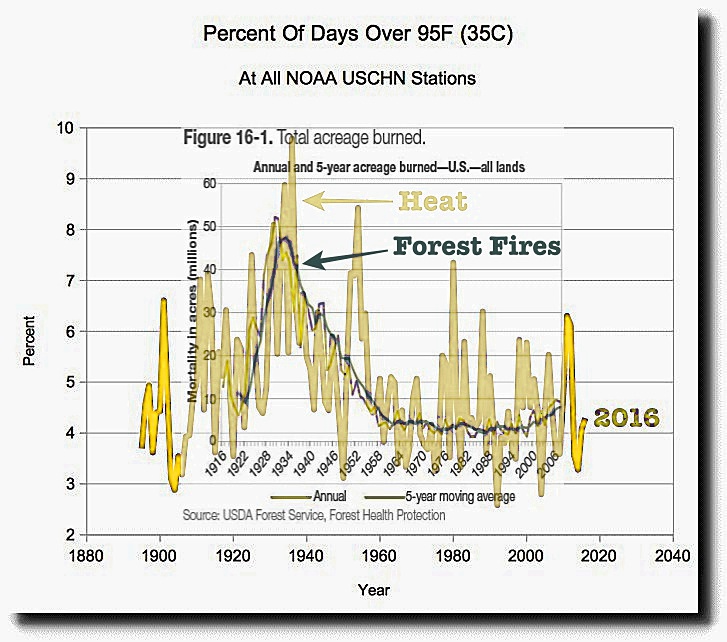
The frequency of hot days in the US during the 1930’s was much higher than it is now.
Total burn acreage was also much higher.
Indicator 3.16: Area and percent of forest affected by abiotic agents
The correlation between hot weather and burn acreage is almost perfect.
Government climate experts tell us that the US is getting hotter and fires are increasing. Both claims are completely false, and the people making these claims need to be removed from positions of influence.
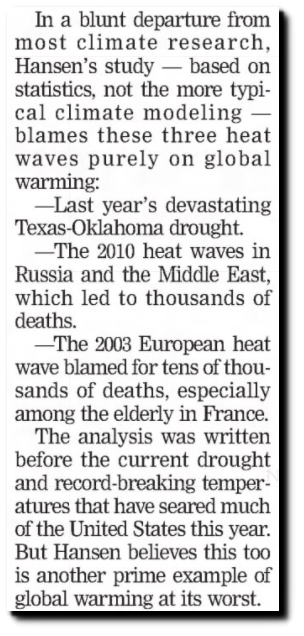
The US had a warm year in 2012, which unleashed a barrage of junk science from James Hansen, Andrew Weaver, and Kevin Trenberth. Hansen declared the 2003 European heatwave, the 2010 Russian heatwave, and the 2011 Texas/Oklahoma drought to be due to global warming “scientific fact.”
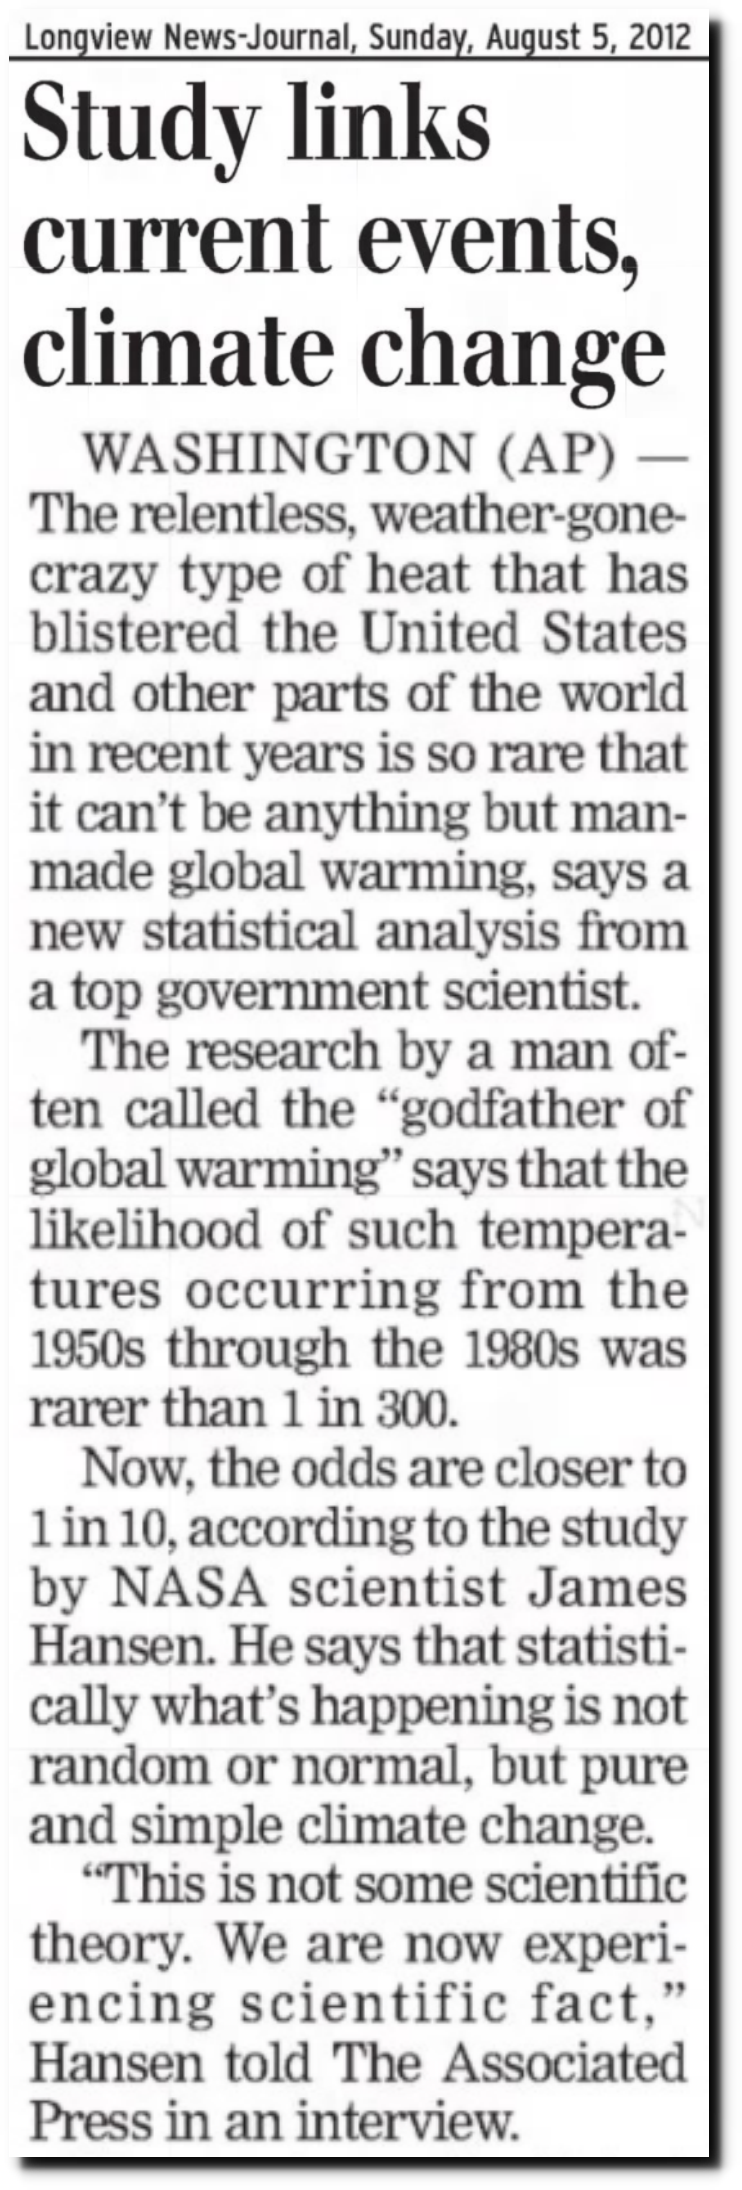
05 Aug 2012, B2 – Longview News-Journal at Newspapers.com
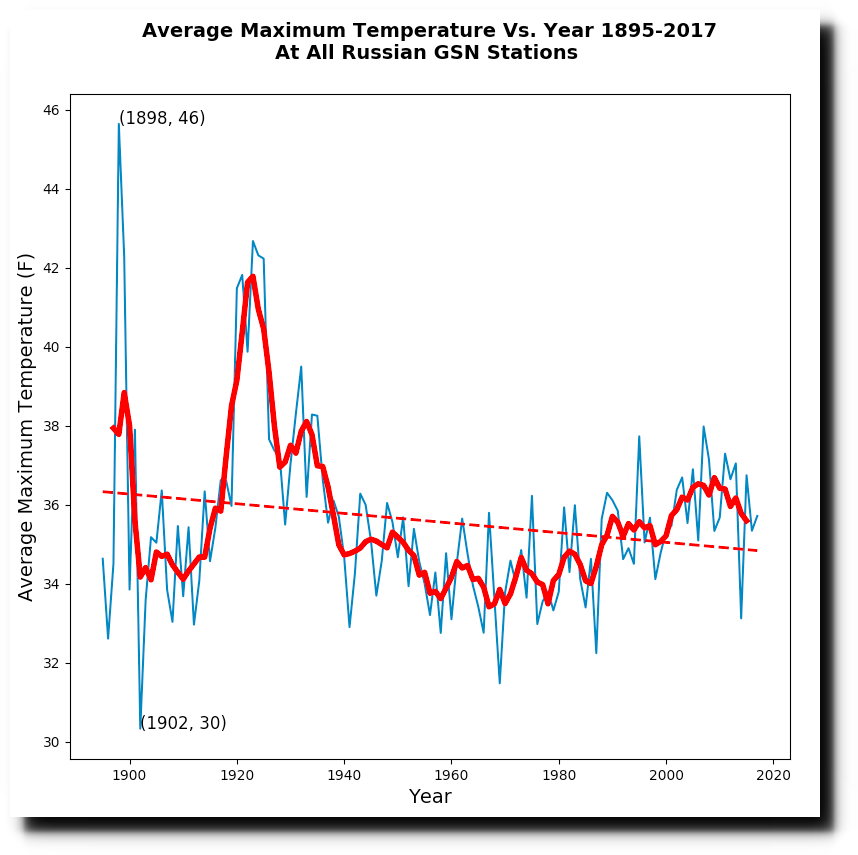
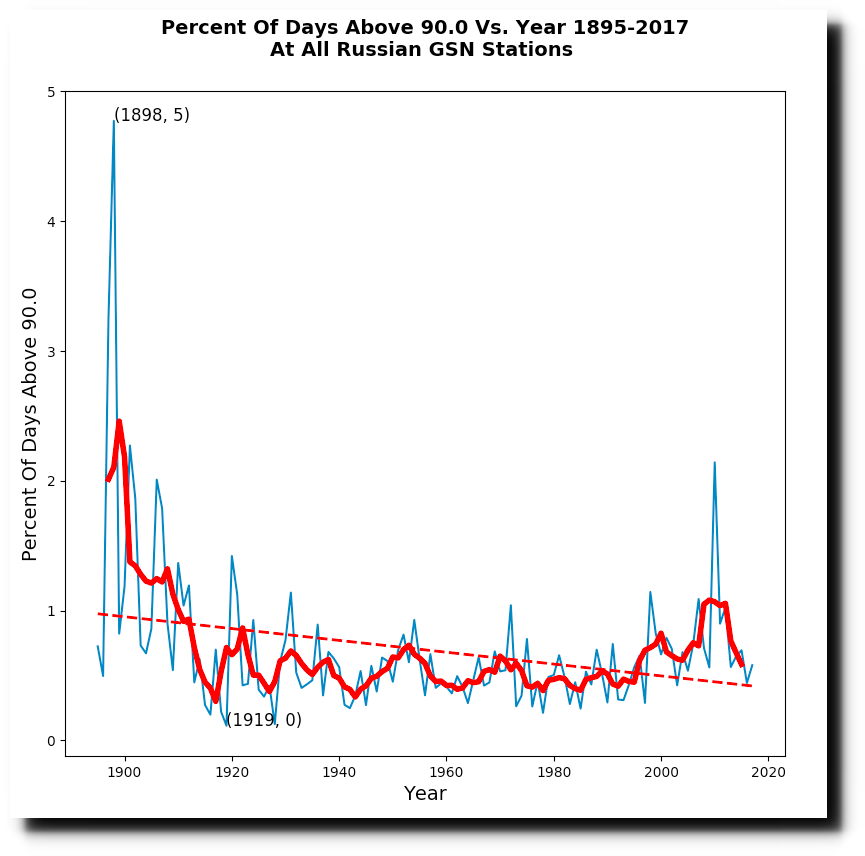
The 2010 Russian heatwave was an outlier, which went against the trend of cooler temperatures and fewer hot days in Russia since the 19th century. Hansen ignored all the hot pre-1950’s data, and then simply made up fake statistics about the data he was using.
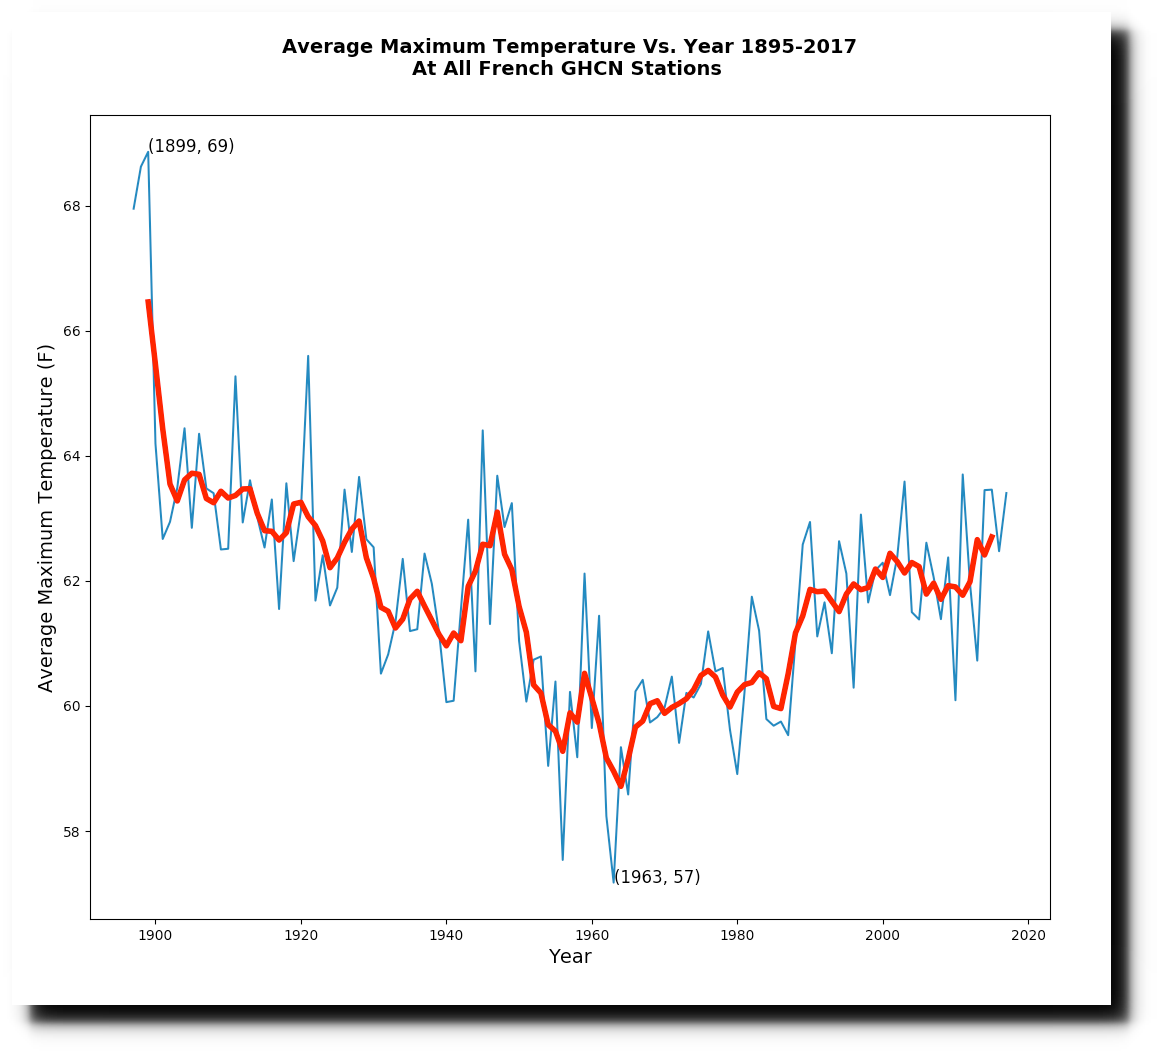
Same story with France and the 2003 heatwave. There is no indication that heatwaves are increasing in France, and 15 years later there hasn’t been a repeat.

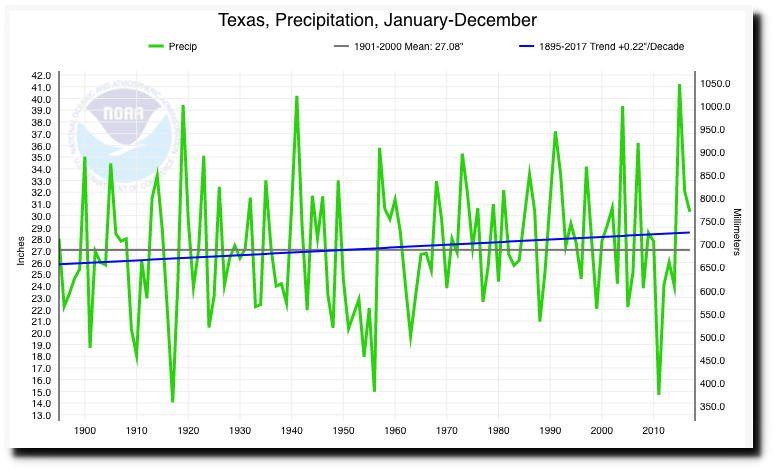
Texas and Oklahoma have been getting wetter, not drier, and the 2011 drought was an outlier. Since then they have had their wettest year on record.
Climate at a Glance | National Centers for Environmental Information (NCEI)

Climate at a Glance | National Centers for Environmental Information (NCEI)
The frequency of hot days in Texas and Oklahoma has been declining, and 2011 was an outlier.
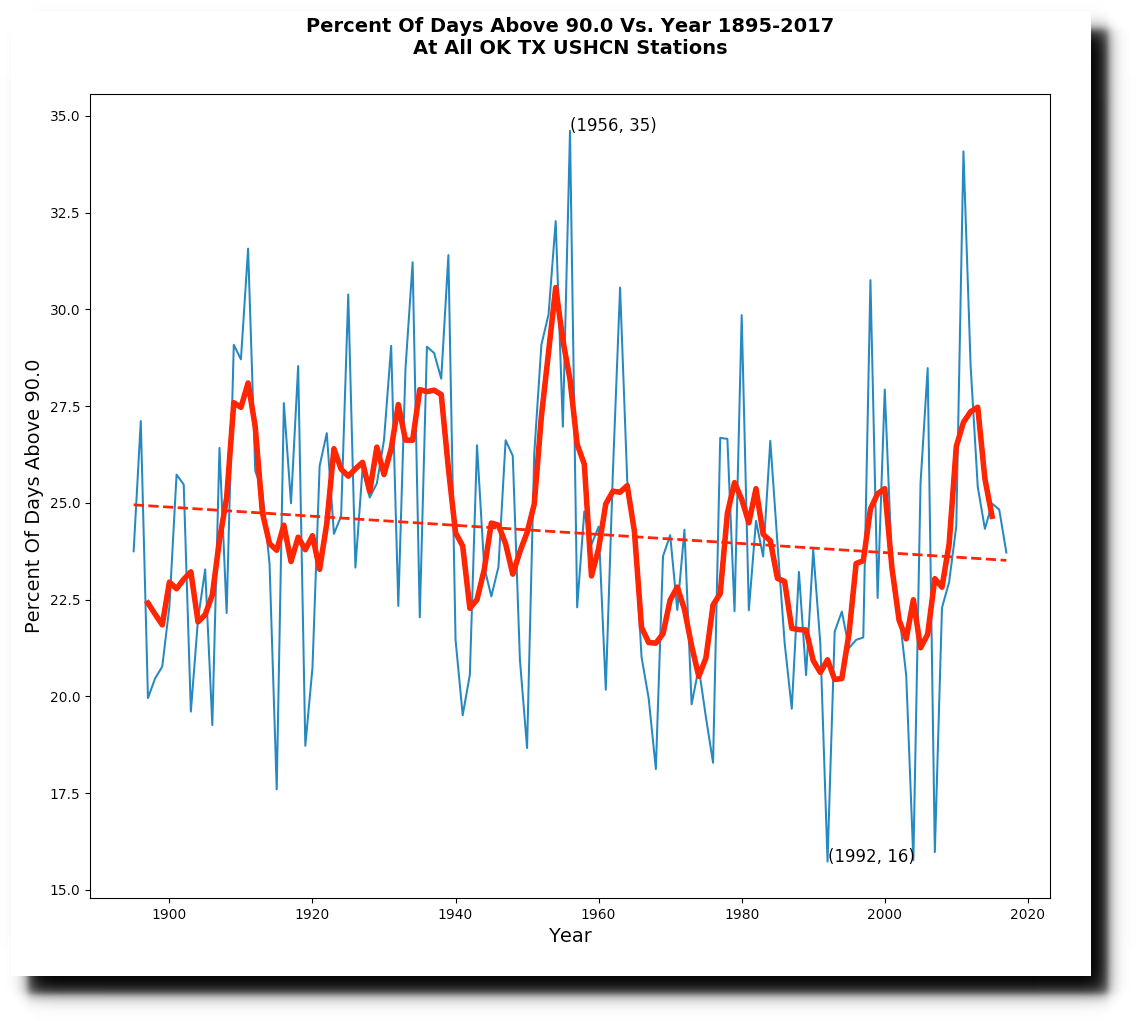

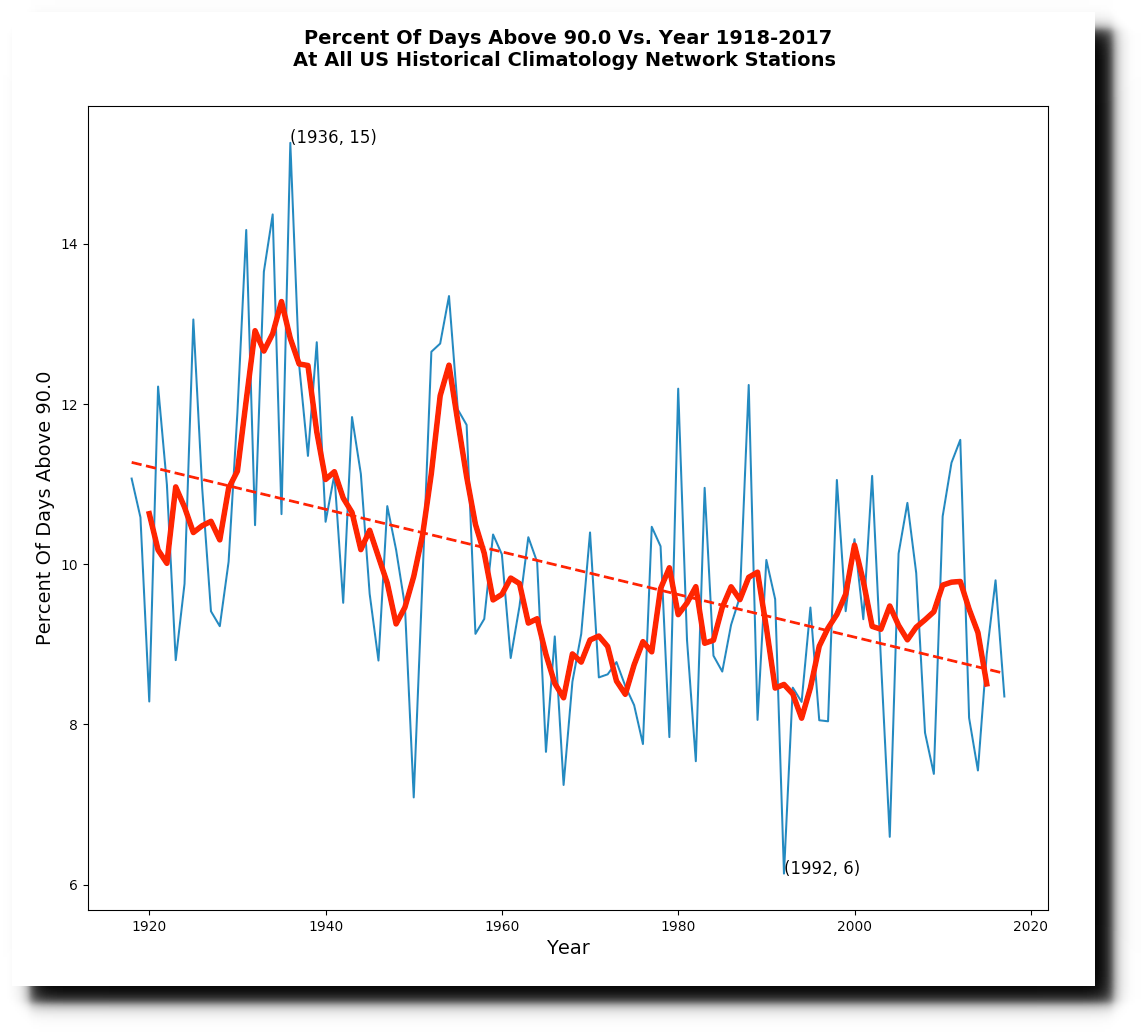
For the US as a whole, maximum temperatures and the frequency of hot days has been declining for the past century, and 2012 was an outlier.

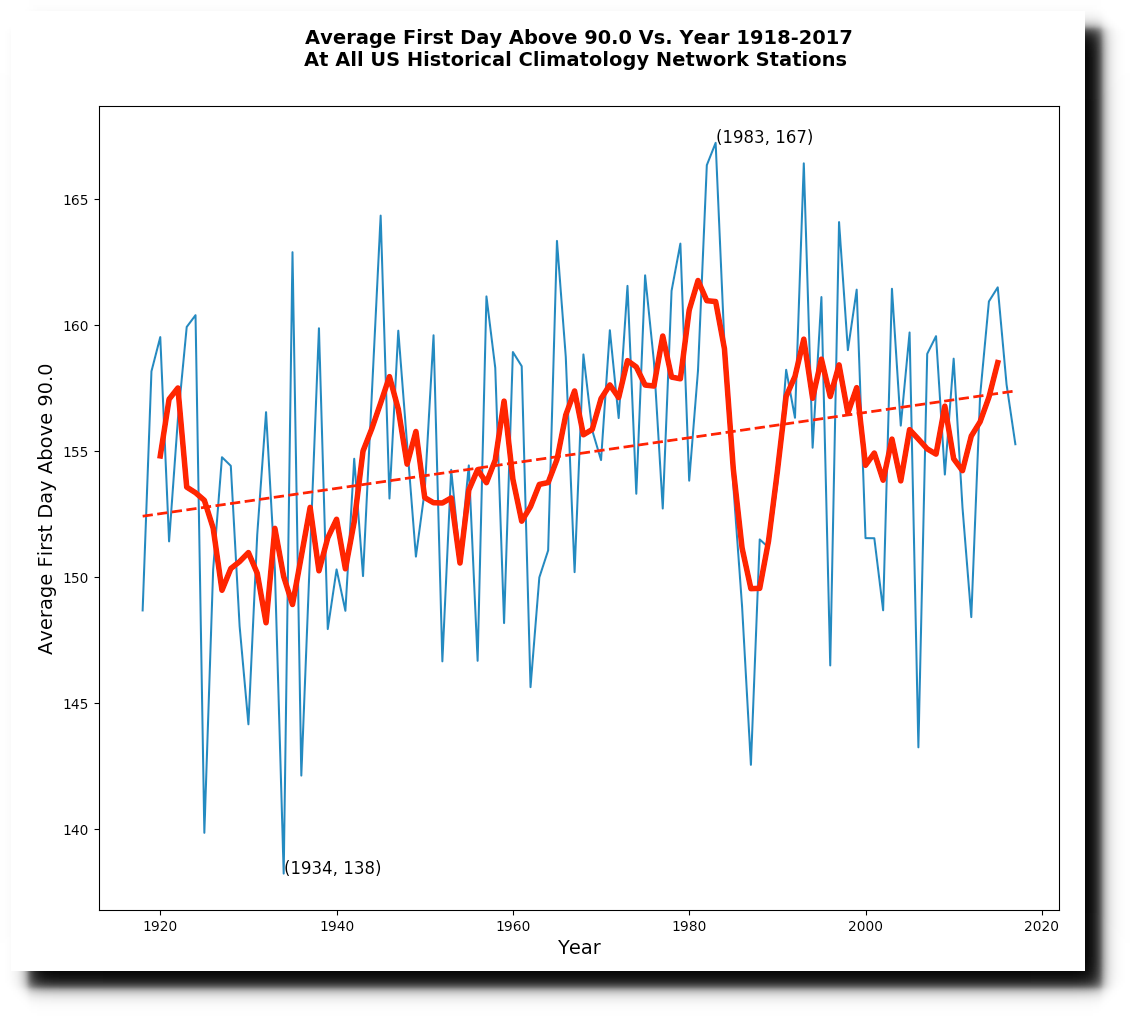
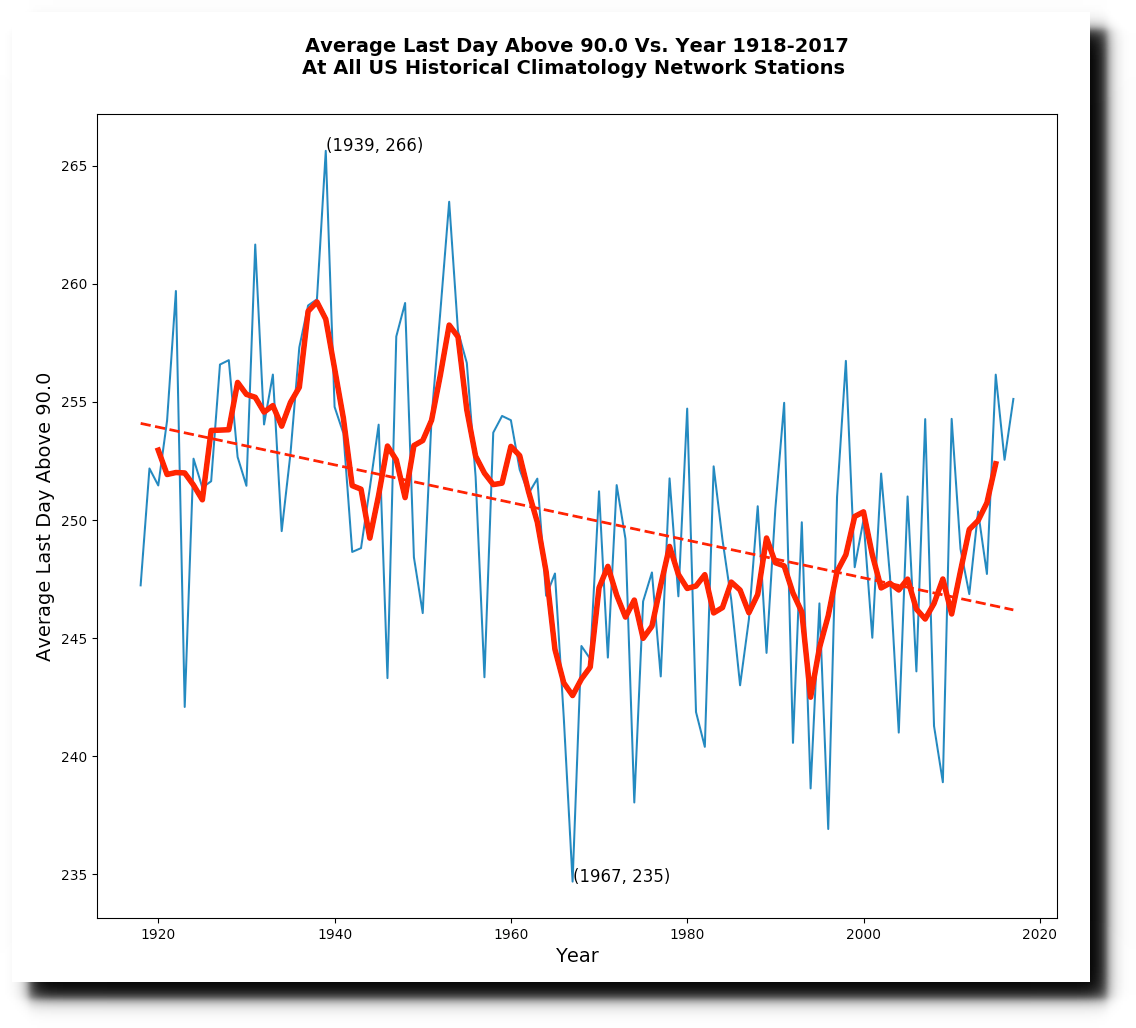
The first day above 90 degrees has been getting later in the US, and the last day above 90 degrees has been getting earlier.
Climate scientists are ambulance chasers who rush to the scene of a heatwave and declare it to be the new normal. There is no evidence to back up their claims, and when the weather turns cold they blame that on global warming too.
Climate science is a corrupt, rotten, dirty clown show – and has no basis in reality or science. It is a group of people extorting billions of research dollars by frightening children.
This week in 1936, much of the Eastern US was underwater. My grandfather was evacuated from a meeting in downtown Pittsburgh by boat.
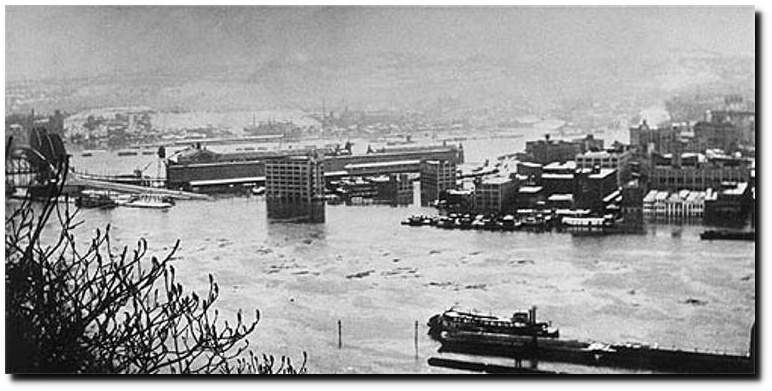
20 Mar 1936 – ALL EASTERN AMERICA UNDER FLOOD WATERS
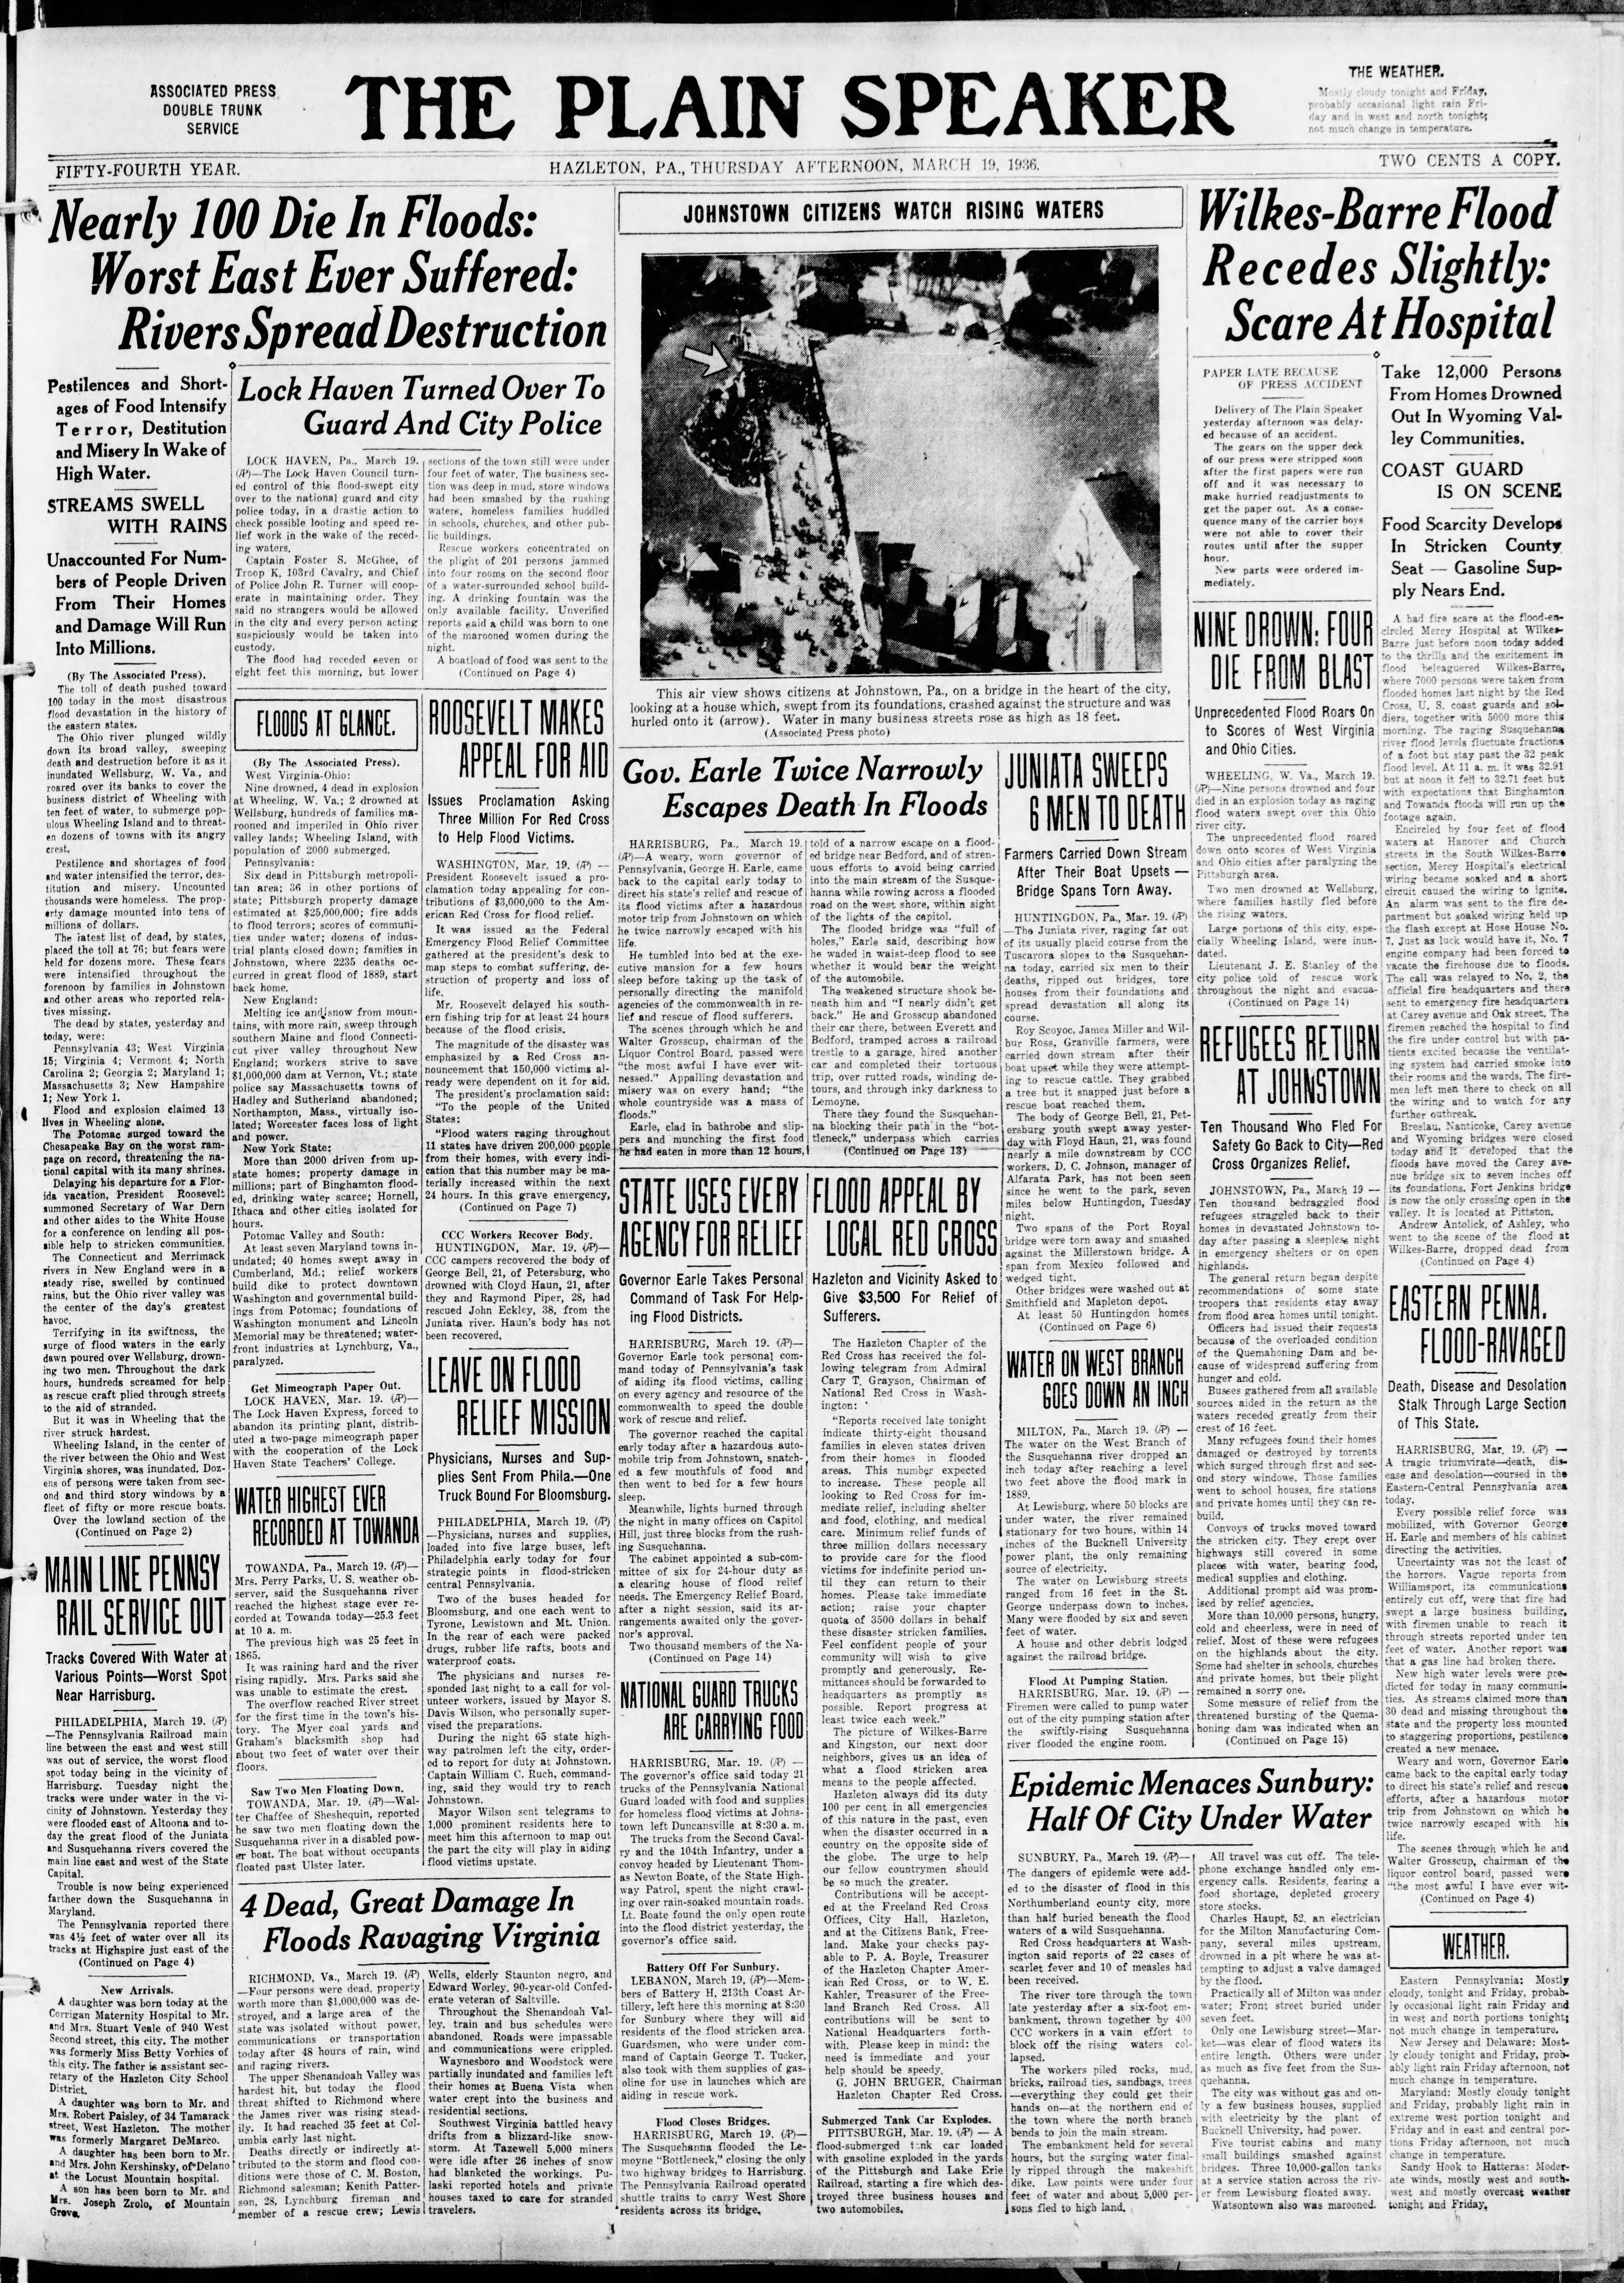
19 Mar 1936, Page 1 – The Plain Speaker at Newspapers.com
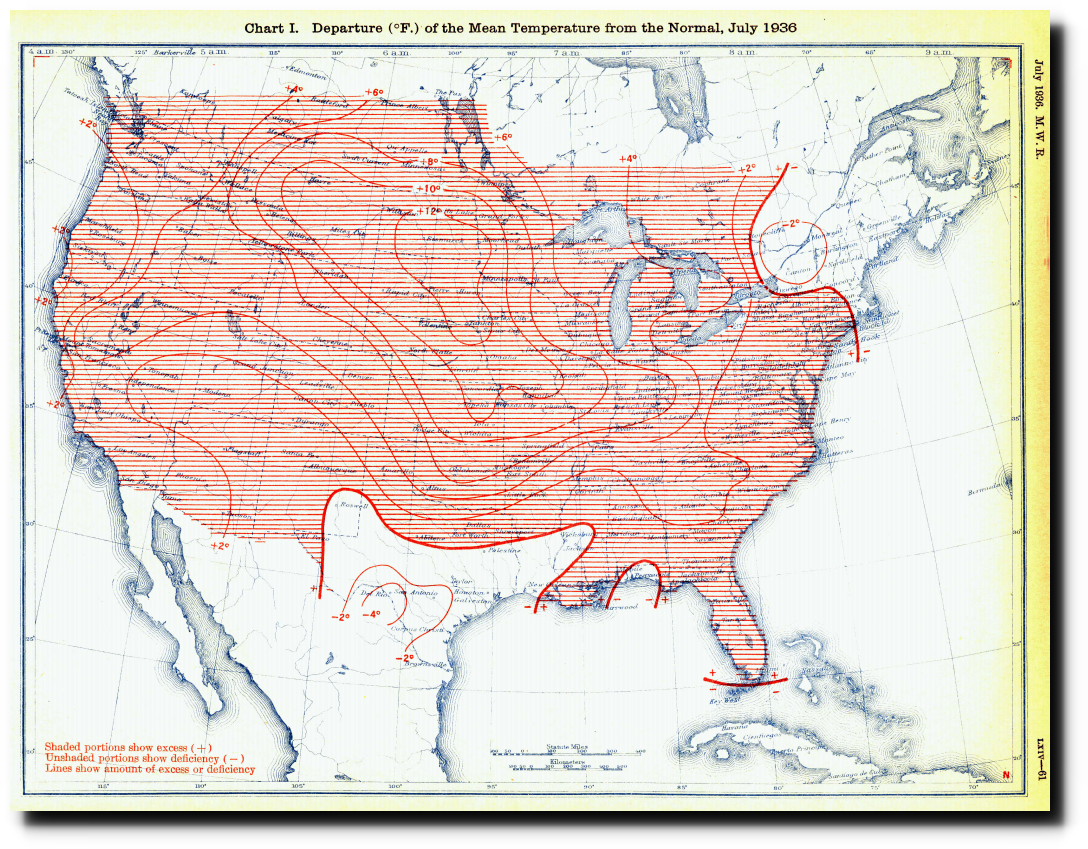
This came after a record cold February, and before the hottest summer in US history.


The Bulletin – Google News Archive Search
April of 1936 also brought one of the worst tornado outbreaks in US history.


11 Apr 1936, Page 1 – Weekly Town Talk
Claims that the climate is becoming more severe have no scientific basis, and instead are based largely on fraudulent NOAA data.
March of 2012 was very warm, and that was blamed on global warming.
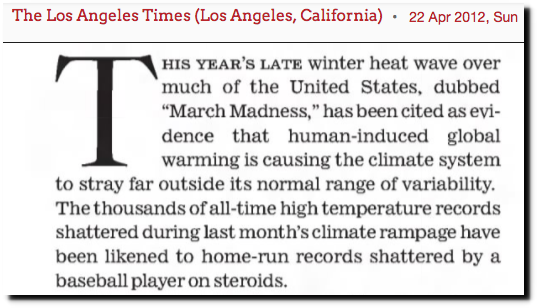
22 Apr 2012, Page 22 – The Los Angeles Times at Newspapers.com
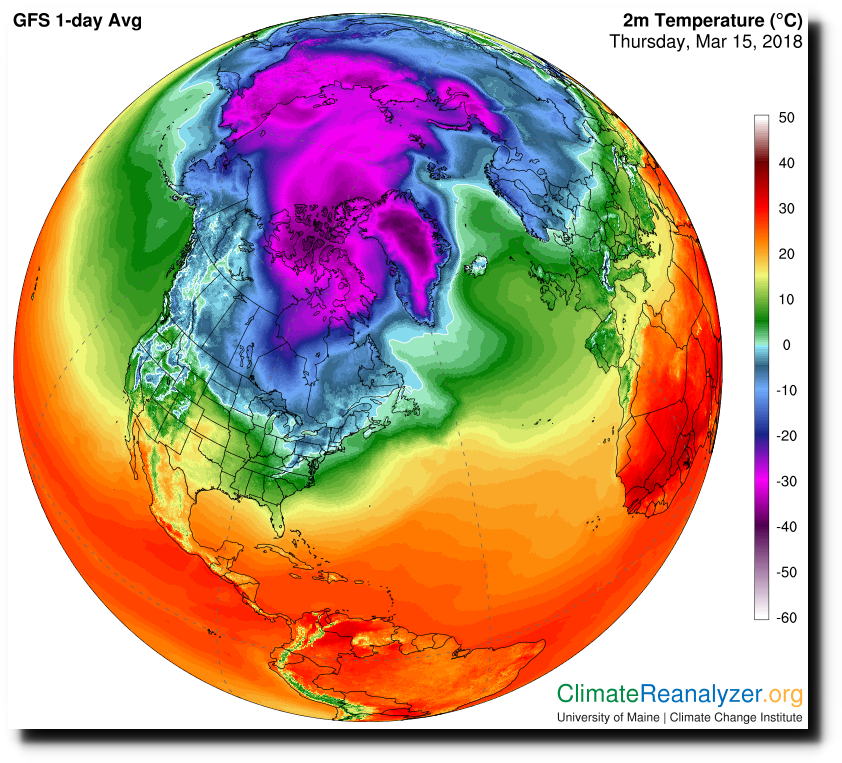
March of 2018 is very cold, and that is also being blamed on global warming.
Regardless of what the weather is, the global warming cult sees it as a sign of the coming climate apocalypse. And the adherents to this religion are simply too stupid to understand what is wrong with their thinking.
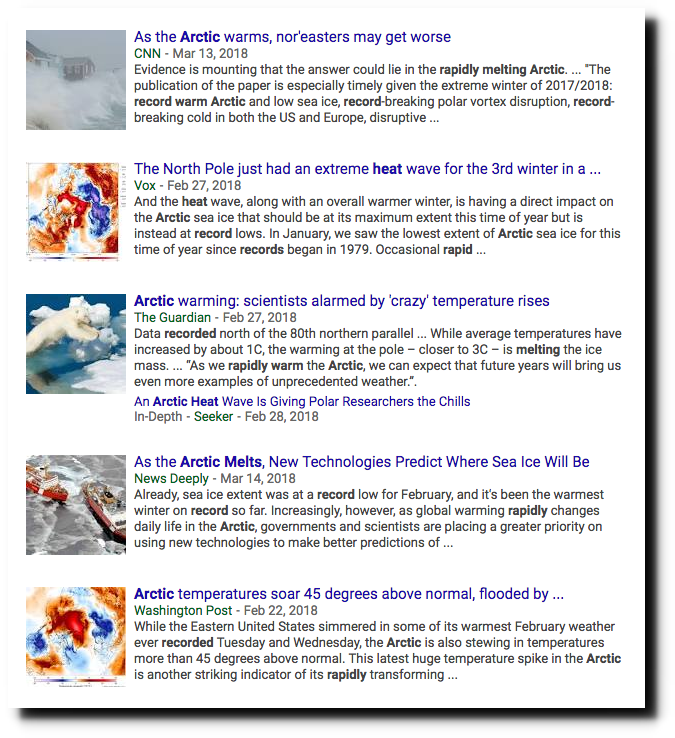
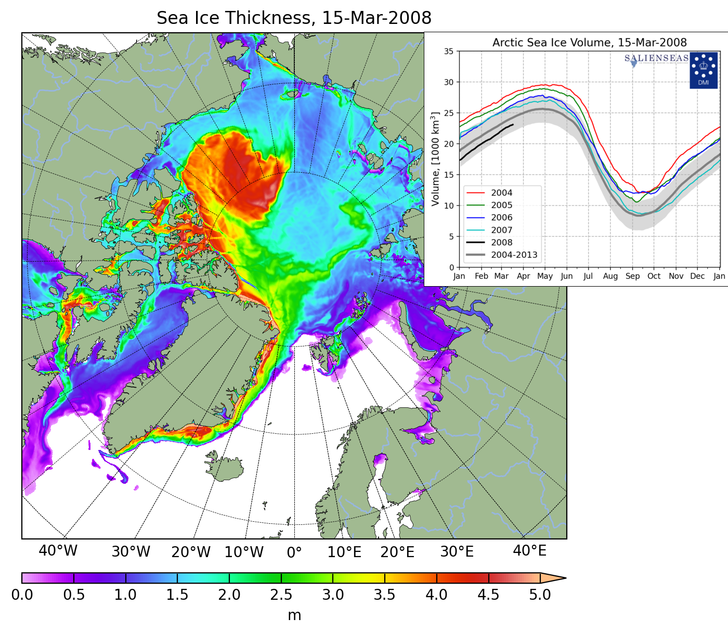
According to climate experts and the fake news press, the Arctic is record hot, and is rapidly melting.
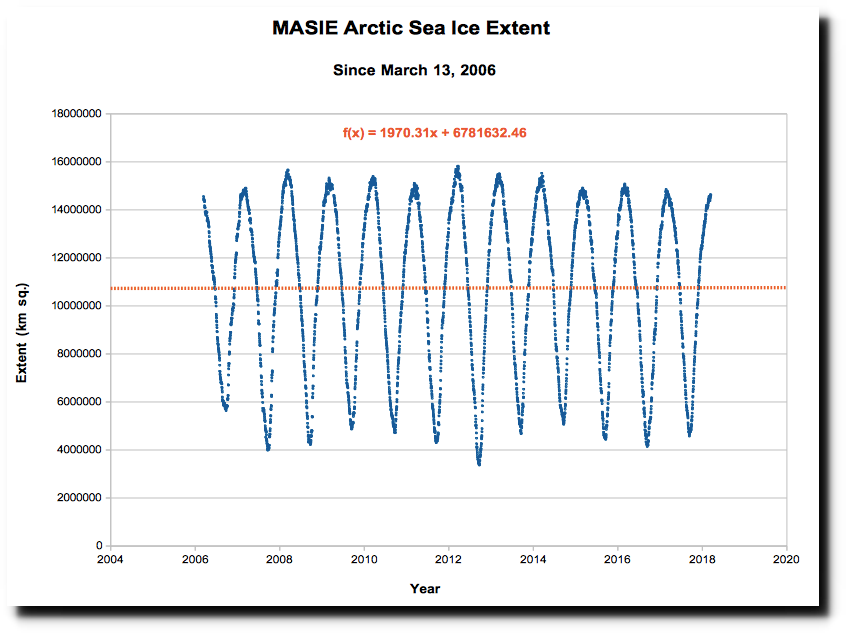
Actual data shows that their claims are fraudulent. There has been no trend in Arctic sea ice extent since the start of MASIE records in 2006. The graph below shows the trend line in red from the 2006 peak to the 2018 peak.
Sea ice volume is nearly identical to ten years ago (23,000 km³) and thick ice covers much more of the Arctic than it did ten years ago.
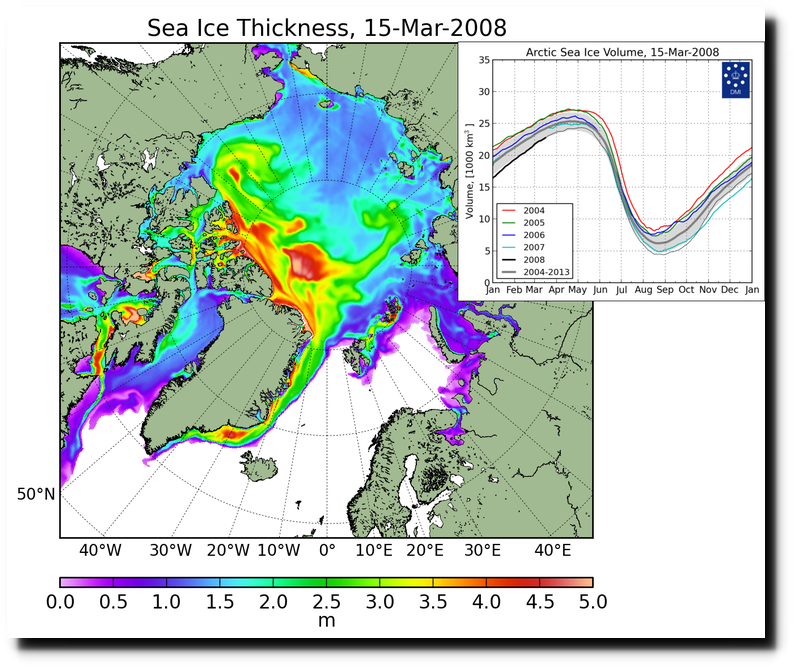
CICE_combine_thick_SM_EN_20080315.png (758×631)
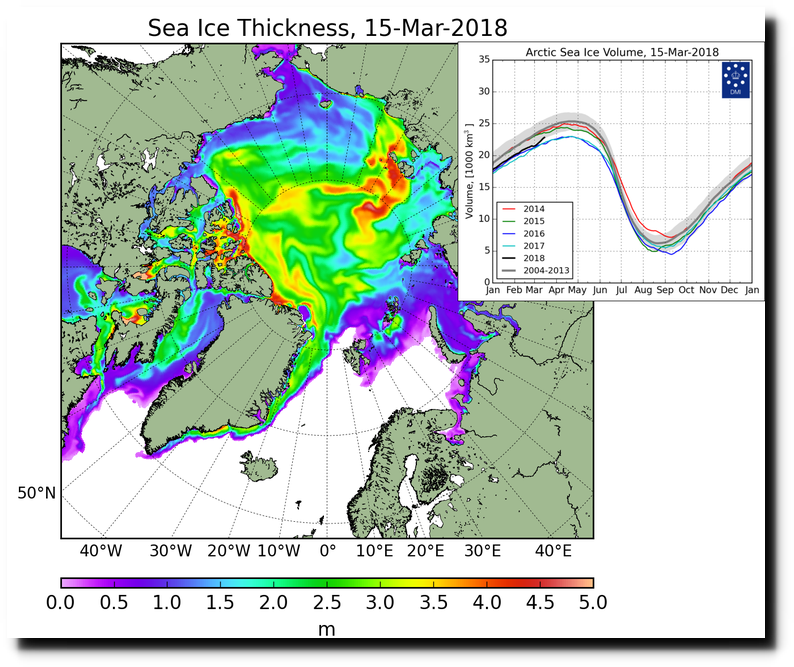
CICE_combine_thick_SM_EN_20180315.png (758×631)
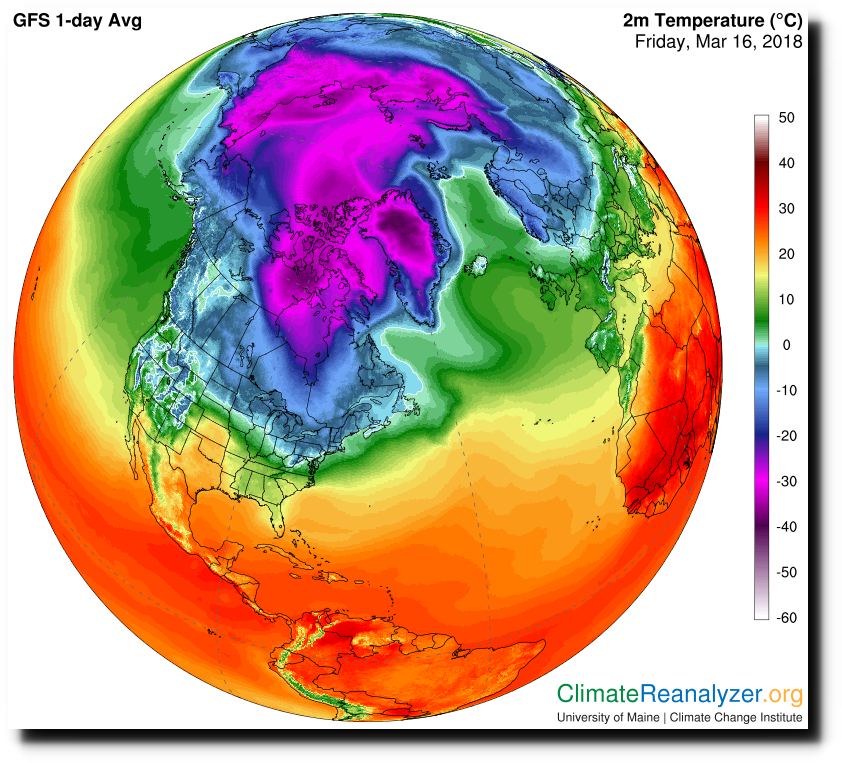
Temperatures in the Arctic are very cold, and the cold Arctic air is spilling down into the Eastern US, where we are having a record cold start to spring.
As far as I can tell, every claim made by climate alarmists is completely fraudulent.
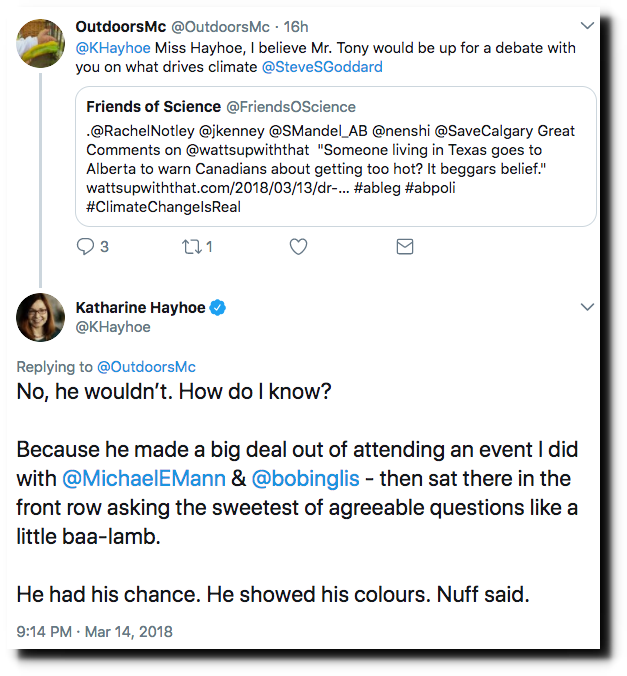
I wonder if she twitter blocks all sweet and agreeable people?
“Science is the belief in the ignorance of the experts”
- Richard Feynman
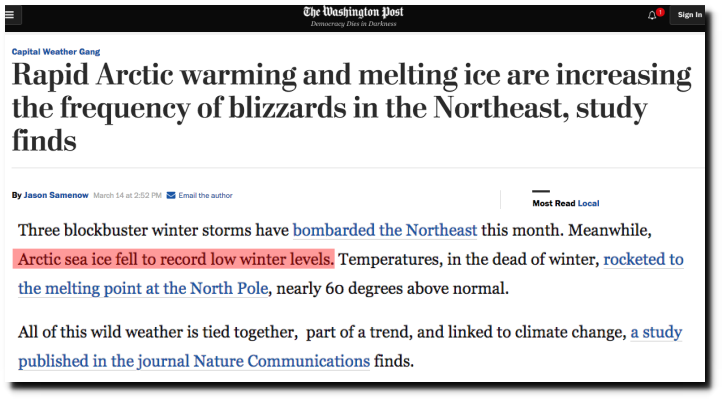
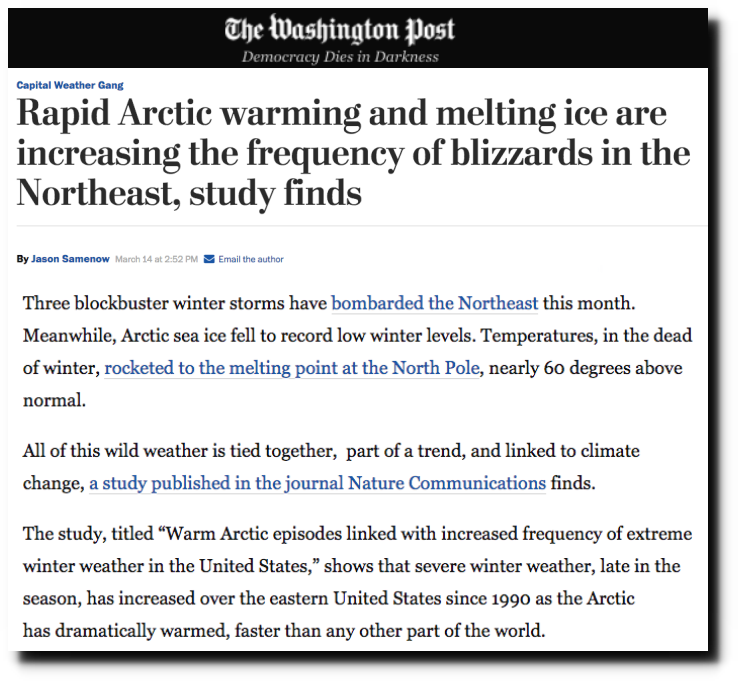
The Washington Post says Arctic sea ice is shrinking, is at record low levels, and it is causing the cold, snowy March here in the Eastern US. They also say the North Pole is 0°C and melting.
Meanwhile actual Arctic sea ice is growing, extent is highest in three years, and close to where is always is this time of year.
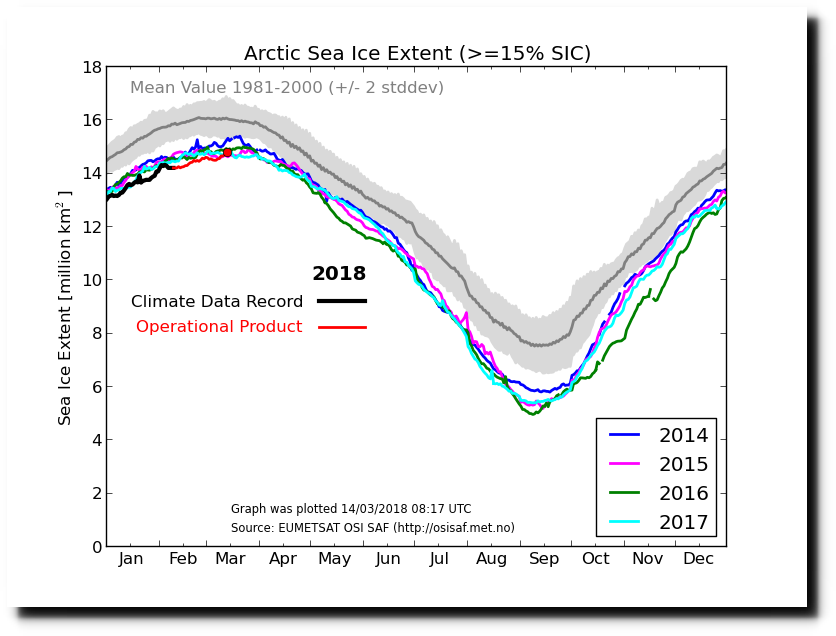
Ocean and Ice Services | Danmarks Meteorologiske Institut
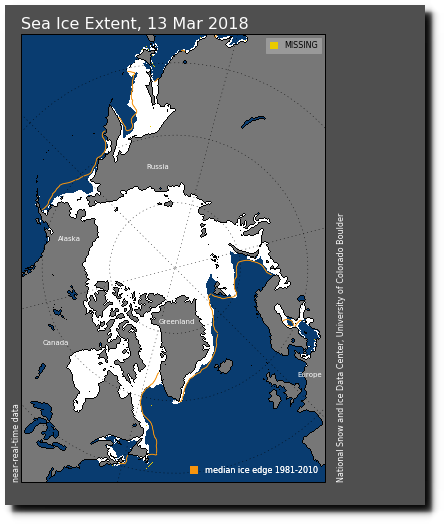
The ice edge is very close to the 1981-2010 median.
Arctic sea ice volume is normal, rapidly increasing, and the highest for several years.

Temperatures at the North Pole are -30°C, which the Washington Post apparently believes is the melting point of water.
Six years ago, the Washington Post said global warming would make cherry trees blossom in January. Now they say global warming causes long, cold, snowy winters.
Could cherry blossoms one day be blooming in winter? – The Washington Post
Before big March snowstorms were caused by global warming, they must have been caused by cold. This is what New York looked like 130 years ago today.
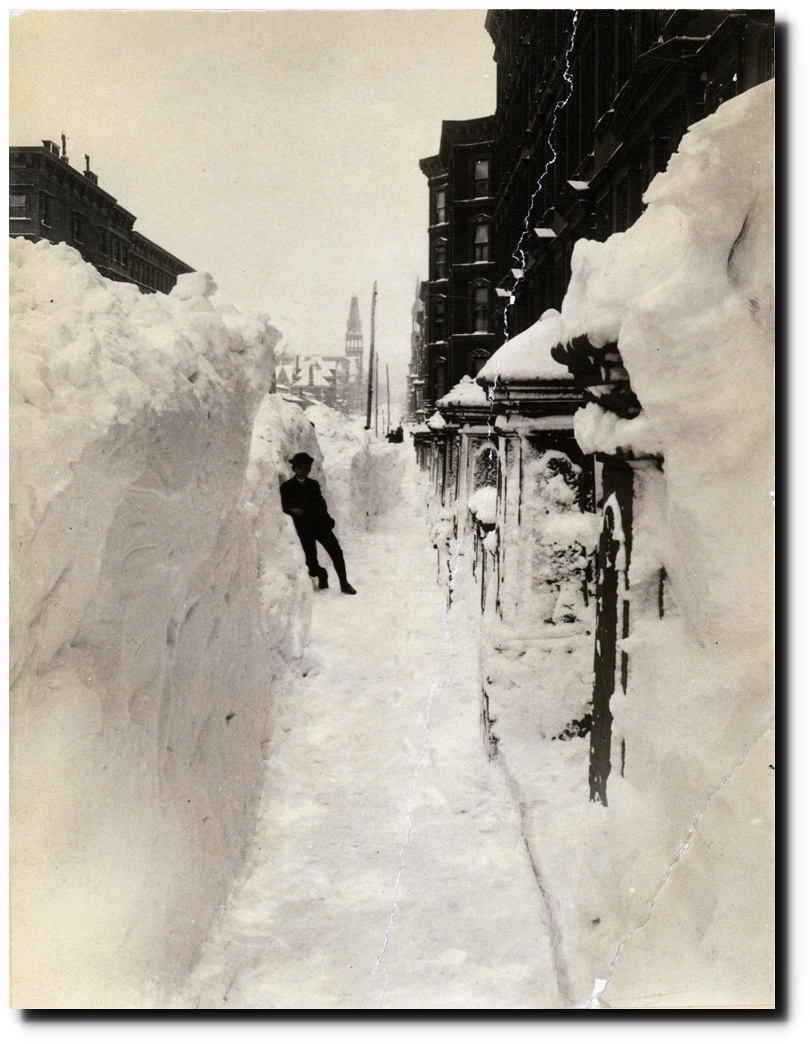
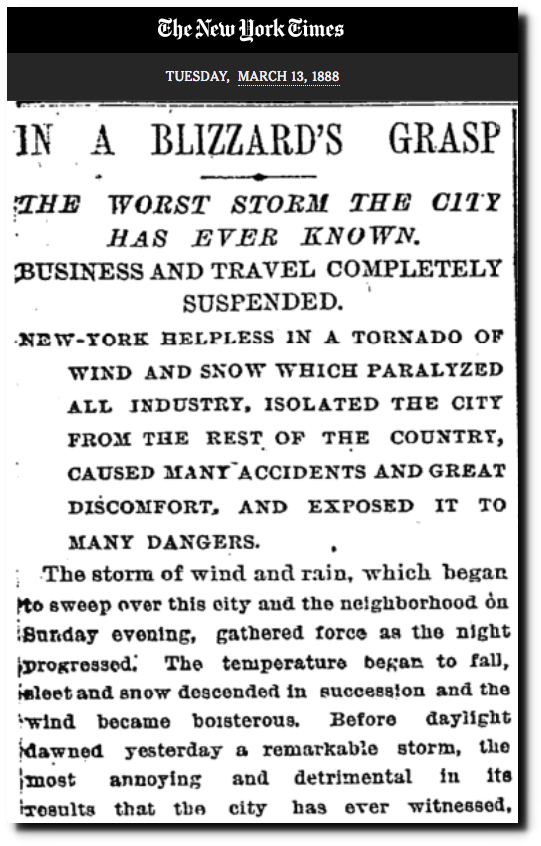
TimesMachine: March 13, 1888 – NYTimes.com
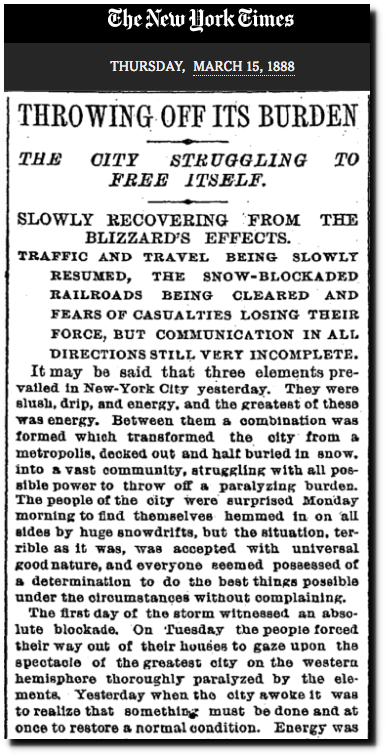
TimesMachine: Thursday March 15, 1888 – NYTimes.com
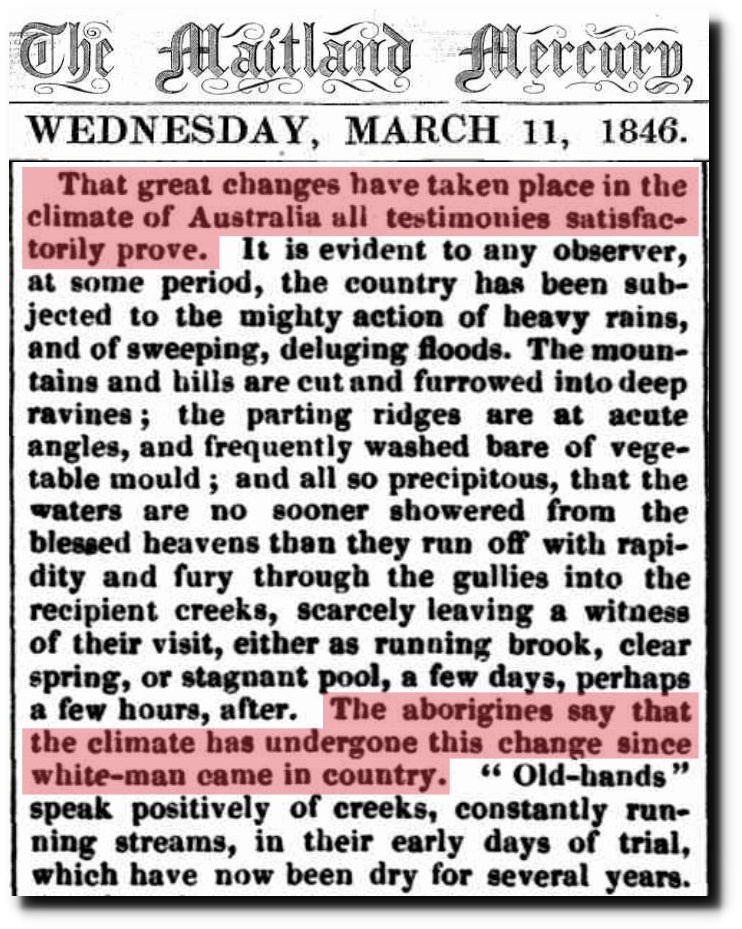
Climate science is based on the principle that whatever the weather is, there must be a way to blame it on on humans. The same fake news since 1846.
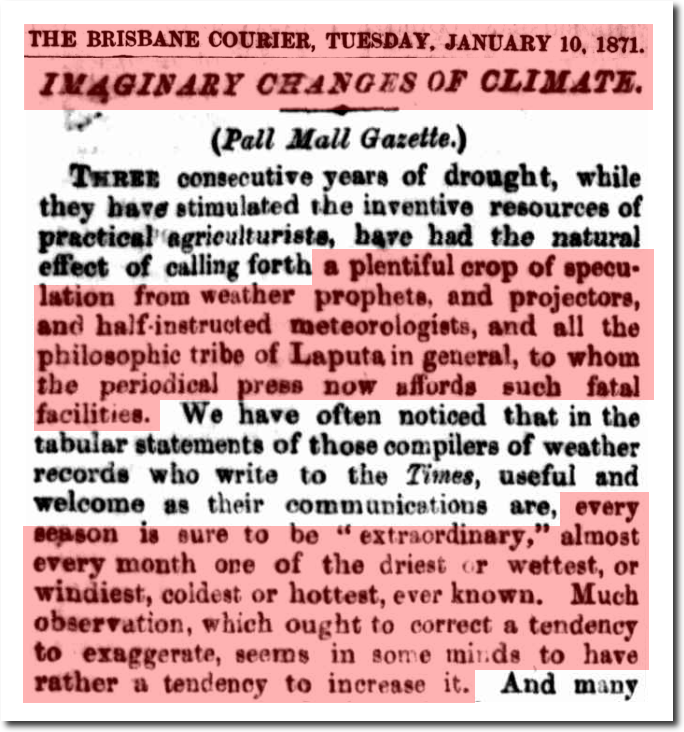
10 Jan 1871 – IMAGINARY CHANGES OF CLIMATE
