
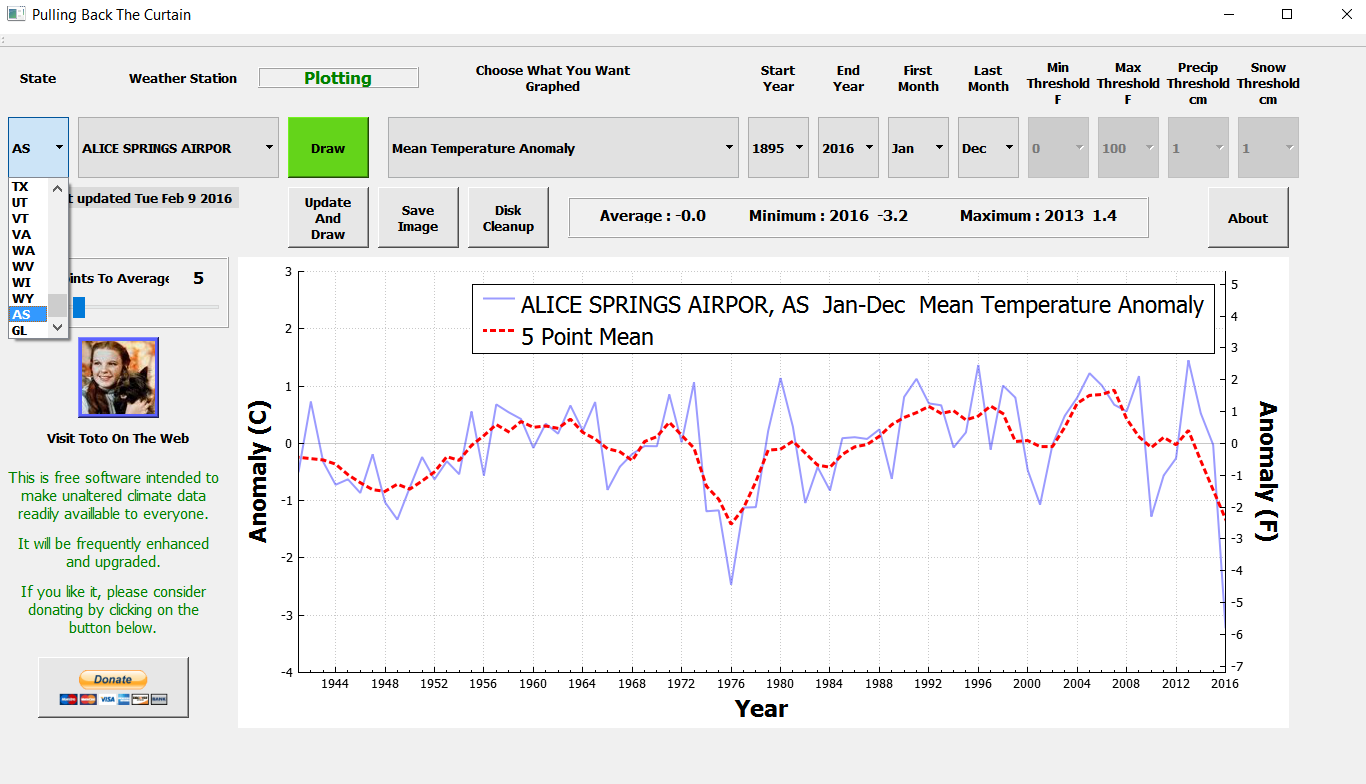
Select AS for the state selection (below WY) and more than 1,000 Australian stations will appear.
Download : PullingBackTheCurtain version 1.2
Select AS for the state selection (below WY) and more than 1,000 Australian stations will appear.
Download : PullingBackTheCurtain version 1.2

Thanks a lot Tony 🙂
No problems with download or operation down here.
What actual data does it access for Australia?
All of the GHCN data for Oz
Now that is amazing.
Kudos Tony,
This is gonna make swatting climate alarmists so much easier.
Awesome work!
Cheers
excellent app; it appears that Summer time temps are drops here in Wisconsin; thanks + donation on the way
Reblogged this on Climatism.
This a great breakthrough for us in Australia!
Slightly O/T, but:
I managed to get it running using wine on linux. I had to install qt5.5 in wine, but once I did, the executable runs. I have to run it in a large virtual window (basically a full screen virtual window), for some reason it doesn’t resize well in anything smaller, but other than that, I can plot temperatures and save images.
Thanks Tony!
It isn’t designed to resize, so it sounds like it is fully functional.
OK, thanks, that’s good to know. Looking forward to trying out the newest version
Might I suggest that you use the ISO 3166 country code (AU) for Australia ? AS is American Samoa.
Good suggestion, IMO. This tool is potent, but the devil is always in the details.
Another suggestion. The Steriou and Koutsoyiannis 2012 European GUA presentation contained about 165 GHCN stations globally (by GHCN number) that met certain very selective criteria: a century of data, <10% missing records, <4 missing years…IIRC. Ref and link in essay When Data Isn't, using De Bilt and Sulina in Europe as the essay examples. That is a special station group. The paper ( and underlying thesis) proved that GHCN homogenizarion is biased high. Perhaps atnsome point that entire global group of GHCN stations could be added to the tool as a named group– long runners,or something. The presentation is on line at itia.ntua.gr/en/docinfo/2012
Great work. I’ve been graphing Australian data from http://www.bom.gov.au/climate/data/ Alice springs seems to correlate nicely. The site does state this data is adjusted though. You’re probably aware unadjusted Canadian data is available from http://climate.weather.gc.ca/data_index_e.html.
It would be nice to have a reference as to the data source in the app, plus comments about data purity (adjusted or not).
Again, great work.