Regardless of any temperature trend, inter-annual variability seems to have been adjusted out of existence. The same thing in Norway and Texas.
Either the data has not been properly homogenised, despite the fact that all the adjustments are supposed to do just that, or else the claim that climate change is leading to more extreme weather is complete and utter bollocks……..

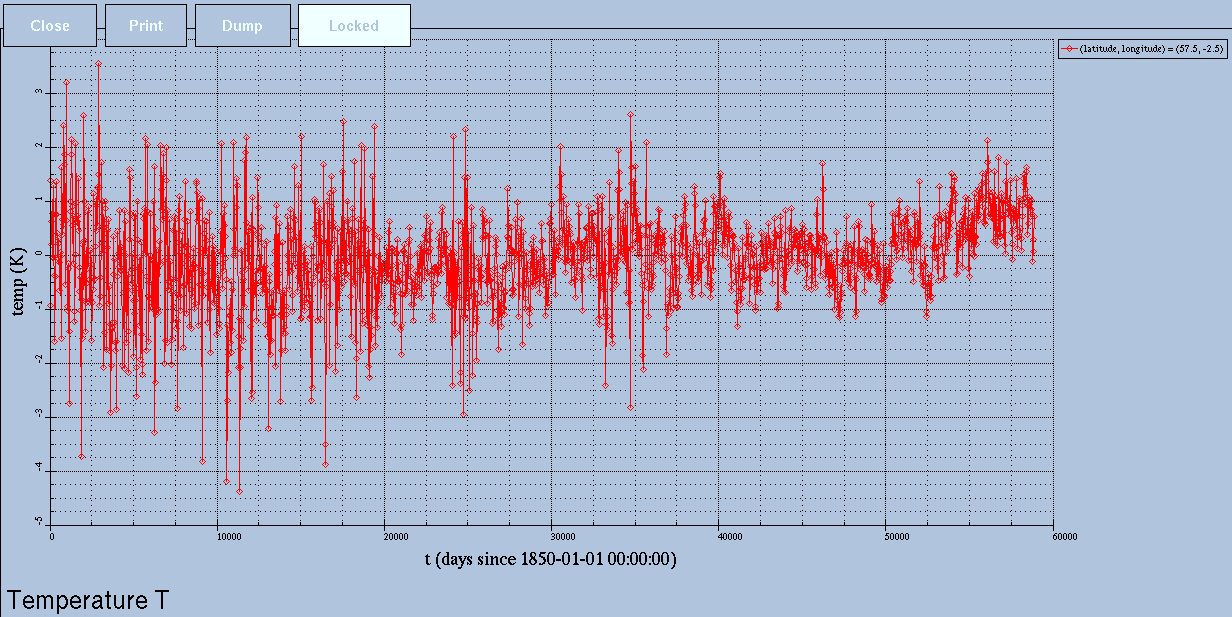


Regardless of any temperature trend, inter-annual variability seems to have been adjusted out of existence. The same thing in Norway and Texas.
Either the data has not been properly homogenised, despite the fact that all the adjustments are supposed to do just that, or else the claim that climate change is leading to more extreme weather is complete and utter bollocks……..
Here is a nice example of what so called “homogenisation” can do:
http://www.meteoschweiz.admin.ch/web/de/klima/klima_heute/homogene_reihen.Par.0054.DownloadFile.tmp/vergleichoriginalhomogen.pdf
See Sion (SIO) on page 4
The Swiss are very afraid of the isothermic warming of the earth and have already passed new taxes to “fight” it.
It’s actually Wisconsin, not Texas, that also shows a marked decline in inter-annual variability.