

Disrupting the Borg is expensive and time consuming!

Google Search
-
Recent Posts
- Bullseye!
- It’s Getting Closer
- Greenland Meltdown Scam
- Greenland Ice Update
- Wyoming Gold
- Three Years Since The Apocalypse
- Arctic Report card Summer 2026
- Elon Pushing Pushing Geoengineering
- Earth, Wind And Fire
- On The Road Again
- Vandalism At The Reflecting Pool
- Fifty Years Ago Today
- Truth Or Consequences
- US Climate Trend Maps
- Declining Spring Snow Cover In Northern New Mexico
- You Can’t Fool Mother Nature
- Cattle And The Climate
- One Atomic Bomb Per Hour
- New Video : Analyzing Oil And Gas
- Is Antarctica Melting?
- High Speed Analysis And Visualization
- El Nino To The Rescue?
- Fake News Update
- Growth Of Antarctic Sea Ice
- 65 Years Of Progress!
Recent Comments
- Stuart Hamish on Three Years Since The Apocalypse
- Stuart Hamish on Cattle And The Climate
- Stuart Hamish on Cattle And The Climate
- Stuart Hamish on Cattle And The Climate
- Bob G on Bullseye!
- conrad ziefle on Bullseye!
- arn on Greenland Ice Update
- D. Boss on Bullseye!
- D. Boss on Bullseye!
- scott allen on Bullseye!
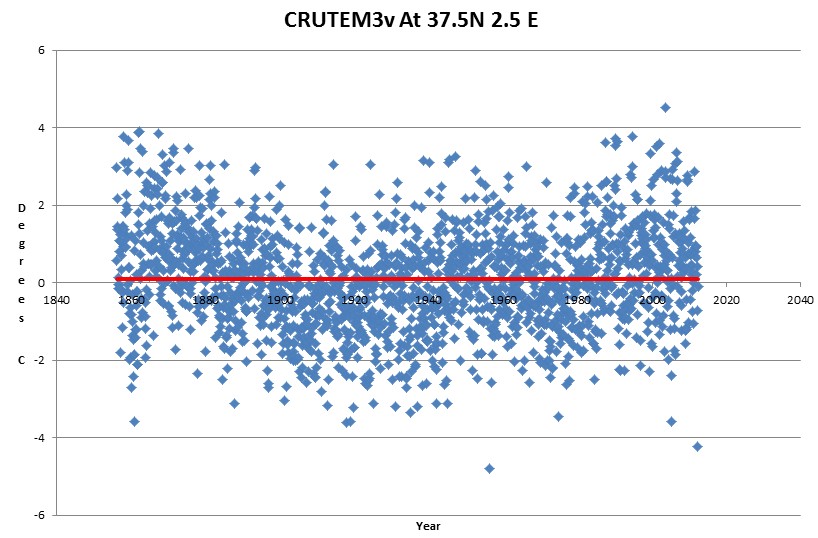
…but a clear rising trend since 1900.
So what made it warmer in the period between 1850 and 1900?
Was it warmer? How many weather stations existed in this grid box at that time? What was their standard of exposure and the quality of their equipment?