Experts tell us that Sandy’s storm surge was caused by missing Arctic ice, but the record storm surge of 1974 was caused by excess Arctic ice.
1974 – Bering Sea Storm
The Bering Sea storm hit Nome, AK, on November 11-12, causing a storm surge of more than 13 feet. Water overflowed from the harbor, went over the sea wall in Nome, and rose to a depth of over 5 feet in the low lying areas of the city. This storm was the strongest in Nome’s 113 years of weather records, producing the worst coastal flooding on record for the region.
Event History: Extratropical – Storm Surge and Coastal Inundation
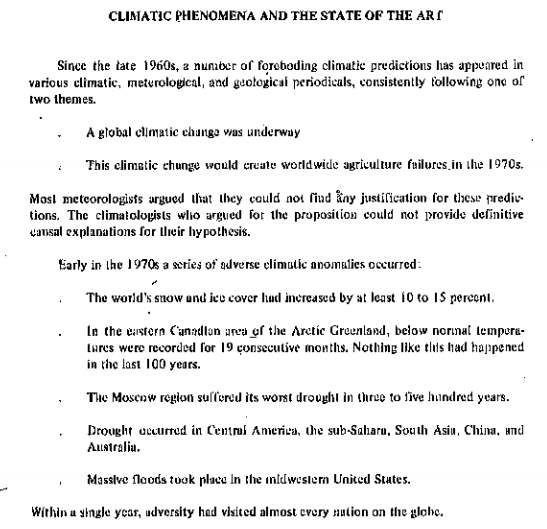
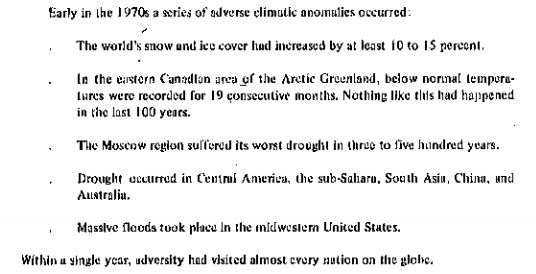
The CIA reported that Arctic ice had expanded by 10 – 15%
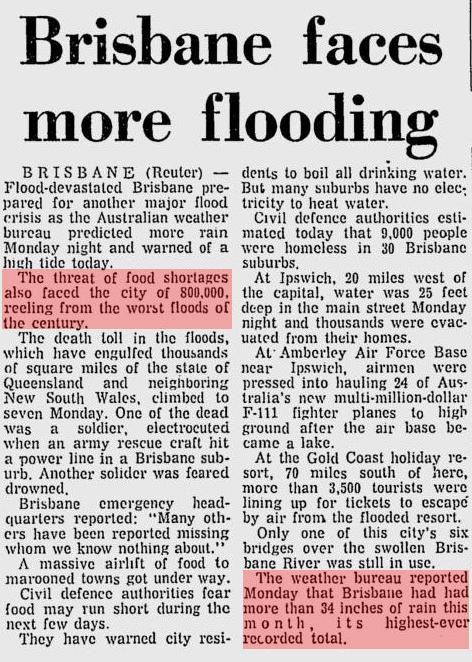
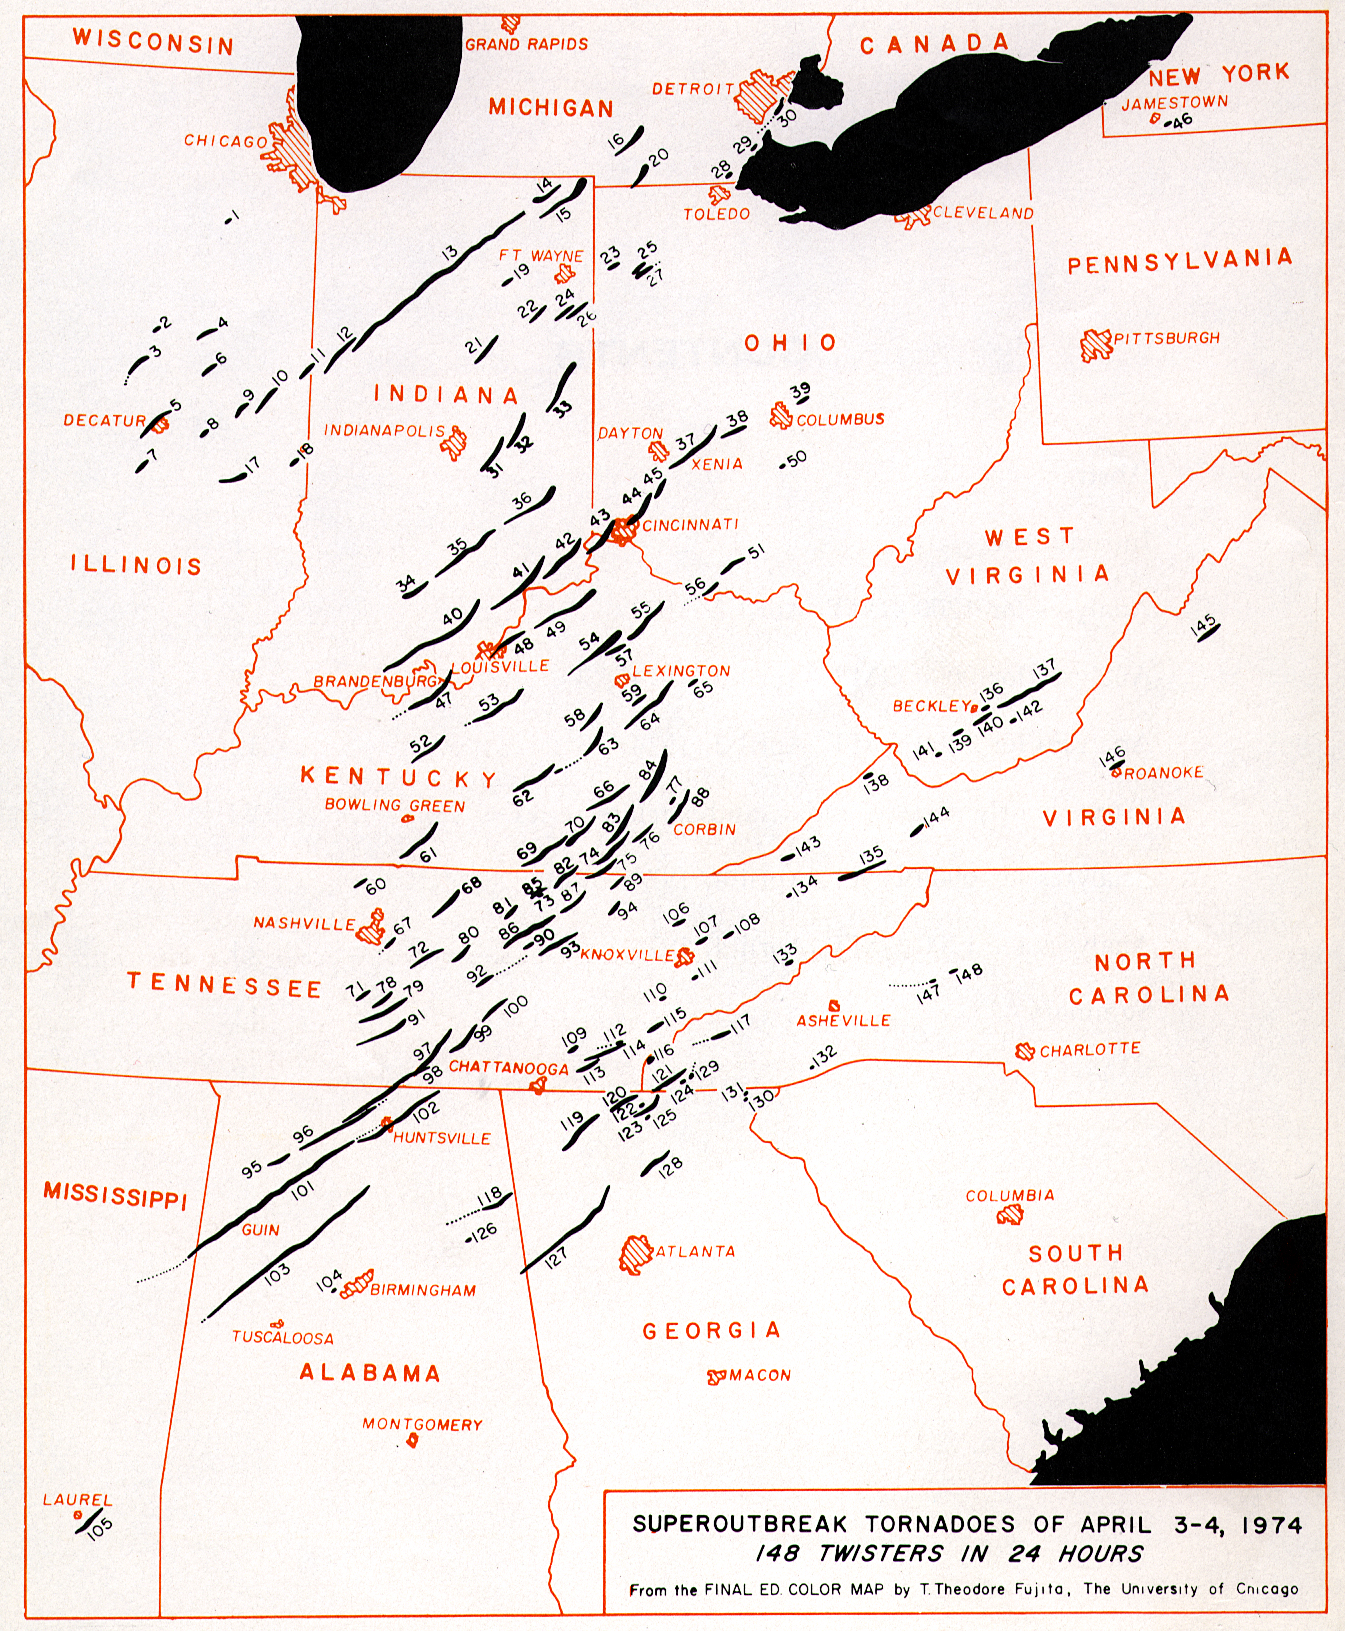
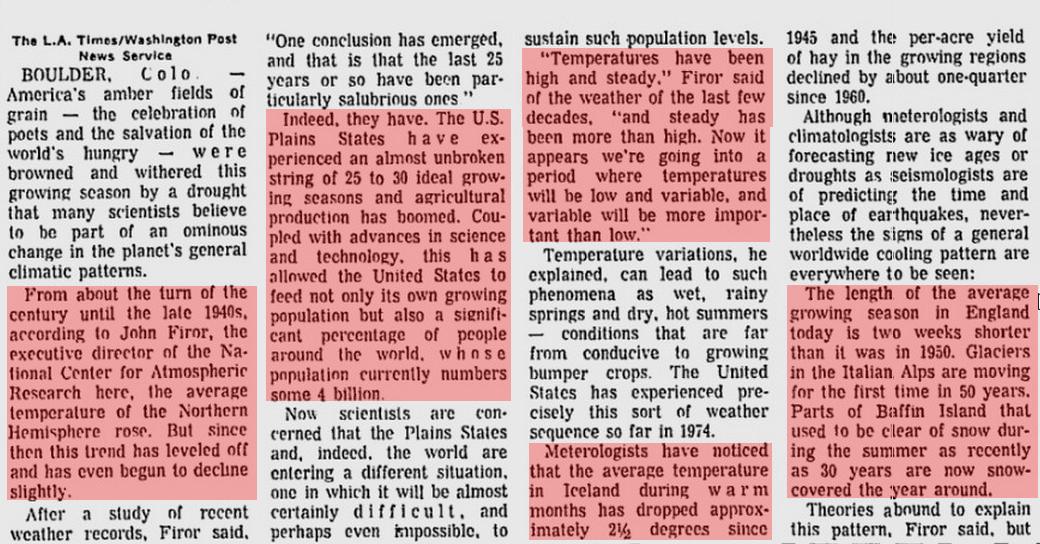
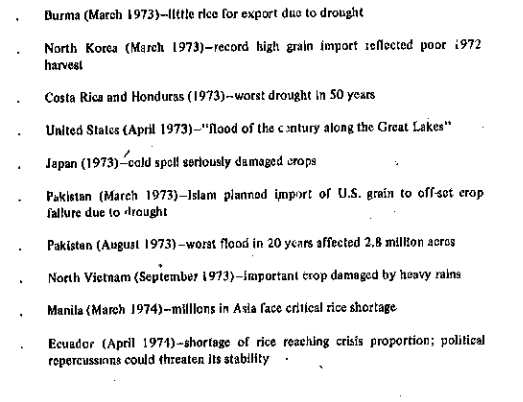
1974 was a very busy year for weather disasters. Scientists blamed them on global cooling.

http://news.google.com/newspapers/
http://www.april31974.com/images/outbreakmaplarge.jpg
http://news.google.com/newspapers/

http://www.climatemonitor.it/wp-content/uploads/2009/12/1974.pdf
http://lwf.ncdc.noaa.gov/img/climate/research/tornado/tornadotrend.jpg



There were mutliple weather disasters for the US corn crop during 1974, flooding spring rain, excessive summer heat and drought and then a record early frost. But in 1974, we were too stupid to realize that straight white males and Ford Pintos were the cause.
The infamous 1974(?) Times Mag graphic of the greatly expanding extent of the Arctic ice cap, also presents that from 1968 to 1974 it was expanding substantially; easily looks like 15-20%, or so.
It strikes me that at some point just prior to this great expansion of the Arctic ice cap, the extent of the ice cap must have been much smaller. Would seem to imply that it had been melting/shrinking prior to that.
Cycles repeat. Cycles withing larger repeating cycles repeat.
Might this be roughly the beginning of (global temps are rolling over the too?) the next either mini, or major, cooling cycle?
The weather is much worse now. Isn’t it?
1974 and 2011 – Flooding in Brisbane. 2012 the wettest 6 months Jan to June since 1974 in Brisbane.
Our Climate Commission promised us never-ending drought only a few years ago – our dams would never fill again.
All the errors simply because they model on a fantasy instead of studying real meterological processes. All of the years when eastern Australia receives large amounts of rainfall are La-Nina years – 3 this century alone 2001, 2011, 2012 with widespread flooding – all the rest are either average or El-Nino mini droughts.
Why study a harmless gas with unremarkable properties that doesn’t undergo any form of phase change at ambient temperatures when there is water – the obvious driving force in weather – only an idiot can ignore the obvious.