This post is going to stay on top of the blog for a while.
All of the claimed warming in the US is due to data tampering.
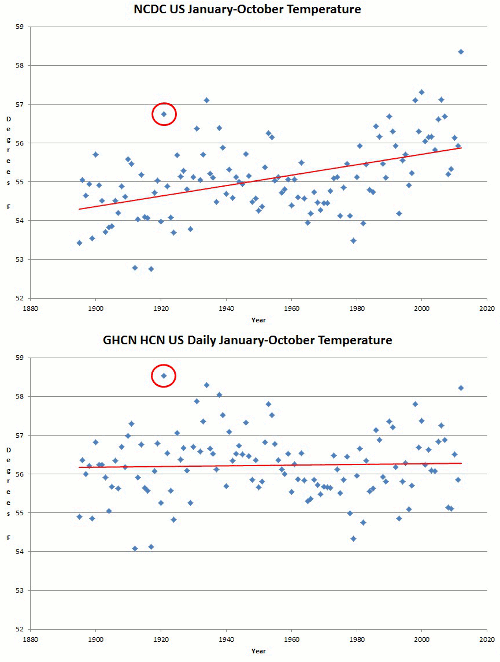
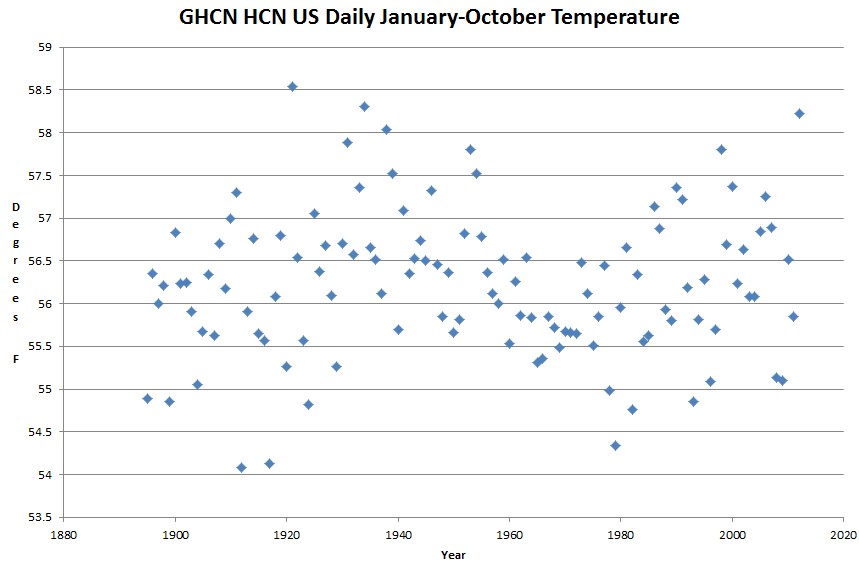
After a cold October, thermometers show that year to date temperatures in the US are third warmest – after 1921 and 1934.
ftp://ftp.ncdc.noaa.gov/pub/data/ghcn/daily/hcn/
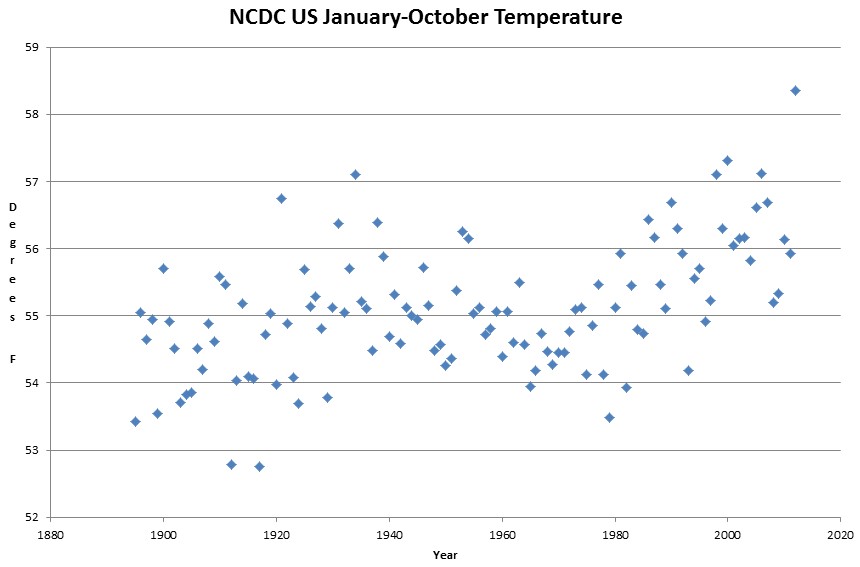
However, NCDC reports that 2012 YTD is by far the warmest.
CONTIGUOUS UNITED STATES Climate Summary
They accomplished this by cooling 1921 almost two degrees relative to 2012
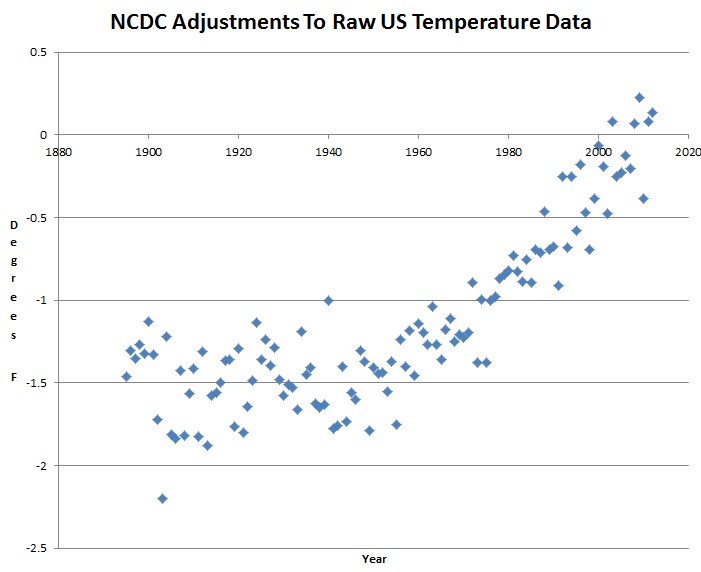
The US government has beaten and abused the US historical temperature beyond recognition. These adjustments are about 4X larger than what is published in the USHCN literature.
At the end of the year, NCDC will announce that 2012 is the hottest year ever, and no mention will be made that this is not the measured thermometer data.
It is maddening paying taxes to a government which lies about everything.


A place in Hell, reserved.
Hell is also frozen, as Dante’s Inferno states wisely.
Even more troubling, just as a scientist, is the narrowing of the temperature variation between about 1955 and 1975 (clearest in the first figure above). I don’t believe that is real (or equivalently, the wider variation on either side of that period is not real) — and I no longer believe, unconditionally, any temperature data being put before the public.
As for the lies — when people choose not to see the lies hitting them every day, in every way, they are lost. I won’t belabor the unavoidable consequences here.
And if you think today is bad, just wait. When King Barry fourth term is completed and elections are a quaint notion from the past, Queen Malia will be crowned and you will all be forced to worship.
If at some point in the past, when they started making these adjustments they thought that they’d made the right alterations to produce a valid figure, how do they justify the adjustments that they make after that date?,
Steve, please repost one of those charts that show temps and then just the “adjustments”. Or a link to one posted before.
Thanks.
Doesn’t this post show that?
Yes it does, but I wanted to show some middle school kids one of the graphs with nothing on it but the “adjustments”. You know, the kind that looks sorta like an exponential curve. (I think I see they are all linked on at the top of the front page and I wasted your time anyway.
Sorry for that.
Meanwhile over in Reykjavik, GHCN have added 0.8C to the warming trend AND THEN GISS have added another 0.5C to allow for UHI.
Yes, you read that right. GISS UHI adj has ADDED to the warming trend, instead of REDUCING it.
http://notalotofpeopleknowthat.wordpress.com/2012/11/09/giss-double-up-on-reykjavik-temperatures/
That is exactly what happens, as Ed Long found some time ago. If there is no trend they don’t subtract UHI from urban temperatures they ‘correct’ rural temperatures by adding it to bring them into line with the cities. And ouila! they have warming where there never was warming.
Here is the link to Ed Long’s analysis.
These adjustments (e.g., TOBS, homogenization, interpolation) are a joke. Note that the cumulative effect of each adjustment always creates a warming trend. Heaven forbid, if the adjusted data showed a cooling trend. If that happened, the global warming priesthood masquerading as scientists would simply keep adjusting until they produced the desired warming signal. What we are dealing with is a mixture of political science and science fiction.
AGW ringleaders like Hansen, Mann, Trenberth, Schmidt and Jones are giving all of science a bad name. They should be held accountable by their peers and by the taxpayers who are forced to fund their unscientific global warming fairy tales. It is clear that some of them have committed fraud on the taxpayers’ dime.
A Hokcey Stick, is a Hockey Stick, is a Hockey Stick. The NCDC Adjustment Graph tells the whole story. The bad part is that very few people understand it, because math is hard.
Why shouldn’t they lie and corrupt the weather data. Their president does it all the time with economic data. Neither group will ever be charged with fraud. Laws don’t apply to leftists and Climate Liars.
Where’s Steve Mosher telling us this is how science is done?
He reminds me of Chris Matthews 🙂
Probabily still giving toshinmack pointers! 😆
David Appell (aka Pinocchio) is asking for help in the comments section.
http://www.washingtontimes.com/news/2012/nov/8/the-next-environmental-battlegrounds/?page=all#pagebreak
Well he is showing himself fer what he is. Activist to the core….. 😆
It is quite humorous to read him complain about “propagandists”, as I’m sure he believes anyone who disagrees with him is one, yet he does not have the balls to admit he is a propagandist.
If they have to make adjustments of 2 degrees or more, that means they’re already waay out on a limb.
And when the bough breaks …?
markstoval says:November 9, 2012 at 10:33 pm
Is this the one you were looking for?
http://i42.tinypic.com/2luqma8.jpg
Speaking of tampering…..
Vote tampering?
http://suyts.wordpress.com/2012/11/10/does-anyone-really-believe-these-results/
Ohio oddities:
https://petitions.whitehouse.gov/petition/recount-election/ZQmy0Mlv
But this kid’s not holding his breath.
Columbo investigates crimatology.
Hint; just the first two minutes is enough.
http://www.youtube.com/watch?v=FUPLHvZ4KLk&feature=related
I think the following error in NOAA’s “Quality Control, Homogeneity Testing, and Adjustment Procedures” has not been investigated yet and I think it is substantial:
http://www.ncdc.noaa.gov/oa/climate/research/ushcn/ushcn.html#QUAL
In the adjustment procedure of the link above under point 1, “suspects (> 3.5 standard deviations away from the mean) and outliers (> 5.0 standard deviations)” are identified after “validation” removed from the temperature data.
In point 2, the temperature data are adjusted for the time-of-observation bias (Karl, et al. 1986)
The issue is, that different times of observation with a Min-Max thermometer may cause substantially different temperature data, because there is only partial overlap of their the 24 hour measurement period. Such cases occur, if there is a substantial weather change during the combined time span of the thermometers and a maximum or minmum does not fall in the overlap.
I checked this with hourly data from Jamestown ND, and even differences of 10 deg Celsius are not uncommon during a year. Such cases deliver a significant contribution to the required TOBS adjustment.
That means, however, that typical and signifcant TOBS errors may already be accounted for by step 1, and then again by step 2, that means 2 times. As TOBS lowers older temperature data, an inflated warming trend results from the double adjustment.
Manfred says:November 12, 2012 at 9:06 am
In the adjustment procedure of the link above under point 1, “suspects (> 3.5 standard deviations away from the mean) and outliers (> 5.0 standard deviations)” are identified after “validation” removed from the temperature data.
In manufacturing, we were only allowed to remove “outliers” if and only if we could explain the cause of their being “outliers”. Otherwise they were part of the dataset and contributed to the overall sigma of the dataset. Their “adjustment procedure” sounds like just another back alley to fiddle with the “data” to get the desired results, let alone the enhancing of the quality of “data”, read ‘stability of climate’, by artificially lowering the sigma.
I’m not in the US. When is someone going to challenge these sort of adjustments in Court ? Steve can continue to point out the obvious for the next couple of decades but it won’t change anything
( no offence Steve to your work ). The only thing that will stop it is successful legal action and I’m not suggesting that would easy. But it has to be tried.
Hanson has been caught not just once, but twice for tampering with the data to make it look bad. The question is why he has not been fired from his position with NASA’s Goddard Institute. It’s now at the point where I ignore government reports. They always lie.