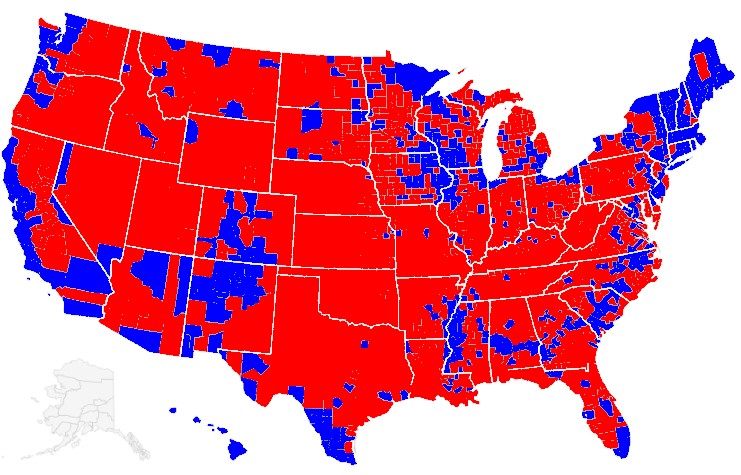
County by county map of the 2012 presidential election.
Obama won a mandate from the people in the blue areas to take lots of money from the people in the red areas.
If taxes were necessary, then the Americans wanted their own assemblies to impose them. Further, the colonists wanted Parliamentary recognition of this perceived right.


Looks like large numbers of Native Americans went for Obama.
Yes, all 2000 of them.
On Thu, Nov 15, 2012 at 7:56 AM, Real Science
Does that include Elizabeth Warren?
There are some red counties this time, that I have never seen go red before. Some mandate.
Where is that graphic from?
It is obvious that the ones feeding the nation voted one way and the ones living off the work of the ones feeding the nation voted the other way . How long do people think this will go on ?
Like the blue cold of hypothermia, mostly eating away at the extremities first.
Why do the ‘live free or die’ folk vote for Obama?
Apparently you would like “one acre, one vote”
How about posting a graphic showing the size of each county scaled according to population (“one person, one vote”) ?
Or scaled according to the proportion of GDP generated within the county ?
If a climate alarmist posted such a misleading graphic you would be all over it.
What a stupid comment. Obama is very unpopular in 90% of the country. Use your brain next time.
“Obama is very unpopular in 90% of the country.”
Especially the mountains and the deserts ?
Your linking of political support and geographic area is meaningless when the population (and almost everything else) is so unevenly distributed.
What a stupid comment. Your hatred of Americans is glaring.
On Thu, Nov 15, 2012 at 11:58 PM, Real Science
Stefan Landherr, it works fer Hansen and his purple crayon…. 😆
“Your hatred of Americans is glaring”
On the contrary.
Your contempt for 51% of your fellow citizens is glaring.
You are a true classic. You described the people who live in 90% of the US as being “mountains and deserts.” Your dehumanizing of people who disagree with you or are different from you is typical of many Europeans, and exactly why Europe has started most of the world’s conflicts.
I am making a painfully obvious point that Obama is unpopular in 90% of the US, and you twist and manipulate this information in classic leftie style.
And here is a link to electoral maps scaled by population:
http://www-personal.umich.edu/~mejn/election/2012/
The fact that there are huge numbers of minorities in coastal cities is well known. If you looked at a map of murder rates it would look about the same your political map. Your refusal to grasp the very simple concept I am presenting here is a very good indicator of both your bigotry and general stupidity.
On Fri, Nov 16, 2012 at 4:29 AM, Real Science
This is why the Tenth Amendment is critical to restoring a proper balance of power in this country. See http://www.tenthamendmentcenter.com. Washington is never going to fix Washington, but 50 states can.