
CNN meteorologist Chad Meyers declares that the Arctic is ice-free and is responsible for the cold weather.
there is no ice up here in the North Pole
[youtube=http://www.youtube.com/watch?v=um-h8Zt6iD4]
h/t to John
All that warm toasty air from the ice-free Arctic is plunging south and bringing sub-zero weather to the US. Global warmers make Monty Python witch burners look like serious intellectuals. What kind of idiot would believe that there is no ice in the Arctic after four months of -30C temperatures?

F-ing dumbass–i will pay for his abortion–
As once quipped by a famous politician – Churchill I think – responding to some silly remarks in a debate on abortion –
Sir, in your case it is a shame that it cannot be made retrosprctive !
LOL! He’s confirming the science is run by retards.
“Chad Myers is a meteorologist and the severe weather expert for CNN. Myers earned a bachelor’s degree in Meteorology from the University of Nebraska. Chad joined CNN in October 1999, moving up from working as the Morning Meteorologist at WXYZ-TV in Detroit. He has made his mark as being the one to make complex subjects more understandable.”
Uhuh.
He is well able to display his Cranialanalinsertitis.
What a turd. This cannot be by mistake.
To be totally fair, in a later report, Myers did go back to show the minimum ice extent of Sept 2012 as an example of the “ice-free arctic”, but clearly he is implying that that low extent then, is causing the jet stream dip now. That’s just flat out crazy.
He said what he said …
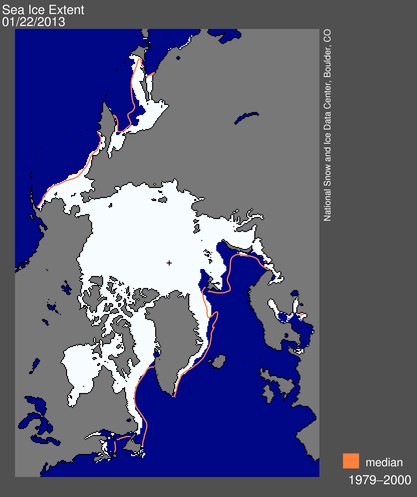
So I am looking at the pictorial representation of the current state of the Ice, from te National Snow and Ice data center a s shown above.
Looks like plenty of ice. Really quite a decent crop of ice.
I don’t see how backtracking to September 2011 would be in any way relevant to the very cold temperatures today.
It is crazy, and that is exactly what he says.
“This is caused by the fact that there IS no ice up here.” (emphasis added)
“This cold front, this cold air, is directly responsible for the lack of sea ice (garbled)that we have to the north (sic).” He certainly misspoke and swapped around what was responsible for what. That’s a slip of the tongue and understandable. He is still meaning to say that the cold weather in the States is caused by a deflection of the jet stream, and that it is the present lack of sea ice (he uses “is” a couple of times referencing ice-free-ness) which is “directly responsible.”
First of all, that’s absurd, because cold spells have almost always been related to the southern deflection of the jet stream, that’s something I learned in 5th grade when Nixon was president. Second of all, even if a lack of ice over the summer was responsible for jet-stream deflection at the time, causing a cooler summer (which I don;t remember), any of that effect would surely be long diminished. I understand that some weather and climate effects are relatively long term, which is why the hottest part of the day is around 3 or 4 oclock and not noon, and the hottest part of the year July & August, not late June. Not the jet stream. Not August to January. It’s wind. It doesn’t take 6 months to react. He’s just fearmongering. Notice how fast he had to jump in to explain this away?
He is a YES man.
This guy has a degree? In meteorology? Where did he buy it?
Cracker Jacks!
“Oh Chad, well that makes perfect sense!”
The worrying thing is that he probably actually believes what he is saying.
I thought the UKMO were biased!
He should be fired for total incompetence.
“The worrying thing is that he probably actually believes what he is saying.”
That was his main qualification for employment at CNN.
Teleprompters never lie!!
Just ask Obama!
Those who propose this theory need to answer 3 questions before they can even cross the starting line:-
1) If lack of ice causes cold winters now, what caused them when Arctic ice was expanding in the 60’s + 70’s?
2) What was wrong with the models of those (i.e. all warmist scientists) who predicted a few years ago that global warming would lead to mild winters?
3) What caused mild winters when Arctic ice was declining in the 90’s and early 2000’s?
If they cannot provide definitive answers, they are just pedalling junk science.
wrt 2) – they are saying that the models didn’t take into account the effects of Arctic melting (this is the line given in a recent Scientific American article)
Of course, it’s more than a little odd that no one noticed this omission until after we got cold winters.
All very good questions, Paul, for which there are no answers.
I have a globe on my desk that has no ice in the arctic and looks like that one that Chad is using.
http://upload.wikimedia.org/wikipedia/commons/c/c8/Globe.JPG
Now I can see why we have an ice free arctic … tic …tic… boom
He is ten years premature. And that as respects summer ice.
Maybe 110,000 years premature!
Myers: “There are no brain cells up here in my head, which is causing suggestion from alarmists to enter, plunge down into my ass, and then forced up through my mouth..”.
Get a large fry pan of water and sit it over a small burner in the middle the waterr as it boils will mound up over the burner and flow to the outside cooler part of the pan. Turn the burned down the mound reduces and the water leverls.
This is what is happening to the atmosphere. If people looked at a globe instead of at the normal Mercator projections they would realize that the poles are very small and the large energetic area of the equator very large. The convective Hadley cells at the equator are less vigorous so the Ferrel cells drop south and the jetstreams become more meridonal allowing the poilar vortex to expand into the Rossby waves in the polar jet,. At the same time the meridonal jets moving rapildly poleward are more likely to create Sudden Stratospheric Warmings as the air literally breaks like a wave up into the stratosphere. This leads to mixing of the atmosphere, reversal of the polar vortex and polar air escaping into the temperate zones in the erquatorward loops in the jetstreams. Warm air ffrom the equator in the poloarward loops mixers with colder air and results in more rain (as in UK this summer) and snow in the winter.
Not a bad approach but why would the Hadley cells become less vigorous in the first place when there is only a tiny variation in solar output ?
We need to see more meridional jets first with increased global cloudiness and then less energy into the oceans to fuel the Hadley cells.
For that reason my narrative favours a solar effect above the poles affecting the polar vortices which then contract or expand depending on solar behaviour.
Read Nir Shaviv’s paper “Using the Oceans as a Calorimeter’. Changes in TSI that assume equal heating effect of all wavelengths seem to be a little simplistic. There have been large changes in UV and eUV for example possibly at the expense of other frequencies.
We ARE seeing more meridonal jets which is why the UK for example has had continual rain . But that will not affect the Hadley cells themselves which are equatorward of the jets it is the energy in the Hadley cells that pushes the jets and Ferrel cells poleward. The amount of insolation at the poles is minute compared to the tropics the energy is just not enough to push the atmosphere equatorward.
Are there still people watching CNN ?
Where do the letters CNN stand for ? Communist News Network ?
Not Communist. Collaborationist.
The Jackasses are going full stupid for broke into it now it seems. 😆
This is Chad Myers brains on weather.
http://www.youtube.com/watch?v=nl5gBJGnaXs
This means all the Polar bears drowned.
It’s warmcold rearing its ugly head again!!!!
😆 It looks that way doesn’t it……
If this had been a really mild winter, you can bet they would have blamed it on the lack of ice. It’s a doubled headed coin and they win no matter what comes up.
Is it possible he was saying that with tongue in cheek? Here’s another video of him with Jay Lehr on Lou Dobbs from 2008:
http://www.youtube.com/watch?feature=player_embedded&v=ewX59cGurDo
Without the video, I would never have believed this. Crimony!
Never mind, he’s a drone.
http://www.youtube.com/watch?v=Zz_Kvhw6_Qc
😆 he is all over the place whith this, it’s more likely he is a YES man!
O/T except for talking of dumbasses.
The UKMO 84hr surface pressure forecast is showing a low pressure area mid-Atlantic with a central pressure of <932mb! It's also about 700nm across – that's big. It develops from 984mb to 932mb in 24hrs.
That's a full 14mb less than Cat 0.8 Hurricane Sandy at landfall in NY.
““Chad Myers is a meteorologist and the severe weather expert for CNN. Myers earned a bachelor’s degree in Meteorology from the University of Nebraska”
Chucklehead Chad should get his money back because he is either only as smart as a slice of processed cheese or they graduated him to get rid of the smell.
The plain, undisclosed fact, is is that the jet stream dips into the US periodically and quite consistently based on my casual news news watching. It is not caused by a lack of arctic ice.
You’re exactly right, in fact here’s what I said about the NAO and its correlation to sunspot cycles, ENSO, and PDO.When you take into account that the oceans have 1000x the energy capacity of the atmosphere and that with fact that the amount of energy difference as temperature increases also increases, and that over the sunspot cycle, changes in the energy output occur, and using this information, you figure out that it is the area with ocean and warm, tropical oceans that are most greatly effected by changes in the amount of energy output from the sun. Also take into consideration that the Pacific Ocean has the largest amount of surface area over any other ocean, thus it has the largest area that is effected most greatly by changes in the sun. Also, as I have mentioned before, it is changes in the large scale drivers, especially the oceans, which can influence oscillations like the NAO (through the Atlantic Tripole signature for ex.), and knowing that the sun is the ultimate source of energy for the oceans and the earth as a whole, what better place to look to see if there are definitive trends in the sun and oscillations like NAO (we already know the PNA is influenced by the 25-30 day sunspot cycles, having inverse correlation.) If you look at the NAO starting in 1950, notice the large sunspot cycle in the late 1950s and look at where the NAO is, averages out to be near neutral with some favorability towards its positive state in the early 1950s. Look at what happens in the next sunspot cycle with a peak just before 1970, significantly lower than the previous cycle, the NAO responds to this with very significant negative events in the late 1960s and into the 1970s. The next 2 cycles in the 1980s and 1990s are higher than what was observed in cycle 20 around 1970, and notice from 1970 through the end of the 1990s, the NAO responds to this by becoming predominantly positive during this time period. Now, take into account that current cycle 24 is one of the lowest of the century, and interestingly, the NAO responded to this unusually low cycle by having 2009-10 and 2010-11 as two of the deepest negative NAO winters going back to 1950. This is very interesting, and based off of this information above there does seem to be at least some correlation between sunspot cycles and the NAO, of course it does make some sense, even though the amount of energy received to earth’s surface does not vary but .1% from the peak to the minimum of the cycle, this change in energy felt over longer periods of time and multiple cycles seems to have clear effects on this oscillation, of course what also seems interesting is that when you put the December-January-February average of each winter of the NAO since 1950 against the PDO, you also seem to get a correlation with the NAO negative in the 1960s and 1970s, at the exact same time the PDO is in its cold state, with more positive values in the 1980s and 1990s, and with lower values beginning to show up once again, this also seems to show a decent overall correlation with the PDO, as it has turned cold over the past several years. The PDO may be able to explain the seemingly slow response from the NAO to go negative to the slightly lower sunspot cycle 23, because the PDO in the late 1990s was in the peak of its warm cycle. If you combine these two factors together and understand there is an overall positive correlation between NAO to sunspot cycles & NAO to PDO, you can get a general idea of where the NAO may be heading in the future, with sunspot cycles remaining considerably low, and getting even lower for at least the next several years (possibly even through solar cycle 25), and the PDO only deepening into its cold phase, this suggests we may have to deal with many more (potentially deep) negatively favored NAO winters in the future, which gives snow lovers and weather enthusiasts something to certainly look forward to.
It makes sense that the ENSO index and the sunspot cycles would control the state of the NAO, given that the sun outputs well over 99% of the energy received to earth, and although slight deviations in the energy received to earth’s surface only amount to .1% from the peak to the minimum of a particular cycle, (as shown in this post above) this has significant effects and feedbacks into earth’s larger systems, such as the oceans, specifically the PDO. The PDO along with the ENSO index is important because oceans have 1000x the energy capacity of the atmosphere, and considering that the amount of energy between each degree increment of temperature increases as temperature does, this makes the warm tropical oceans that much more significant. Plus, the Pacific has the largest amount of area with warm, tropical oceans, thus it has the largest amount of potential energy, and when this cools along with decreasing sunspot cycles, this results in less energy into the overall system and makes cold air more available. This influences the NAO, because nature of always trying to create a state of equilibrium and has a way of balancing itself out, thus, when you have the sunspot cycles and the ENSO index both favoring warmth, like in the 1980s and 1990s, and naturally there is less available cold air in the system, thus with less cold air to distribute this is why the NAO (which is an oscillation that helps to give you a general measure of how much cold air is being loaded over the arctic) during these periods of time was predominantly positive because with the overall system warmer, the arctic is going to have a tendency to want to contain cold air. However, with the PDO flip that occurred around 2008 and one of the lowest sunspot cycles in a century, it is no wonder why the NAO went to record negative levels in both 2009-10 & 2010-11, because of more available cold air into the system due to the two primary pattern drivers (the sun, and the oceans (ENSO & PDO)) pushing for cold, not because of declining arctic sea ice. Of course, the PDO turned cold around 2008, and interestingly, with one of the lowest sunspot cycles in a century or so, it should come as no surprise that the NAO went into its two deepest negative NAO winters. (2009-10 & 2010-11).
It’s called the Arctic Oscillation.
I watched several videos with this Chad guy. It appears over time he has become full on for AGW. It wouldn’t be surprising if he was “encouraged” to adopt more “mainstream” views by management. IOW, ‘if you want to keep your job, get with the program’.
His pay check and continuing pay raises depend on it, for certain!
Sad truth is that lots of people watch this dreck and believe it – media whores and Obamanite communists are cranking it up – watch for a carbon tax, onerous EPA regs or something worse in the near future.
In all the time I’ve been reading this blog, I’ve never seen anything so jaw-droppingly ridiculous. He not only says there’s no Arctic ice, he pulls up a map and emphatically points it out. There’s no way to spin that. War is Peace. Slavery is Freedom. Ignorance is Knowledge. Hot is Cold. And there are many people watching that broadcast who believe it.
I’m considering paying for video hosting on my blog just to post that.
He should have said less rather than none, rather a big mistake even though just one word. I guess going into the Arctic oscillation would have been too much for his watchers so he tried to dumb it down and failed
Andy
Chad? Chads? Where have we heard of trouble with chads before? Something to do with skewing the results.
Did anybody catch the women at the end of the video saying that all those dippity-do cold waves used to hit her in Canada when she was growing up. Well, was there no ice back when she was growing up?
Yeah we don’t call it Winterpeg up here for nothing. 😆
Winterpeg Manisnowba! 😉
LMAO!
Look you all! don’t you realize that the magnetic north pole has shifted toward the North American continent & expect polar bears walking past the white house soon!
Trust me! I am a “respected” scientist from IPCC! Would I lie to you?
To all you Global Deniers,
in ten years time there will be 4 months where the temperature will be -28.8c (approx.) then you will all be sorry!!
CNN does not do weather. That group is just a bunch of zeros. When will they actually take weather serious there?