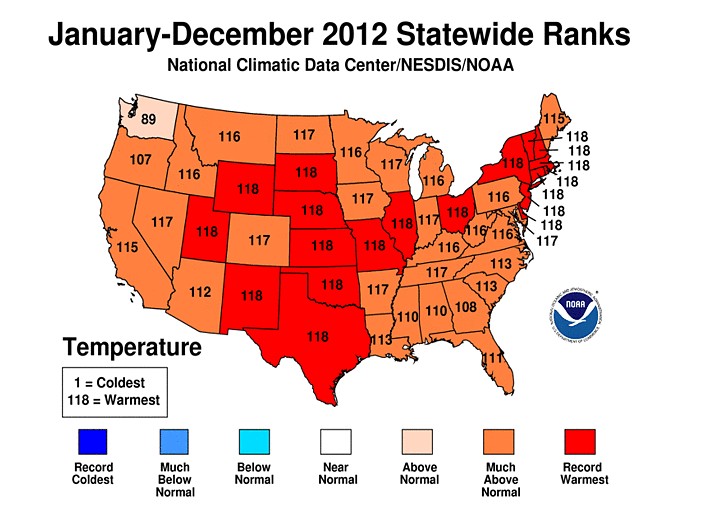
NOAA claims that Texas had its hottest year ever last year.
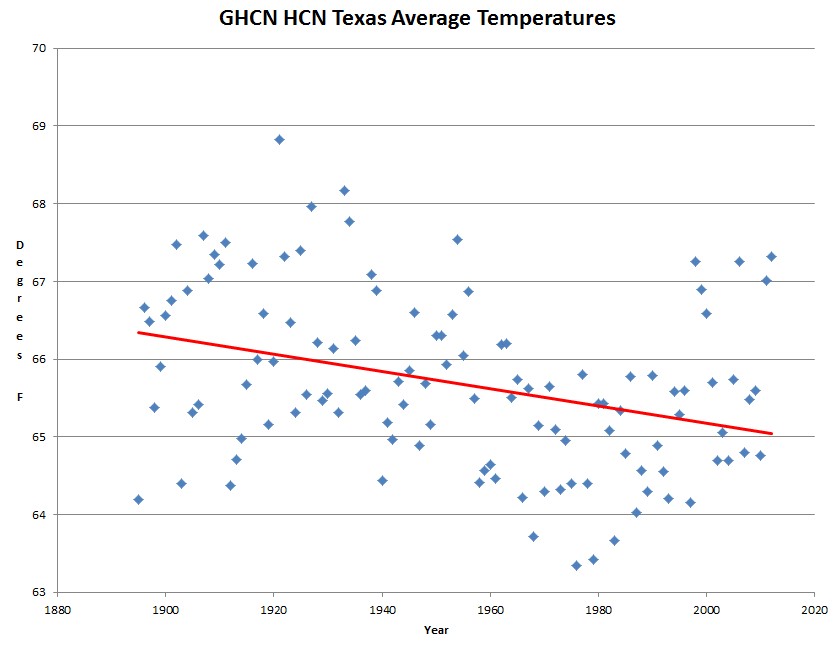
Yet their own data shows that 2012 didn’t even rank among the ten hottest years in Texas. 1921 was more than a degree warmer than 2012 in Texas.
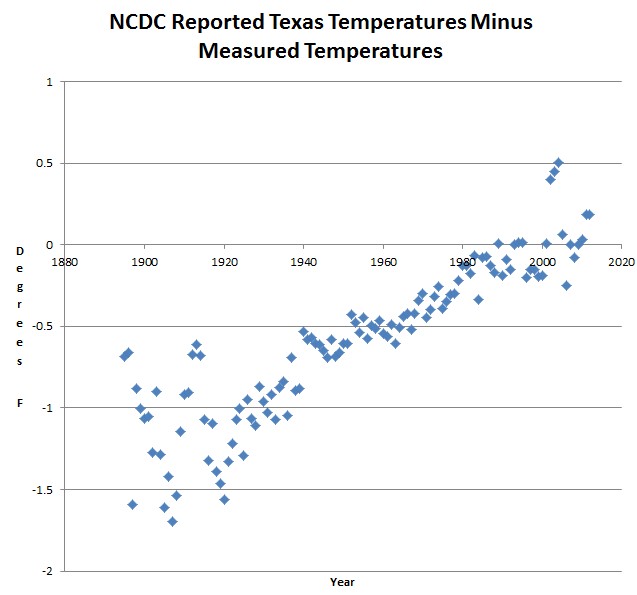
NOAA accomplished this by massively tampering with the data, subtracting from older temperatures and adding to recent ones.
NOAA has turned a strong measured cooling trend in Texas, into a warming trend. It is a total fraud, which defies comprehension by rational human beings.
We are from the government, and we are here to frighten you and steal your money.


But Steve,
according to the new AGW religion, the world started in 1979 AD or CE for the non latin speaking pc sheeple, and thus last year WAS the hottest year ever in Texas!
This year is now the year of our blessed St Barack,
34 ACCE (After Climate Change (Fraud, oops I mean) Enlightenment).
Let us all pray to St Barack to deliver us from the sin that is CO2.
Oh Crap……every time I breathe out its a sin in this new religion!!
Holding my breathe…………………………………………………………..@#$%
perfect!:-)
That “…2012 Statewide Ranks” map, with no state anywhere near “coldest” and most of the country practically tied for “warmest” (118 “whatevers” above “normal”–let us say, a somewhat lackadaisical quantitative assessment, with no objective meaning apparent), should be laughed out of the public discourse, and NCDC/NESDIS/NOAA should be severely fined and publicly reprimanded for unscientific assertions and alarmist deception of the public they supposedly serve. And that is just the minor deception, compared with the fraudulent “adjustments” to the temperature record.
The climate activitists, er “scientists,” at NOAA and NASA are giving their political masters exactly what they expect: an alarmist story about a warming earth, triggered by dreaded fossil fuels.
The scientists-turned-data manipulators’ first concern is job preservation. Their bosses are interested in keeping the grant money flowing. And the political insiders and power brokers are interested in raising taxes, driving up energy costs, and controlling the global economy under the guise of saving the planet.
Big government and the big banks and mulitinational corporations are in bed together. It’s called fascism. And we, the little guy, are their target. But before they can take full control — imagine a scene from George Orwell’s 1984 dystopia — they must first confiscate our guns.
“We are from the government, and we are here to frighten you and steal your money.”
Yep. That sums up the federal governments attitude very nicely.
Steve,
This is so important it defies comprehension. Would you mind taking a moment to post how you make these charts? I want to replicate myself. I would like to make an interface so anyone (the media) can do this themselves, but I need to know how you do it first. Also please see comment at https://stevengoddard.wordpress.com/2013/01/09/the-noaa-fraud-hockey-stick/#comments
What dataset?
What fields of dataset?
What filtering for dates?
What data manipulation do you have to do with the data before you chart it?
If this is using GHCN daily, and you are compiling for a whole state, I think I know what to do based on your previous code (except how to weight spatially to get a good geometric average for the state). If you are using some other dataset or time frame (like monthly or annual), please advise.
Well, I don’t really want to “replicate myself”, though it would most certainly make the work day go faster.
I’ll do it later. I have a lot of things going right now.
Start here
http://stevengoddard.wordpress.com/2012/12/29/ghcn-code/
OK thanks Steve. If you are confirming this is all derived from GHCN daily, I already have your code. I’m working on an excel front-end first (but the work done in VBA). I’ll see what I can do. I figure this is easy and people will understand the code.
For a state average, you are just taking an average without any weighting factors for things like lots of stations close together? If so that’s fine… I’m a long way off but I’ll share notes once i get closer. Thanks.
I’m taking the monthly average of all min/max readings averaged per year
How about Illinois?
I am mystified why Texas doesn’t SUE – I mean, every school child knows, “Don’t Mess with Texas…” All past temperatures change all the time, always and INFINITELY as the GOLD STANDARD? Seriously? Holy lying sack of manure, Batman – the Joker’s up to his dirty tricks again!