
Sea level isn’t rising in Puget Sound, but facts aren’t important to lefties. In fact, they have to be avoided at all costs.
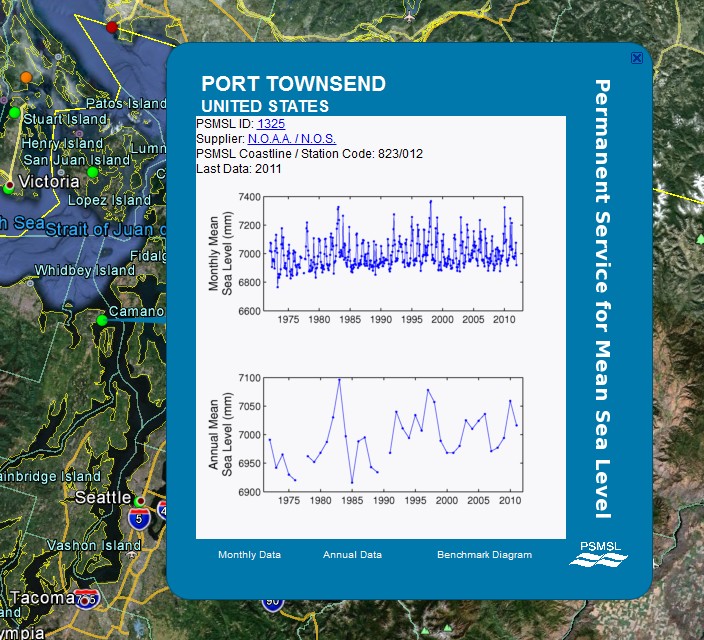
Data and Station Information for PORT TOWNSEND
h/t to Marc Morano
Sea level isn’t rising in Puget Sound, but facts aren’t important to lefties. In fact, they have to be avoided at all costs.
Data and Station Information for PORT TOWNSEND
h/t to Marc Morano

New York is subsiding: http://www.psmsl.org/data/obtaining/stations/12.php
Reblogged this on Gds44's Blog.
Tides and Currents gives an average of 0.9 mm/year for Washington State, although it is less over the most recent 20 years. Hansen predicts this will double every decade…since 1970.
Hansen sees real exponentials in every prediction, and most importantly, it is always a few decades in the future before things really get going. This allows him to hide the nearly flat early portion of the curve in the noise of any observational data.
Hansen is a complex numbers denier.
Same here in Vancouver. City Hall is run by a cabal of Eco Greenie Fruits & Nutters. They are funded by Tides Canada and a couple of uber wealthy do-gooder expat Americans who are really, really big Eco Greenie Kool AIde Chuggers. The mayor is referred to as “Mayor Moonbeam”) and they are spending $hundreds of thousands on Eco Propaganda about how bad sea level rise is . . despite what the tide gauge data says.
They have painted blue lines on bridge supports and lamp posts around town to show people how high the sea level will be in 20 – 50 – 100 years.
Total Eco Loonies
So in about 50 years or so from now.
“Grandpa tells us again why you painted the line on the lamp post, tehee, heehee, pleeeease! Hahaha. Pleeease. Go on tell us again – its so funny, haahaaahaaa”
Outstanding description of the situation in Vancouver, Fred. Yes, this funding from the wealthy do-gooders and the liberal media, insidiously, determines the bulk of what the public sees and hears about agw. You wonder why Climategate and Hide the Decline and this [must see and share 3 minute] video (http://www.youtube.com/watch?v=WK_WyvfcJyg&info=GGWarmingSwindle_CO2Lag) is now nearly already forgotten, or, for many, never heard. We need an orchestrated financed dose of reality to counter the bullshit that permeates the air and web waves.
And these libs don’t care whether what they say is true. Even if they know full well that what they present to the public is 100% baloney, they take the viewpoint espoused in the following quotes:
“We’ve got to ride the global warming issue. Even if the theory of global warming is wrong, we will be doing the right thing.” -leftist Senator Tim Wirth, 1993
“We have to offer up scary scenarios… each of us has to decide the right balance between being effective and being honest.” -Stephen Schneider, lead ipcc author, 1989
“It doesn’t matter what is true, it only matters what people believe is true.” -Paul Watson, Greenpeace
Wow, you sound really angry and hateful. You seem to like to attack people and call them names. I feel sorry for you. It must suck going through life being angry about things that you can’t do a damn thing to change. Sucks to be you…
What explains the cities underwater from centuries ago? It wasn’t global warming obviously because there was evil CO2 pumped into the atmosphere by the ancients.
When discussing Seattle being underwater due to global warming and sea level rising and what we can do, the only answer is: Move inland.
What gets me is that year after year these mendacious sanctimonious Chicken Littles keep putting out the same regurgitated fear-mongering propaganda for various places saying how it’s imperative that the locals start prepping for the coming catastrophic flood from a rising sea.
And just like all their other bogus broken record predictions of doom, decades pass at these coastal locations, and you look out, and that the sea is.. exactly where it was… back in the nineties, and eighties, and seventies, and sixties. Exactly the same. No change. The Sea Also Rises… NOT. Dial it back, the sea level was the same, despite the “data.” And you know one thing, their current bogus predictions are no different from their bogus predictions from decades ago. Decades from now, we are going to look out and see.. that the sea.. is just the same as it was now.
Indiana Hansen said something similar about Manhattan, I wonder how that worked out.
The big one (Cascade volcano or earthquake) will hit Seattle long before sea level becomes a problem.
That Port Townsend Sea level graph looks totally flat to me, all the way from 1970 to the present. It just goes up and down, up and down, up and down,,,,, Nothing to see here folks, now move along please.
Look again — there is a clear rise of approx. 75mm (3″) from years 1975 to 2010 in both graphs.
You sound qualified to get a job at UEA.
For Coolwhip!
http://www.youtube.com/watch?v=Q8H-CTeX2-4
Drewski-
NOAA Tides and Currents-
Port Townsend shows +1.3 mm/yr rise from 1972 to 2011.
Port Townsend shows -1.3 mm/yr rise from 1992 to 2011.
These observations clearly show that SLR is accelerating at dangerous rates and Seattle is doomed!!!!!!!!
Drewski, you are guilty of obvious cherry picking. You picked 1975 as the start, but the chart started in 1972! Be real. If you had started from the start you would have a minimal 15mm rise over 40 years. Lets put that in English, that’s ~ a half inch in 40 years. That’s not inundating Florida, or even a sand castle.
And lets go ahead and start at the beginning, 1972, but lets cherry pick the end year like you cherry picked the start, and end in 2007, and then we have a 25mm drop in sea level. It looks like you are doing what the fear-mongering warmists are famous for: manipulating data or manufacturing / fabricating something that isn’t there.
Here’s a big version of the chart in case you need glasses: http://www.psmsl.org/data/obtaining/rlr.annual.plots/1325_high.png
And I have to give it to Me that little violin is very apropos for this situation.
Err…. Drewski is being sarcastic…
No he isn’t – he just isn’t very bright
Sorry Steve, I cannot accept anybody as being *that* stupid. And if he really was that stupid, how did he manage to turn his computer on to type that message without electrocuting himself first?
He makes comments of equal stupidity here all the time.
If true, I would have to question my faith in the evolutionary principle of survival of the fittest… Although he could have been dropped on his head when he was a baby I guess.
Actually, i was being very conservative — according to the graphs supplied above and using the years I mentioned before: Monthly mean in 1975 was approx. 6900mm and it is at least at 7000mm in 2010 (rise of 100mm+) and the yearly mean shows an even greater rise for that same time period.
Don’t blame me if you can’t read a graph. And if you don’t like it, then get Steve to cherry pick some other graphs.
I genuinely believed you were joking. I don’t immediately assume someone is a complete moron, but apparently you are.
Quick climate lesson for Drewski. The PDO shift in 1977 and 1983 El Nino raised sea level, and it has been downhill ever since.
So Will, what is the monthly mean — using the graphs above — in 1975 and in 2010?
Eric,
Thank you for the link to the larger yearly-mean graph. Now if you put a trend line on the graph, you will see that it’s starting point (1972) is at 6950mm and you will notice the end point (2011) is at 7040mm. That is a 90mm rise over the entire length of the graph (including those pre and post years not labeled).
So, by using your own graph, it is clear there has been at least a 75mm rise in ocean level over the 1975 to 2010 period.
Sorry to be factually correct (again).
Perhaps Steve should have made up one of his own graphs instead of the ones he chose here.
Drewski, you are an idiot. Sea level rose on the west coast with the PDO shift in 1977. Since then it is going down. But thanks for once again demonstrating that alarmists are clueless about science.
Well Steve,
If you were going to qualify your graphs with some mention of the PDO shift, you should have done so at the top of the page. As it is — according to the graphs you posted above — there has been a sea level rise within the time period framed within the graphs.
There has been no error on my part. However, you have yet again omitted crucial information from rant/posts and then go on to criticize people who point out these errors.
it is no wonder why you are afraid to publish in a scientific journal.
Drewski, you are an idiot.
I see Steve that you are back to that charming habit of yours.
What did you call your math teacher in high school after he gave you an “F”?
Thanks for putting your stupidity on display
Well, according to Steve I am an idiot and also stupid.
Nonetheless, I am correct (as usual) — the graphs Steve posted above show a sea level rise from 1975 (or, if you prefer, 1972) until 2010 (or 2011) of at least 75mm.
Why is it that people who criticize Steve’s shoddy science or have have far more scientific qualifications than Steve are always called idiots?
You are an idiot Drewski. My statement was “Sea level isn’t rising in Puget Sound”
It isn’t rising. There was a rise thirty years ago corresponding to the PDO shift. You have the IQ of a turnip.
Goddard: My statement was “Sea level isn’t rising in Puget Sound”
Then you post 2 graphs that show that sea levels have risen.
Then you call me an idiot.
I have noticed that this is a pattern with you.
Drewski,
Apparently you didn’t learn about tenses in school. “is rising” is present tense. “Has risen” is past tense.
Brewski, you can’t rule a line between two points of your choosing then declare the other side is is cherry picking and you’ve identified a trend. Although you don’t know how to calculate a trend, the fact that you’re really really stupid has an advantage in that you don’t know how stupid you are. This fact can help with self management of your self esteem.
Will,
I used trend lines which started at the beginning of the graphs and went to the end of the graphs — I would hardly call that cherry picking.
And these are graphs that were posted by Goddard himself. I wasn’t trying to be deceptive like in the example of choosing 1997/98 (the time of great El Nino) as the start point of a “supposed” temperature trend.
I am only being accurate — I thought you guys would appreciate the change.
“I used trend lines”
No you didn’t. You ruled a line between two points and just called it a trend because you don’t understand what a trend (mathematically) is. Being stupid is fine. Everyone makes mistakes. But being unable to grasp a stupidity once committed, makes you a moron.
Goddard: Drewski, Apparently you didn’t learn about tenses in school. “is rising” is present tense. “Has risen” is past tense.Steve two points on grammar:
Well Steve,
It now appears you wish now to criticize my grammar (when all else fails. . . .) so allow me to make two points in this regard:
1) I used the PRESENT perfect tense “HAVE risen” in my statement.
2) The graphs in question finished in the recent PAST.
Have a nice day.
So Will, did I use a ruler?
Why don’t you — mathematically, of course — show me where my original statement that there has been an approximate rise of 75mm in sea level — BASED ON THE GRAPHS ABOVE — from 1975 to 2010 (or, if you prefer 1972 to 2011) is incorrect?
Please educate me.
If we’re going to be pedantic – “has risen” and “have risen” are both Present Perfect tense (usage depends on the noun that precedes it – e.g. “sea levels [pl.] have risen” or “the thermometer [s.] has risen).”
Past tense would be “the sea levels rose”.
Will, are you going to show me the errors I made (with math, of course) on the graphs?
I hope that this isn’t going to be another one of those times where I have to ask over and over for proof only to discover you were just talking out of your ass again (remember the hundreds of studies that you said would disprove AGW theory and you couldn’t even produce one?)
A man is 50 years old. He grew when he was 17 years old.
Drewski concludes from this that the man is still growing.
You are correct Steve, IF that man’s height was represented in a graph over his life of 50 years and it starts at his birth. Then yes, I would say that the man had grown over the course of his life.
Just like I would say that the 2 graphs you presented at the top of the page show a sea level rise.
I said “sea level is not rising in Puget Sound“ It isn`t. It rose in 1997 with the PDO shift.
Pravda in Australia doesn’t even pretend to be interested in “the science” any more when it comes to reporting “sea-level rise”:
“For the latest on climate change, turn to your local real estate agent
THE ABC’s flagship news programs have favoured advice from a non climate scientist based on speculation from a Byron Bay real estate agent over less alarming research from one of the world’s leading scientific organisations.
http://www.theaustralian.com.au/news/health-science/for-the-latest-on-climate-change-turn-to-your-local-real-estate-agent/story-e6frg8y6-1226553897397
Some of the High Priests of AGW are having a conference in Hobart Tasmania (famous for other satanic animals….. you know, Tassie Devils). They are doing a full court press this week on the MSM to whip up hysteria about rising sea levels destroying Australians coastal cities, since we all live on the coast. And the MSM, especially the lefty ABC, is buying into it now that the “science is in”.
http://www.abc.net.au/news/2013-01-14/how-will-rising-seas-impact-australia/4460688
This is one of the biggest crock’s I have read. Ms Sarah Clark needs to go back to school to tell the difference between fact and opinion. But that is the common denominator throughout this.
The ABC had CSIRO’s John Church on the news tonight to say why we all should buy scuba equipment or something.
For a microscopic amount of time, before I came to my senses, I thought I should write in to them to mention John’s paper of late last year which pointed out that SST rise was a gigantic 0.125 C in 50 years. This is so horrendous it corresponds to a 2XCO2 of half Lindzen’s value.
Which he forgot to mention on the TV.
http://www.environment.nsw.gov.au/resources/parks/09698FortDenSeaLevRiseStudy.pdf
Fort Denison is one of the oldest stable European structures in Australia and has been recording Tide data since 1840 with reliable data since 1914. Yet analysis of the tidal records is set aside in favour of post 1980 satellite data from the IPCC. I reckon the Fort Denison Tide raw data, which I’ll try to get and chart, will show next to no sea level increase over the past century in Sydney Harbour.
I was listening to a guy on talk-back radio this morning saying that the oyster farmers have records going back over a hundred years, and they can’t find any sea level rise either. A lot like the issue discussed here:
http://www.parliament.nsw.gov.au/prod/parlment/hansart.nsf/V3Key/LC20110909040