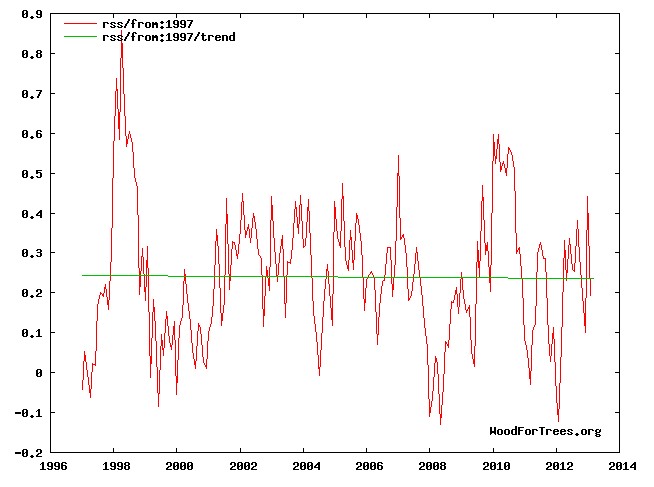
He wants to make the 1998 El Nino disappear, by cherry picking the interval.
The 15-year haitus (which isn’t real anyway) isn’t going to last much longer, because soon the 1997-98 El Nino is going to fall out the back of the 15-year window, and that will pull down the back end of the linear regression line and quickly make the slopes less negative/more positive.
Doh. Then it will be a 17 year window. ROFL
David apparently doesn’t understand the burden of proof. In order to prove a theory, you have to demonstrate that it always works. The burden of dis-proof is much lower – you just need to show that the theory does not always work.


wasn’t it 30y?? guaranteeing things will get worse until 2028 for him
You invoke what is called an auxiliary hypothesis. These are subsidiary explanatory processes that attempt to defend the core theory and protect it from failure. But the more of these you require the less useful your main theory becomes.
The other point he refuses to acknowledge is that a trivial amount if warming is not vindication for him. It’s still a fail.
“The 15-year haitus (which isn’t real anyway)…”
Talk about your deniers! 😆
Of course the 15 year is not real. It is more like 17 or 100 or even 5000 years of cooling with periods of minor warming.
Of course we do not know the extent of the temperature change or even the sign of the temperature change, due to manipulation of the data during processing. There is also the minor issue of not having sufficient monitoring stations over a significant time period to make accurate claims one way or the other. The most accurate method we have is Biological activity that is seen in geological records.
The world is colder now than it was 5000 years ago and there is no way to separate natural weather patterns from an imaginary forcing caused by human release of so called GHGs.
I just get carried away when DA’s name is brought up! 😉
I am always entertained by those who put more stock in their precious models than in reality, it really shows you where they are coming from, just not which planet. 😉
😉
“…1997-98 El Nino is going to fall out the back of the 15-year window, and that will pull down the back end of the linear regression line and quickly make the slopes less negative/more positive…”
First, he assumes that we won’t ever see another El Nino/La Nina (and if there is a strong season, that it will be an El Nino as strong as the 1997-98 season was).
Their only concern is being able to make the slope as strongly positive as they possibly can using every single database, and it’s a travesty that they can’t.
It would serve them right if the next La Nina was extremely strong – then even if the 1997-98 El Nino were dropped, there would STILL be a neutral/negative slope (leaving it in would show a steeper negative slope, and they can’t have that).
David should stick to interpretive dance. It’s okay to be creative in that field.
http://www.youtube.com/watch?v=16oOMt3VjVY
Too much acid in his old hippy days…
I actually read this one:
http://davidappell.blogspot.com/2013/03/global-warming-causing-sinkholes-really.html
David misinterpreted that as well!
Sadly for Appell you see a decline since 2003 as well:
http://woodfortrees.org/plot/hadcrut3vgl/from:2003/plot/hadcrut3vgl/from:2003/trend
http://woodfortrees.org/plot/hadcrut4gl/from:2003/plot/hadcrut4gl/from:2003/trend
http://woodfortrees.org/plot/rss/from:2003/plot/rss/from:2003/trend
Even from April of 2000 shows a downward trend. What good ol’ Dave thinks is going to happen ironically isn’t going to last long.
You are right, but the ligitamate question is, how many years have we gone without statistically significant warming, so that trend will be 17 years as stated. Tis cherry picking that DA is doing, while the question stated is not cherry picking.
The only period since 1940 with significant warming was from 1980-1998, definitely augmented by the 1997-98 El Nino. I thought the alarmists were in love with the 1998 El Nino. It was the lynchpin of this entire scam. Without it, they have very little.
I think Appell actually has it reversed. It was the unusually large El Nino’s of 1998 and 2010 that are propping the temperature up. Had it not been for those two peaks, there would probably be a significant decline. A reversal of the PDO and the resultant fewer El Nino’s over the next decades is actually going to make temperatures decline even more.
Last time I mentioned to David that the ocean cycles suggest a sine curve is a better fit than a straightline trend he went off like a firecracker. This is why I miss Ray Spencer’s ‘playful’ polynomial fit since it always caused interesting head explosions amongst the consensusee fraternity.
The sinusoidal trend is right on the money so far, though the downturn may become steeper as the solar minimum really kicks in.
Appell is right in the sense that adding a few more months of data may change the trend. But what does that tell you? It means the trend is presently very very weak. That is not particularly supportive of the claim that we’re all heading for catastrophic levels of global warming.
He wants to reduce the data, not increase it.