
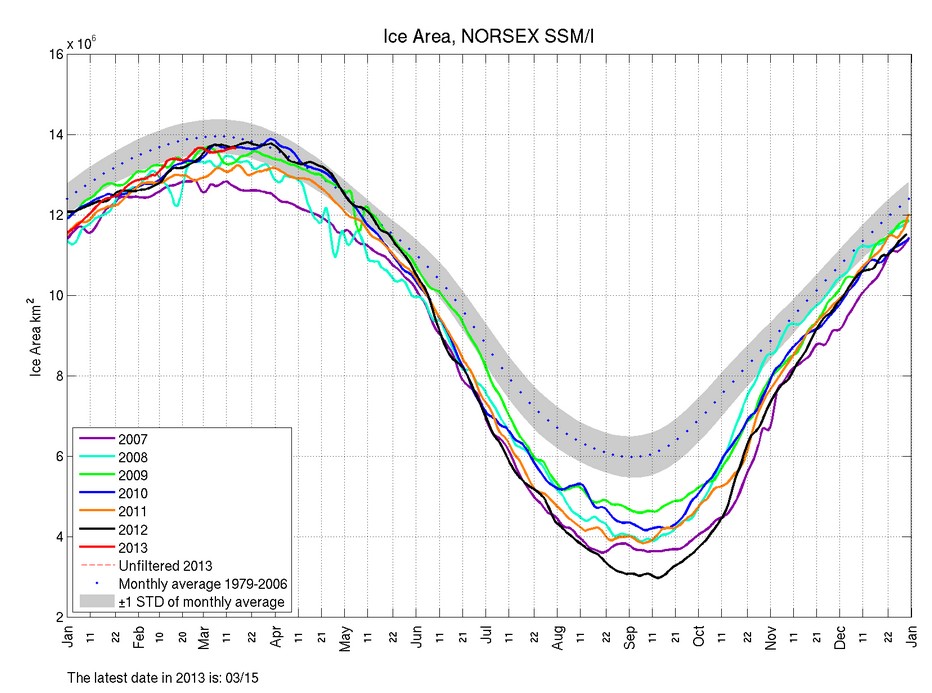
The US Navy is forecasting an increase in ice around Newfoundland and the Barents Sea this week, which would likely push Arctic ice area above the 30 year mean.
The US Navy is forecasting an increase in ice around Newfoundland and the Barents Sea this week, which would likely push Arctic ice area above the 30 year mean.

13.5 Million sq km times average depth of say 2 metres( could be more) is 27,000 cubic km of sea ice, which interestingly is slightly below 1979 maximum volume, and I could have underestimated by 20%. In comparison, Greenland holds 2,910,000 cubic km of ice.
So for the muppets who keeps mentioning Sea Ice volume as being significant?
At <1% of Greenlands ice volume, come on. It's not.
The extent of sea ice is the significant number.
And the world can celebrate that Juliar Gillards carbon dioxide tax has increased the NH sea ice extent to 10 year record levels after getting the SH sea ice to record extent too in 2012. Obama should go down on bended knee and thank her for doing the heavy lifting.
😀
Here is Julia doing the heavy lifting.
http://www.canberratimes.com.au/national/worlds-press-compares-julia-gillard-to-cinderella-and-elvis-how-the-international-media-reported-the-prime-ministers-dramatic-restaurant-exit-20120127-1qkd8.html
Here are some of Larry Pickerings cartoons of Julia Gillard doing “heavy lifting.” He is classic. Ignore the blog rant of the lefty. Pickerings cartoons are on FB for those who are interested.
http://mike-servethepeople.blogspot.com.au/2012_10_01_archive.html
Surpassing the meaningless mean would be…
I love how the only years they show all seem to be BELOW the summer minimum mean.
Just once, I’d like to see all the years that has the minimum ABOVE the mean.
If there are at least 6 years below the mean, there had to be at least 6 years above. When was the last time the summer minimum was above the mean?
How about a using a meaningful mean? The only way to come even close to a true mean, is through using all years available, anything else is cherry picking.