
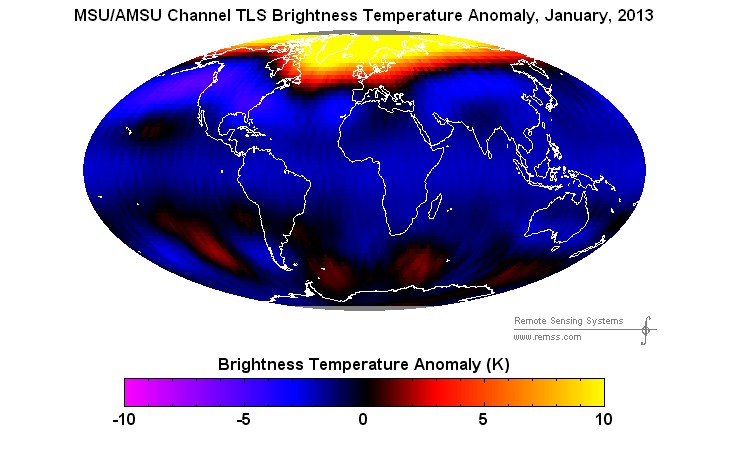
Remember when CO2 was going to cool the stratosphere?
Disrupting the Borg is expensive and time consuming!

Google Search
-
Recent Posts
- The Real Hockey Stick Graph
- Analyzing The Western Water Crisis
- Gaslighting 1924
- “Why Do You Resist?”
- Climate Attribution Model
- Fact Checking NASA
- Fact Checking Grok
- Fact Checking The New York Times
- New Visitech Features
- Ice-Free Arctic By 2014
- Debt-Free US Treasury Forecast
- Analyzing Big City Crime (Part 2)
- Analyzing Big City Crime
- UK Migration Caused By Global Warming
- Climate Attribution In Greece
- “Brown: ’50 days to save world'”
- The Catastrophic Influence of Bovine Methane Emissions on Extraterrestrial Climate Patterns
- Posting On X
- Seventeen Years Of Fun
- The Importance Of Good Tools
- Temperature Shifts At Blue Hill, MA
- CO2²
- Time Of Observation Bias
- Climate Scamming For Profit
- Climate Scamming For Profit
Recent Comments
- Bob G on The Real Hockey Stick Graph
- Bob G on The Real Hockey Stick Graph
- Jack the Insider on The Real Hockey Stick Graph
- Bob G on Analyzing The Western Water Crisis
- arn on Analyzing The Western Water Crisis
- Bob G on Analyzing The Western Water Crisis
- Bob G on Analyzing The Western Water Crisis
- Bob G on Analyzing The Western Water Crisis
- Hank Phillips on Analyzing The Western Water Crisis
- Hank Phillips on Analyzing The Western Water Crisis
If we could see a graph of the mesopause at the same sample time, you’d also see the amount of shit piled on by the AGW thieves…
Chewer:
You spelled that wrong! We would like to see more graphs of the Teams “Menopause”, like the ones Steven provides of the difference between reality and reported weather events! 😉
Here’s a view of that from outer space:
http://www.wallsave.com/wallpapers/1024×768/stencil/67675/stencil-superman-logo-thanks-to-eli-kennedy-manofsteel-utk-edu-67675.jpg
Steven Puts The Dunce Cap On The Team !
The Arctic Dunce Cap!