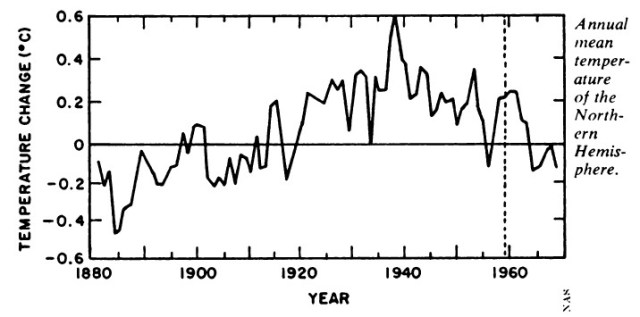
In 1975, the National Academy of Sciences published the graph below – showing that the 1930s were very hot in the northern hemisphere, and that there had been a sharp cooling trend since 1940.
Neither of these facts fit Hansen’s theory, so he largely got rid of both.
Data.GISS: GISS Surface Temperature Analysis: Analysis Graphs and Plots
GISS has a link on their web page to the data.
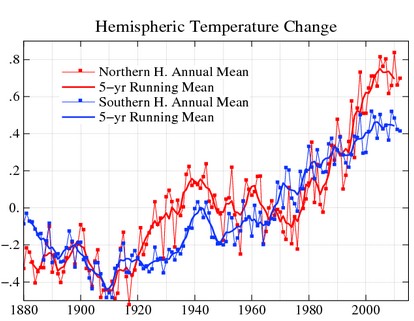
Annual and five-year running mean temperature changes with the base period 1951-1980 for the northern (red) and southern (blue) hemispheres.
available is a table
Data.GISS: GISS Surface Temperature Analysis: Analysis Graphs and Plots
Their public data link is of course forbidden, in the spirit of transparency.
Fortunately I was able to find a link in the Internet archive from 2010.
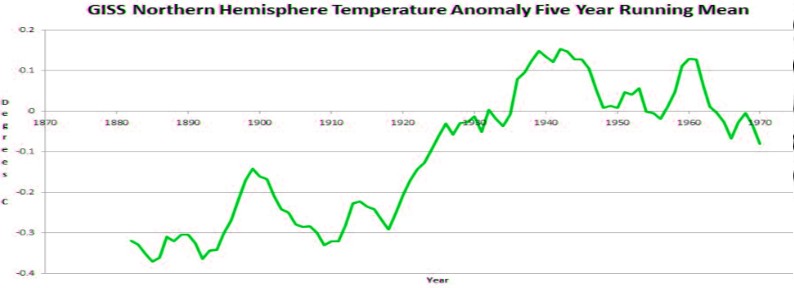
The graph below plots Hansen’s Northern Hemisphere five year running mean from that data set. Note that it shows very little cooling from 1940 to 1970.
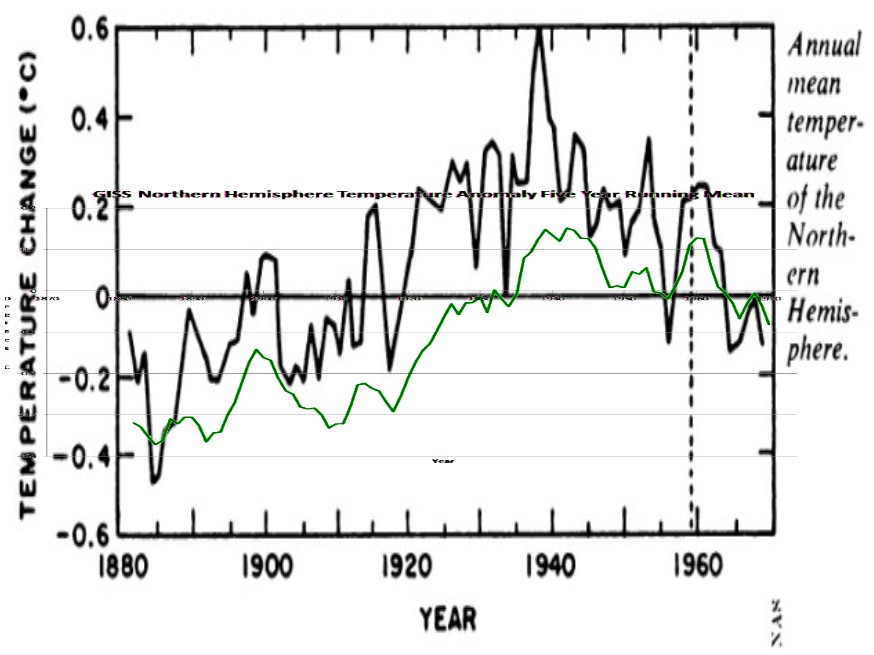
The next graph overlays Hansen’s 2010 version of northern hemisphere temperature on the 1975 National Academy of Sciences plot. Hansen has subtracted about 0.2C from most of the pre-1955 data. It is also safe to assume that the 2013 version is even more corrupt than the 2010 version, because he has cooled the past by an additional 0.1C since 2010.
This wonderful achievement by James Hansen has eliminated both that pesky 1930s hot period, and the global cooling scare.
Kudos to James Hansen for first rate government sponsored data tampering.
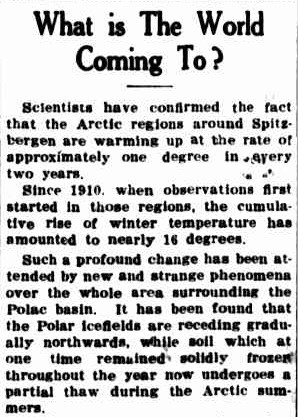
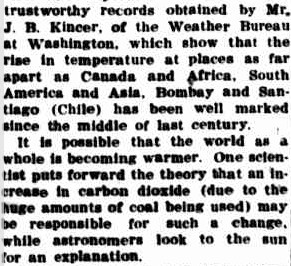
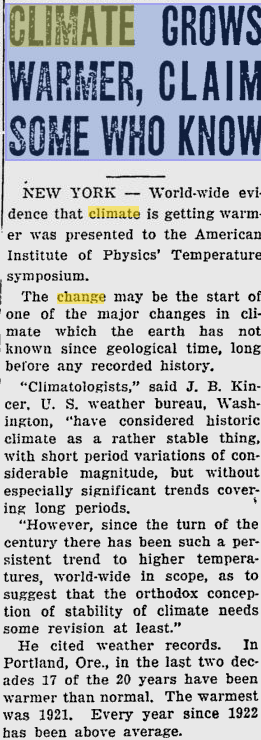
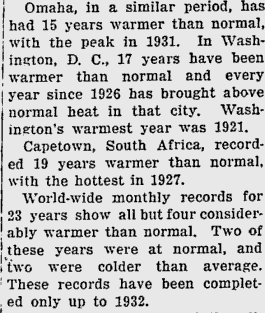
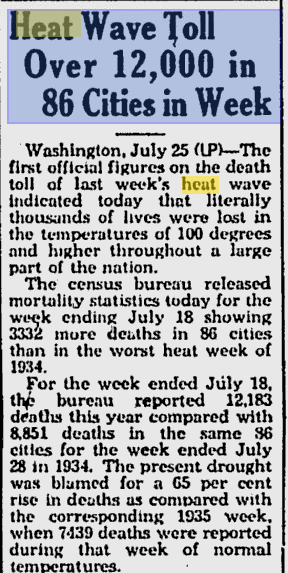
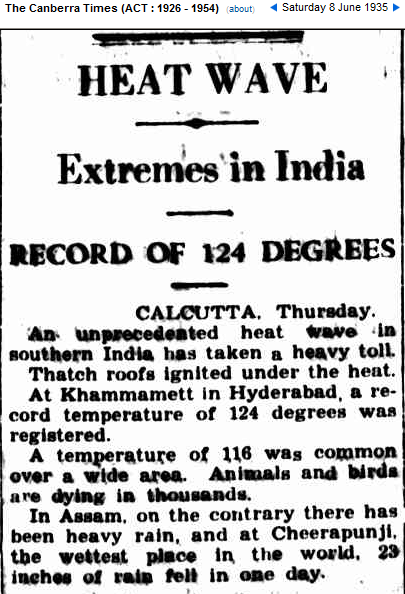
Unfortunately he wasn’t able to erase the newspaper records, which show that he is committing fraud.
Sixteen degrees of Arctic warming between 1910 and 1939. Last time I checked, the Arctic was part of the Northern Hemisphere.
http://trove.nla.gov.au/ndp/del/article/69638689?
http://news.google.com/newspapers





Leftists love to play God, because they believe there is a vacancy.
LOVE IT!
Steven,
IMO your title is too long “Hansen Kills Two Birds With One Stone”
reduce it to –
Hansen Kills…
Indeed!
Reblogged this on Climate Ponderings and commented:
Well done!
Steve, I was looking around for the original 1988 Hansen paper and noticed that NASA has moved or deleted it …
Hansen et al. 1988
It is the one with the three scenarios and is linked to by countless websites, both by warmies and normal people.
Any idea what they are up to? And where it is now, or where a copy might be?
( Links to flag Steve )
Sorry if you already mentioned this.
Yes, they are covering their tracks. You can get a copy here:
http://www.klimaskeptiker.info/download/1988_Hansen_etal.pdf
Blade, your link works just fine for me.
http://pubs.giss.nasa.gov/docs/1988/1988_Hansen_etal.pdf
That is wierd – I’ve seen that people have trouble accessing that – http://pubs.giss.nasa.gov/docs/1988/1988_Hansen_etal.pdf – before but every time I see it I have no trouble accessing it.
I’m from Australia and have no trouble at all – perhaps they’re blocking certain IP ranges
Try a public proxy server to access it and see what happens – maybe a southern hemisphere one.
SkepticalScience blocked my IP address – a good thing actually – I can link to their site by hiding my IP address but they’ve convinced me totally that they have no real science by this childish tantrum over someone who has a different point of view.
Alarmists are pushing harder for censorship now than at any time in the past decades when people were buying their BS.
Reblogged this on cosmoscon and commented:
The AGW Cult corruption is easily proven as they tamper with past temperature data. In a saner world, these guys would be in jail.
CNN, ABC, CBS & NBC will certainly make their viewers aware of these anomalies:)
These crazy bastards are on their last legs and they know it!