
Disrupting the Borg is expensive and time consuming!

Google Search
-
Recent Posts
- Analyzing The Western Water Crisis
- Gaslighting 1924
- “Why Do You Resist?”
- Climate Attribution Model
- Fact Checking NASA
- Fact Checking Grok
- Fact Checking The New York Times
- New Visitech Features
- Ice-Free Arctic By 2014
- Debt-Free US Treasury Forecast
- Analyzing Big City Crime (Part 2)
- Analyzing Big City Crime
- UK Migration Caused By Global Warming
- Climate Attribution In Greece
- “Brown: ’50 days to save world'”
- The Catastrophic Influence of Bovine Methane Emissions on Extraterrestrial Climate Patterns
- Posting On X
- Seventeen Years Of Fun
- The Importance Of Good Tools
- Temperature Shifts At Blue Hill, MA
- CO2²
- Time Of Observation Bias
- Climate Scamming For Profit
- Climate Scamming For Profit
- Back To The Future
Recent Comments
- Bob G on Analyzing The Western Water Crisis
- arn on Analyzing The Western Water Crisis
- Bob G on Analyzing The Western Water Crisis
- Bob G on Analyzing The Western Water Crisis
- Bob G on Analyzing The Western Water Crisis
- Hank Phillips on Analyzing The Western Water Crisis
- Hank Phillips on Analyzing The Western Water Crisis
- Hank Phillips on Analyzing The Western Water Crisis
- Hank Phillips on Analyzing The Western Water Crisis
- Bob G on Analyzing The Western Water Crisis
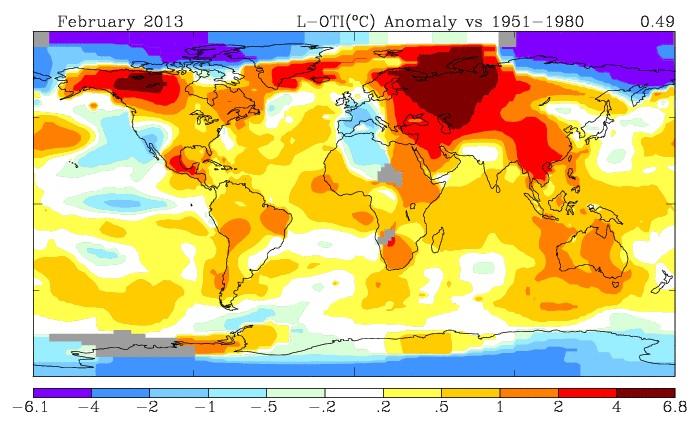
Ah, but Greenland was 1-2°C warmer than usual for February, making it only a few dozen degrees below freezing, which is why it was melting so fast.
/sarc
I was wondering why everything looked so warm over the US, and then noticed it is the 1951-1980 anomaly. WTF?
If you want to make Cherry Pie, You need to pick the best Cherries.
I see they’re still using a “normal” period that ended 33 years ago.
They’re afraid to use a newer averaging period: their anomalies won’t be as scary looking.
But just LOOK at that Arctic area – running somewhere between -4 and -6.8 degrees below “normal”, and yet the sea ice is scheduled to be totally gone by Sept.
You know, if “global warming” keeps up, they’re gonna need to make new colors on the negative end.
Aren’t these the same folks who say we cannot use pre-1979 data?
http://www.youtube.com/watch?v=qBJMZKgDj48
😉
Every town/city from Brisbane, (Australia) south to Taree and and out to the Northern Tablelands and North Western slopes had below average mean temps during February this year. Some places had their lowest or equal lowest on record.
Yet on Hansen’s map it is showing up as +0.2C – +0.5C. He has either:-
* adjusted the 1951 – 1980 data way below the actual temps;
* or adjusted this region’s temps very much upward;
* or shaded the area out using some magic pixelated formula only known to him.
This map is a sham and he should be held to account.
But that cold is just weather.
This years summer will show what climate is doing after all these forecasters couldn’t be wrong could they?
“The new NASA figures confirm that each decade is getting warmer and recent years have been even hotter. With the exception of 1998, the nine hottest years on the 132-year-old record have all occurred since 2000, with 2005 and 2010 considered the hottest, according to NASA. It has also been pointed out that 2012 is the hottest ‘La Nina’ year, when global weather patterns are supposed to keep temperatures lower.
Gavin Schmidt, a GISS climatologist, explained each successive year will not necessarily be warmer than the year before, but on the current course of greenhouse gas increases, scientists expect each successive decade to be warmer than the previous decade.
“One more year of numbers isn’t in itself significant,” he said. “What matters is this decade is warmer than the last decade, and that decade was warmer than the decade before. The planet is warming. The reason it’s warming is because we are pumping increasing amounts of carbon dioxide into the atmosphere.”
Previous figures put out by the UK Met Office agree that 2012 was the ninth warmest on record.”
I’ve bold the one line, as many climate worriers say that 15-17 years of no warming is not significant but clearly a decade in this context is.
http://www.telegraph.co.uk/topics/weather/9806568/British-summer-one-of-hottest-10-on-record-NASA-confirm.html