
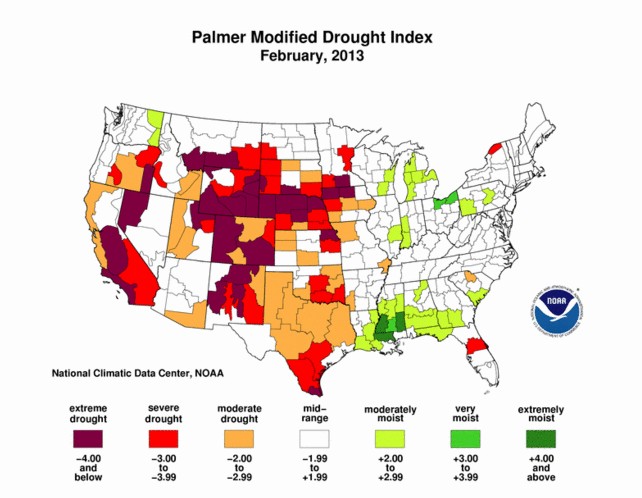
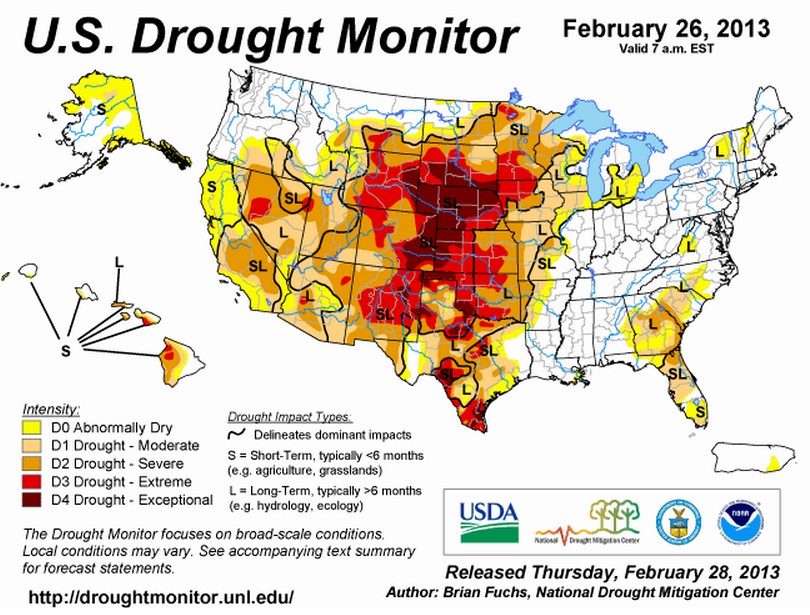
PMDI shows an excess of moisture in Georgia. and almost no drought in Arizona, but the Washington DC based US Drought Monitor artist forgot to check the actual data before getting out his airbrush.
PMDI shows an excess of moisture in Georgia. and almost no drought in Arizona, but the Washington DC based US Drought Monitor artist forgot to check the actual data before getting out his airbrush.

When was the first image published, and do you have a link to the source?
When would you guess that a February, 2013 drought map might have been published? In 1985 perhaps?
http://www1.ncdc.noaa.gov/pub/data/cmb/drought/historical-palmers/201302-pmdi.gif
A better link for Gina: http://www.ncdc.noaa.gov/temp-and-precip/drought/historical-palmers.php?index=pdsi&month%5B%5D=2&beg_year=2013&end_year=2013&submitted=Submit
Plug in your choice of months and years, suggest compare 2012 to 1988, the 1950s and 1930s:
1988 – http://www.ncdc.noaa.gov/temp-and-precip/drought/historical-palmers.php?index=pmdi&month%5B%5D=6&month%5B%5D=7&month%5B%5D=8&month%5B%5D=9&beg_year=1988&end_year=1988&submitted=Submit
1950s – http://www.ncdc.noaa.gov/temp-and-precip/drought/historical-palmers.php?index=pmdi&month%5B%5D=6&month%5B%5D=7&month%5B%5D=8&month%5B%5D=9&beg_year=1953&end_year=1956&submitted=Submit
1930s – http://www.ncdc.noaa.gov/temp-and-precip/drought/historical-palmers.php?index=pmdi&month%5B%5D=6&month%5B%5D=7&month%5B%5D=8&month%5B%5D=9&beg_year=1931&end_year=1937&submitted=Submit
Maybe one of them is short term drought, the oither long term drought? Whatever!
They use two different methods to determine “Drought” conditions! USDA is in the Chicken Little business even more than NOAA, and NOAA is into it over their heads.
Keep posting this stuff and the droughts in the past will start to dissapear, along with strem flow data.